Archive:Being young in Europe today - labour market - access and participation
- Data extracted in December 2017. Most recent data: Further Eurostat information, Main tables and Database. Planned article update: June 2021
This is one of a set of statistical articles that forms Eurostat’s flagship publication Being young in Europe today.
A paper edition of the publication was also published in 2015. In late 2017, a decision was taken to update the online version of the publication (subject to data availability).
Young people represent an important source of skills, creativity and dynamism and a better harnessing of these qualities could help Europe’s economy grow and become more competitive. However, the youth unemployment rate rose steadily during the period 2008-2013, turning it into a major concern for the EU; there followed three consecutive years of consistent falls in youth unemployment rates.
The Europe 2020 strategy dedicated two of its flagship initiatives to improving the employment situation of young people: Youth on the move, which promoted mobility as a means of learning and increasing employability (this campaign ended in December 2014), and An agenda for new skills and jobs (COM(2010) 682), which aimed to improve employability and employment opportunities for young people.
In order to reduce youth unemployment and to increase youth employment rates in line with the goals identified in the Europe 2020 strategy, a set of measures have been adopted at EU level:
- The Youth employment package, adopted in 2012, included a set of measures to facilitate school-to-work transitions. The Youth guarantee was one of these measures. It helps to ensure that all young people under the age of 25 get good-quality employment offers, continued education, or an apprenticeship/traineeship within four months of leaving school or becoming unemployed.
- The Youth employment initiative (2013) reinforced and accelerated measures outlined in the ‘Youth employment package’. It supports particularly young people not in education, employment or training in regions with a youth unemployment rate above 25 %.
- In June 2016, the European Commission adopted a new Skills Agenda for Europe (COM(2016) 381 final), based around 10 priority actions designed to provide the right training, skills and employment support to people in the EU.
- In December 2016, the European Commission proposed a Communication in relation to Investing in Europe’s Youth (COM(2016) 940 final), providing a renewed effort to provide young people with better opportunities: to access employment; through education and training; for solidarity, learning mobility and participation.
This article looks at the labour situation of young people from different perspectives. Firstly, the education and employment patterns characteristic of young people are examined. Next, the focus is put on the transition from education into the labour market by looking at the average age of students when leaving formal education, the average time elapsed between leaving formal education and starting a first job, and employment rates for young people after leaving education. In the final section, the situation of young people in the labour market is described by analysing employment rates, working arrangements (such as part-time and temporary work contracts), as well as unemployment rates.

(% share)
Source: Eurostat (edat_lfse_18)
(% share)
Source: Eurostat (edat_lfse_18)

(% share)
Source: Eurostat (edat_lfse_18)

(% share)
Source: Eurostat (edat_lfse_18)

(% share)
Source: Eurostat (yth_empl_150)
(% share)
Source: Eurostat (yth_empl_150)
(% share)
Source: Eurostat (yth_empl_150)

(% share of young men/young women)
Source: Eurostat (yth_empl_150)
(%)
Source: Eurostat (edat_lfse_24)

(%)
Source: Eurostat (yth_empl_010)

(%)
Source: Eurostat (yth_empl_010)

(%)
Source: Eurostat (yth_empl_010)
(%)
Source: Eurostat (yth_empl_010)

(%)
Source: Eurostat (yth_empl_010)
(% share)
Source: Eurostat (yth_empl_050)
(% share of total employment among people aged 15-24 years/25-29 years)
Source: Eurostat (yth_empl_060)
(% share of total employment among people aged 15-24 years/25-29 years)
Source: Eurostat (yth_empl_060)
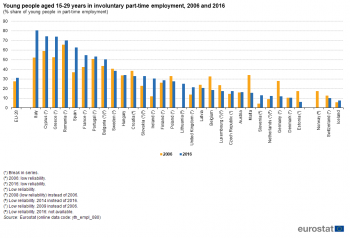
(% share of young people in part-time employment)
Source: Eurostat (yth_empl_080)

(% share of young men/young women)
Source: Eurostat (yth_empl_060)
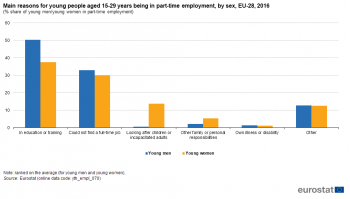
(% share of young men/young women in part-time employment)
Source: Eurostat (yth_empl_070)
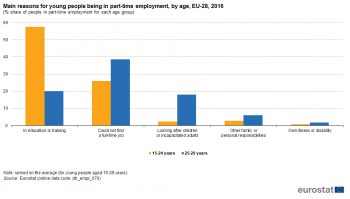
(% share of people in part-time employment for each age group)
Source: Eurostat (yth_empl_070)

(% share of labour force among people aged 15-24 years/25-29 years)
Source: Eurostat (yth_empl_100)
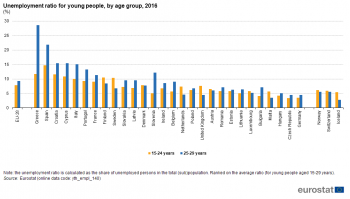
(%)
Source: Eurostat (yth_empl_140)
(% share of labour force among people aged 15-24 years/25-29 years)
Source: Eurostat (yth_empl_090)

(% share of labour force among people aged 15-29 years)
Source: Eurostat (yth_empl_090)

(% share of labour force among people aged 15-24 years/25-29 years)
Source: Eurostat (yth_empl_120)

(% share of labour force among people aged 15-24 years/25-29 years)
Source: Eurostat (yth_empl_120)
Main statistical findings
Education and employment patterns
A gradual change from education to employment
Compulsory schooling ends between the ages of 15 and 18 across the EU Member States. In 2015, more than 9 out of 10 young people in the EU-28 who were aged 17 remained within the education system, while approximately two fifths (41.4 %) of young people aged 20-24 years continued to participate in education. Young people have an opportunity to start work while they are still studying, for example, through evening, weekend or summer jobs. Furthermore, once they reach adulthood, it has become increasingly common for young people who remain in education to also have a job at the same time, perhaps reflecting the rising costs of tertiary education courses in some Member States.
Employed persons are all persons aged 15 years and over who worked at least one hour for pay or profit during the reference week or were temporarily absent from such work.
Taking both education (formal and non-formal) and employment situations into consideration, young people can be divided into four broad categories:
- exclusively in education;
- both in education and in employment;
- exclusively in employment; and
- neither in employment nor in education or training.
Figure 1 shows that these education and employment patterns differed considerably across the EU-28 according to the age of young people. In 2016, more than three quarters (78.1 %) of young people aged 15-19 years remained exclusively within the education system, while an additional 11.9 % combined their education with employment. Broadly similar shares of young people aged 20-24 years were exclusively in employment (33.4 %) or exclusively in education (32.6 %), while approximately one sixth (17.2 %) of this subpopulation combined education and employment and a similar share (16.7nbsp;%) were neither in employment, nor in education or training. By the time young people had reached 25-29 years, it was much more commonplace to find that they had completed their studies and moved into the labour force: in 2016, a majority (59.5 %) of this subpopulation were exclusively in employment. However, almost one fifth (18.8 %) of young people aged 25-29 years were neither in employment, nor in education or training, while 13.6 % of this age group combined education and employment opportunities and 8.0 % remained exclusively within the education system.
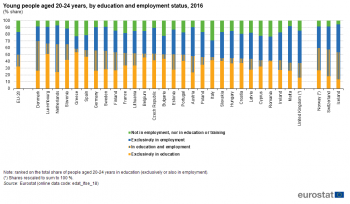
Figure 2 presents the education and employment status of young people aged 20-24 years in 2016. Across the EU-28, approximately half (49.8 %) of this subpopulation remained within the education system (exclusively or in combination with employment). A similar analysis for the EU Member States reveals there were 16 where a majority of young people aged 20-24 years continued with education (exclusively or in combination with employment); this share reached a peak of 69.9 % in Denmark, while Luxembourg, the Netherlands and Slovenia each recorded shares within the range of 65.0-66.2 %. By contrast, 41-42 % of young people aged 20-24 years from Cyprus, Romania and Ireland remained in some form of education, a share that fell to 38.3 % in Malta and a low of 37.5 % in the United Kingdom.
In 2016, Greece (53.3 %) and Luxembourg (50.9 %) were the only EU Member States to report that more than half of their young people aged 20-24 years remained exclusively within the education system (in other words, they did not combine education with employment). At the other end of the range, this share fell to less than a quarter of all young people aged 20-24 years in the Netherlands (24.2 %) and Austria (23.8 %), while the lowest share was recorded in the United Kingdom (16.2 %); these low shares may reflect, at least to some degree, differences in the length of time taken to complete tertiary education and/or different shares of young people combining their education with employment.
One third (33.4 %) of all young people aged 20-24 years in the EU-28 were exclusively in employment in 2016. This share was more than 40 % in Ireland, Austria and the United Kingdom and surpassed 50 % in Malta, which recorded the highest share among the EU Member States, 53.7 %. At the other end of the range, there were six Member States where less than a quarter of all young people aged 20-24 years were exclusively in employment. Shares of between 20-25 % were registered in Denmark, Spain, Slovenia, Italy and Luxembourg, with the share in Greece below this range (18.4 %).
Figure 3 presents a similar set of information but for young people aged 25-29 years; as may be expected it shows that a far larger proportion of this subpopulation in the EU-28 had followed the transition from education into the labour market. As noted above, in 2016, 59.5 % of young Europeans in this age group were exclusively in employment, while an additional 13.6 % combined education and employment. A majority (18.8 %) of the remaining young people aged 25-29 years were neither in employment, nor in education or training, leaving 8.0 % exclusively in education.
In 2016, the share of young people aged 25-29 years who were exclusively in employment was more than three quarters (76.8 %) in Malta, while shares above 70 % were also recorded in Lithuania, Romania and Poland. Otherwise, the transition from education into employment concerned a majority of young people aged 25-29 years in all but four of the EU Member States in 2016: Italy and the three Nordic Member States were the only exceptions. This could be explained, to some degree, by the relatively high (double-digit) shares of young people aged 24-29 years in Italy and the Nordic Member States who remained exclusively in education; Spain, Slovenia and Greece were the only other Member States to report shares above 10 %. In the Nordic Member States the relatively low share of young people aged 25-29 years exclusively in employment could also be attributed to a high share of this subpopulation combining education with employment opportunities, whereas in Italy almost one third (32.5 %) of all young people aged 25-29 years were neither in employment, nor in education or training; this was the second highest share among the Member States, just behind Greece (33.5 %).
The organisation of educational systems within individual EU Member States may explain, to some degree, the differences observed when analysing the transition from education to labour markets. As noted above, some of these differences may be linked to the average duration of degree courses: a bachelor’s degree may exceptionally be two years, but more often three or four years, while some master’s degrees may last one year and others two; for some subjects, for example medicine or architecture, studies typically last much longer than the usual time for a Bachelor’s degree; some courses include traineeships, placements or studies abroad. These differences in course lengths influence the proportion of students in education, whether exclusively or combined with employment.
Figure 4 shows developments during the period 2006-2016 for the education and employment status of young people aged 20-24 years in the EU-28. The impact of the global financial and economic crisis is apparent insofar as education and inactivity substituted employment during the period 2008-2012 or 2013, probably due to a lack of employment opportunities during the crisis which may have led some young people to defer their entry into the labour market, seeking instead further education or training to improve their employability, or even to return to education. From 2012 or 2013 onwards there were signs of a reversal in these patterns, as the share of young people aged 20-24 years exclusively in employment rose, while the share that was neither in employment nor in education or training fell.
A comparable analysis for young people aged 25-29 years in the EU-28 reveals there were similar fluctuations to those observed for young people aged 20-24 years. Between 2008 and 2013 there was a decrease in the share of young people aged 25-29 years who were exclusively in employment, down from 63.0 % in 2008 to 57.0 % in 2013, which was mirrored (to some degree) by an increase in the proportion of young people who were exclusively in education, their share rising from 7.0 % to 8.5 % during the same period.

© Fotolia
Young people neither in employment nor in education or training
Young people neither in employment nor in education were more numerous in the 25-29 years age group (than in younger age groups) and were more likely to be men than women
Any type of education or training (formal or non-formal) should potentially improve skills and employability. People who are neither in employment nor in education and training are often disconnected from the labour market and have a higher risk of not finding a job, which may lead to a higher risk of poverty and/or social exclusion.
The share of young people neither in employment nor in education and training (NEETs) is defined as the percentage of the young population that is simultaneously not employed and not involved in further education and training.
Compulsory schooling ends at the age of 15 in some of the EU Member States: however, it is more common for young people in the EU-28 to remain within the education system where they try to acquire more qualifications: among other benefits, this may help them to find a more interesting or better paid job when they eventually make the transition from education into the labour market. As already noted, in the age groups 15-19 and 20-24 years, it was more common to find a higher share of young people in the EU-28 remaining within the education system than being in employment or inactive; this section analyses in more detail the share of young people neither in employment, nor in education and training.
In 2016, 11.6 % of people aged 15-24 years and 18.8 % of people aged 25-29 years in the EU-28 were neither in employment nor in education or training. The lowest proportions of people aged 15-24 years neither in employment, nor in education or training were recorded in the Netherlands (4.6 %), Luxembourg (5.4 %), Denmark (5.8 %), Sweden (6.5 %) and Germany (6.7 %). At the other end of the range, the highest shares were recorded in Italy (19.9 %), Bulgaria (18.2 %) and Romania (17.4 %).
Comparing 2006 with 2016, there was scarcely any change in the EU-28 when analysing the proportion of young people aged 15-24 years who were neither in employment nor in education and training; this share fell by 0.1 percentage points (see Figure 5). Those EU Member States that recorded relatively high shares of young people aged 15-24 years neither in employment nor in education and training in 2016 tended to also report some of the biggest increases over the period 2006-2016. For example, the share of young people neither in employment nor in education and training rose by 5.3 points in Cyprus to 16.0 %, while increases of 3.8 points and 3.1 points were recorded in Greece and Italy; note that there is a break in series for both Cyprus and Greece. By contrast, those Member States characterised by relatively low shares of young people neither in employment, nor in education or training in 2016 often saw their shares fall during the period 2006-2016, this was particularly true, for example, in Germany and Sweden (note there is also a break in series for both of these).
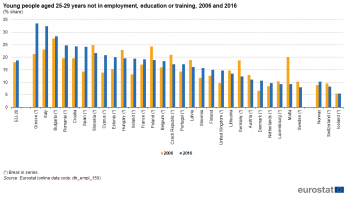
A similar analysis for young people aged 25-29 years in 2016 reveals that just over one third (33.5 %) of this subpopulation in Greece was neither in employment, nor in education or training; a similar share was recorded in Italy (32.4 %). At the other end of the range, less than 1 in 10 young people aged 25-29 years in the Netherlands, Luxembourg, Malta and Sweden was neither in employment, nor in education or training.
The share of young people aged 25-29 years in the EU-28 neither in employment nor in education and training rose by 0.8 points between 2006 and 2016. This relatively stable share hid some much larger fluctuations among the individual EU Member States, with considerable increases recorded in several southern Member States, notably, Greece (12.3 points), Spain (9.9 points) and Italy (9.4 points); note there is a break in series for both Greece and Spain. There were 11 Member States where the share of young people aged 25-29 years neither in employment, nor in education or training fell between 2006 and 2016. The largest fall — 10.9 points — was recorded in Malta, while decreases of 6.4 points and 5.4 points were recorded for Germany and Poland.
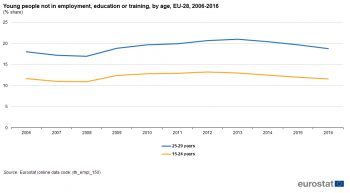
Figure 7 provides an overview of the development for the share of young people in the EU-28 neither in employment, nor in education or training during the period 2006-2016. It shows that in the years leading up to the global financial and economic crisis, this share was decreasing at a modest pace for both age groups that are presented. Following the onset of the crisis the share of young people neither in employment, nor in education or training started to increase, reaching a peak of 13.2 % for young people aged 15-24 years in 2012 and a peak of 21.0 % for young people aged 25-29 years a year later (when the largest gap between these two shares was recorded, at 8.0 points). Both shares subsequently started to decline and by 2016 the share of young people aged 15-24 years neither in employment, nor in education or training was 11.6 %, some 7.2 points lower than the share for young people aged 25-29 years (18.8 %).
Figure 8 presents the share of young people aged 25-29 years neither in employment nor in education or training, analysed by sex. In 2016, there was a 9.8 point gap between the sexes across the whole of the EU-28, with a lower share for young men. This pattern was repeated in each of the EU Member States with the gender gap rising to 23.2 points in the Czech Republic and 20.8 points in neighbouring Slovakia; these differences between the sexes are often attributed to a higher share of women devoting time to parenting or wider care responsibilities within families. At the other end of the range, there were eight Member States where the gap between the sexes for the share of young people aged 25-29 years neither in employment nor in education or training was less than 5.0 points; the smallest gaps were recorded in Sweden (2.8 points) and Lithuania (2.4 points).
Employment rates after leaving formal education
The employment rate is the percentage of employed persons in relation to the total population. For the overall employment rate, the comparison is made with the population of working-age (usually 20-64 years); but employment rates can also be calculated for other age groups, by sex, or for specific geographical areas.
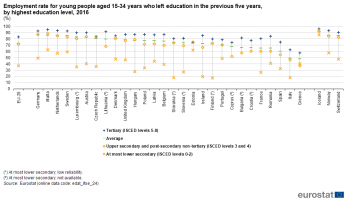
One important step during the journey into adulthood is the transition out of education into working life. As noted above, the organisation of education systems may play a role in determining whether or not this transition is abrupt with young people finishing their studies and beginning work or spread over a longer period of time with young people experiencing work placements, traineeships or internships while they continue to study, or after a period of inactivity. One way of analysing the success (or otherwise) of these different types of transition is to analyse employment rates among young people who recently left education. The analysis presented focuses on people who left education during the five years prior to the survey. In 2016, the EU-28 employment rate for young people aged 15-34 years who had left education during the previous five years was 73.2 %. The employment rate was considerably higher (83.1 %) among young people with a tertiary level of educational attainment, while it was much lower (37.0 %) for young people who had at most a lower secondary level of educational attainment (see Figure 9).
This pattern was repeated in almost all of the EU Member States, confirming that higher levels of educational attainment were generally beneficial to improving the employment opportunities of young people; note these figures do not provide any information as to the type of employment being carried out and it may be the case that some young people with a tertiary level of education were over-qualified for the post they occupied. The Czech Republic and Estonia were the only exceptions where the highest employment rates for young people who left education in the previous five years were recorded for people with an upper secondary or post-secondary non-tertiary level of education (rather than a tertiary level); in both cases the differences were relatively small.
In 2016, employment rates for young people aged 15-34 years who left education in the previous five years and were in possession of a tertiary level of educational attainment were 90 % or more in Malta, the Netherlands, Germany, Sweden, Lithuania and Luxembourg. By contrast, employment rates for recent young graduates with a tertiary level of education were just below 75.0 % in Spain, Estonia and Cyprus, and were 62.3 % in Italy and 57.6 % in Greece.
Youth employment rates by age
In 2016, there was a wide disparity between the EU-28 employment rates for young people aged 15-24 years (33.7 %) and young people aged 25-29 years (73.2 %). The highest employment rates for young people aged 15-24 years were recorded in the Netherlands (60.8 %), followed by Denmark (58.2 %), Austria (51.0 %) and the United Kingdom (50.8 %); all of the remaining Member States recorded rates below 50.0 %, with Bulgaria, Spain, Italy and Greece posting rates below 20.0 % (see Figure 10).
In 2016, the share of young people aged 24-29 years in employment was above four out of every five in Malta (87.5 %), Lithuania (83.3 %), the Netherlands (82.9 %), Luxembourg (81.8 %), the United Kingdom (81.4 %) and Austria (80.9 %), while the lowest rates were again recorded in Bulgaria (64.7 %), Spain (63.3 %), Greece (56.1 %) and Italy (53.7 %).
Figure 12 illustrates the development of employment rates for young people in the EU-28. These changed in a similar fashion for both age groups shown, with the employment rate for young people aged 25-29 years some 38-40 points higher than the rate for young people aged 15-24 years. Having peaked in 2008 prior to the global financial and economic crisis, EU-28 employment rates for young people consistently fell through to 2013, after which there was a modest recovery; note that the latest employment rates for 2016 remained lower than the levels recorded prior to the crisis.
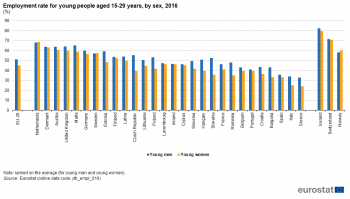
Employment rates across the EU were generally lower among young women than they were among young men (see Figure 15). In 2016, the employment rate of young people aged 15-29 years in the EU-28, stood at 51.0 % for men and at 45.2 % for women. With two exceptions — the Netherlands and Sweden — this pattern was repeated in each of the EU Member States, albeit to different degrees. Employment rates for young men were considerably higher than those for young women Slovakia (16.8 points difference) and the Czech Republic (15.6 points difference), while Romania, Poland, Hungary, Estonia and Bulgaria also recorded double-digit differences between the sexes.
Employment rates among young people varied considerably according to their level of educational attainment (see Figure 14): the EU-28 employment rate of those aged 15-29 years who had completed a tertiary education was 74.1 % in 2016, almost three times higher than the employment rate for young people who had attained no more than primary or lower secondary qualifications (24.5 %). The EU-28 employment rate for young persons with at most upper secondary or post-secondary non-tertiary qualifications stood at 55.9 %.
Temporary and part-time work contracts
Temporary and part-time work contracts are two types of agreement that young people come are often offered when entering the labour market.
Temporary employment includes work under a fixed-term contract, rather than a permanent work contract where there is no end-date. A job may be considered temporary employment (and its holder a temporary employee) if both employer and employee agree that its end is decided by objective rules (usually written down in a work contract of a limited duration). These rules can be a specific date, the end of a task, or the return of another employee who has been temporarily replaced.
According to the International Labour Organisation (ILO), part-time employment is defined as regular employment in which working time is substantially less than normal.
Temporary work contracts are quite common among young people entering the labour market. These types of contract, which often include seasonal employment, allow employers to adapt to changes in their demand for labour inputs; there is some evidence to suggest that young people who are out of work are more likely to accept these types of contract. Furthermore, employers may use temporary work contracts to assess the capabilities of new recruits before offering them a permanent position.
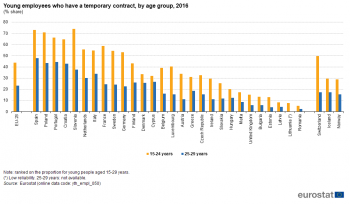
As shown in Figure 15, a higher proportion of young people worked with a temporary work contract: in 2016, more than two fifths (43.8 %) of young employees aged 15-24 years in the EU-28 had such a contract, which was almost twice as high as the corresponding share (23.1 %) among young people aged 25-29 years; this pattern of more temporary employees for the younger age group was repeated in each of the EU Member States for which data are available.
There were however substantial differences between the EU Member States: the rates of young employees (both age groups) working with temporary work contracts in 2016 were highest in Spain, Poland, Portugal, Croatia and Slovenia. Spain had the highest rate for both age groups, as almost three quarters of young employees aged 15-24 years had a temporary contract, while the share fell to just below half (47.8 %) among young employees aged 25-29 years. At the other end of the spectrum, Romania and the Baltic Member States were among the Member States with the lowest temporary employment rates in both age groups (note there is no information available for Lithuania for young employees aged 25-29 years). In Romania only 5.3 % of employees aged 15-24 years and 2.4 % of employees aged 25-29 years had a temporary contract. Country-specific regulations on temporary work contracts (for example, their maximum duration or renewal possibilities) and differences in national education systems relating to traineeships may explain, at least to some degree, some of these differences.
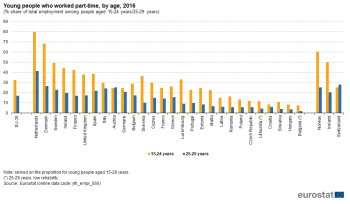
For many young people, part-time work may provide a good way of combining education and employment; however, part-time work may also be used by young people who wish to find a work-life balance (especially for those who are starting a family). As seen for temporary work, part-time work was more widespread among younger age groups. Within the EU-28, the part-time employment rate among young employed people aged 15-24 years stood at 32.4 % in 2016, while it was about half this rate for young people aged 25-29 years (see Figure 18). The highest part-time employment rates for the 15-24 years age group were recorded in the Netherlands (80.0 %) and Denmark (68.5 %), while Croatia, Hungary and Bulgaria were the only EU Member States to record shares that were below 10.0 %. A similar situation was apparent for young people aged 25-29 years as the highest part-time employment rates were again recorded for the Netherlands (41.4 %) and Denmark (26.7 %), although quite high rates were also registered in Austria (25.1 %) and Italy (24.1 %). At the other end of the range, there were 13 EU Member States where fewer than 10.0 % of all young persons aged 25-29 years worked on a part-time basis; this share fell to less than 5.0 % in Lithuania, Slovakia, Hungary and Bulgaria (where the lowest share was recorded, at 1.8 %).
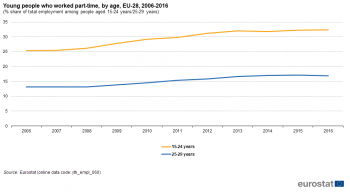
The percentage of young people working on a part-time basis in the EU-28 has increased over the latest 10-year period for which data are available (see Figure 17); this pattern was true both for young people aged 15-24 years and for young people aged 25-29 years. The share of young people working part-time rose at a relatively fast pace during the global financial and economic crisis and then showed signs of abating/stagnating from 2013-2016. In 2016, the proportion of young employed persons aged 15-24 years working on a part-time basis in the EU-28 stood at just less than one third (32.4 %), while the corresponding share for young employed persons aged 25-29 years was about half that recorded for the younger age group (16.9 %).
Part-time employment is not always a matter of personal choice — some young people work part-time because they cannot find a full-time job. Involuntary part-time employment refers to part-time workers who declare that they are working part-time because they could not find a full-time job.
From 2006 to 2016, the share of young people aged 15-29 years in part-time employment in the EU-28 who were in involuntary part-time employment increased from 27.7 % to 31.0 % (see Figure 18). The highest increases were recorded in some of the EU Member States where the impact of the global financial and economic crisis was particularly strong, for example, in Italy (28.3 points), Spain (25.8 points), Greece (21.2 points), Ireland (18.7 points) and Cyprus (15.2 points). By contrast, the share of involuntary part-time workers decreased in eight of the Member States, falling at its most rapid pace among young people aged 15-29 years in Malta (-18.4 points), Germany (-16.2 points), Belgium (-14.0 points) and Estonia (-11.5 points).
In 2016, part-time employment rates for young people aged 15-29 years were above 50.0 % in eight of the EU Member States and were particularly high in the southern Member States of Italy, Cyprus and Greece.
The prevalence of part-time work contracts was quite similar in the EU-28 among young men and young women (see Figure 19). In 2016, the part-time employment rate for young men aged 15-29 years was 32.9 %, which was slightly higher than the corresponding rate for young women of the same age (29.9 %). There were however some large differences between the sexes when looking at the data for individual EU Member States. For example, the share of employed young men working on a part-time basis was 16.8 points higher than the share for young women in Romania, while the gender gap was also greater than 10.0 points (with higher rates for young men) in Croatia, the United Kingdom and Slovakia. By contrast, part-time employment rates for young women were 13-14 points higher than for young men in Bulgaria and Portugal.
Some of the differences between young men and young women with regard to their part-time employment rates may be related to a range of different factors that are illustrated in Figure 20. It shows that in 2016, the primary reason for young people aged 15-29 years working on a part-time basis in the EU-28 was to be able to combine education and training with employment, while the second most important reason was not being able to find a full-time post. Together these two reasons were given by more than four out of every five young men in part-time employment, and for approximately two thirds of young women in part-time employment. A much higher share (13.8 %) of young women employed on a part-time basis did so because they were looking after children or incapacitated adults (for example family members); the share for young men was 0.5 %. In a similar vein, the share of young women working on a part-time basis due to other family or personal responsibilities was also higher (5.3 % compared with 2.2 % for young men).
Looking at the main reasons for part-time employment by age group, participation in education or training (57.4 %) and the inability to find a full-time job (25.9 %) were the two main reasons why young people aged 15-24 years in the EU-28 worked on a part-time basis in 2016 (see Figure 21). There was a somewhat different pattern for young people aged 25-29 years, as the relative importance of the two principal reasons was reversed: the inability to find a full-time job was the main reason given by 38.6 % of people working on a part-time basis, whilst being in education and training accounted for approximately one fifth (20.1 %) of the total, just ahead of looking after children or incapacitated adults (18.1 %).
Youth unemployment
Unemployment among young people
Young people, especially those with lower qualifications, still face difficulties in finding a job
The unemployment rate of young people increased in the aftermath of the global financial and economic crisis, with unemployment rates for young people rising at a faster pace than for the population in general. The main indicator for youth unemployment is called the ‘youth unemployment rate’ and refers to the age group 15-24 years.
The youth unemployment rate is the number of unemployed young people in the age group 15-24 years expressed as a share of the total labour force (economically active population) within the same age group.
The active population includes both employed and unemployed people, but not people who are economically inactive. When analysing information for young people aged 15-29 years the inactive tend to be school children, students or stay-at-home parents; inactive people do not work at all and are not available or looking for work.
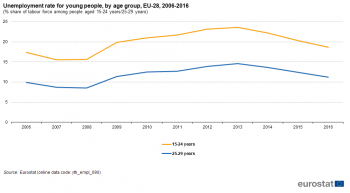
In 2016, 18.7 % of the EU-28’s labour force among young people aged 15-24 years and 11.2 % of its labour force for the 25-29 years age group were unemployed (see Figure 22). Unemployment rates were higher for the younger age group in each of the EU Member States. The unemployment situation of young people varied considerably between the Member States, although those recording the highest unemployment rates for young people aged 15-24 years also recorded the highest rates for young people aged 25-29 years. The highest rates were recorded in Greece (where almost half of the labour force aged 15-24 years was unemployed; 47.3 %), Spain, Italy, Croatia, Cyprus and Portugal. By contrast, at the other end of the range the lowest unemployment rates were recorded in Germany for the 15-24 years age group (7.1 %) and Malta for the 25-29 years age group (3.8 %); the Czech Republic, the Netherlands, Hungary, Austria and the United Kingdom also recorded relatively low unemployment rates for young people.
An analysis of the difference in unemployment rates between young people aged 15-24 years and young people aged 25-29 years reveals that the largest gaps were generally recorded in the EU Member States characterised by higher rates. In Spain, the youth unemployment rate (for young people aged 15-24 years) in 2016 was 18.8 points higher than the unemployment rate for young people aged 25-29 years, while in Italy the difference was 15.9 points; there were an additional nine Member States which recorded double-digit differences. At the other end of the range there was little difference between the unemployment rates for these two age groups in Slovenia (0.9 points) or Germany (1.8 points).
It is important to note that many young people study full time and so are not available for work and are therefore considered as being outside the labour force. For this reason, when presenting the labour situation of young people, the main indicator for unemployment, the youth unemployment rate, is often complemented by another indicator, the youth unemployment ratio, which compares the number of young unemployed persons with the total population (and not just the labour force) of the same age.
The youth unemployment ratio is the number of unemployed young people in the age group 15-24 years compared with the total population of that age group (those young people who are employed, unemployed and inactive), expressed as a percentage.
The youth unemployment ratio provides an alternative measure for analysing the labour market situation of young people. In 2016, the unemployment ratio for young people aged 15-24 years in the EU-28 stood at 7.8 %, while the corresponding ratio for the 25-29 years age group was 9.3 % (see Figure 23).
A comparison between the results shown in Figures 22 and 23 reveals that there was a stark contrast between the results for the unemployment rate and the unemployment ratio among young people aged 15-24 years. This may be largely attributed to the high numbers of young people aged 15-24 years who remained within full-time education and were therefore unavailable for work (and not included in the denominator used to calculate the unemployment rate).
In 2016, the highest unemployment ratio for young people aged 15-24 years was recorded in Spain (14.7 %), while Greece, Croatia, Cyprus, Finland, Sweden and Italy each reported that at least 1 in 10 young persons of this age were unemployed. Unemployment affected less than 1 in 20 young people aged 15-24 years in Hungary, Bulgaria, Germany and the Czech Republic (which had the lowest ratio, at 3.4 %).
In a majority of the EU Member States, the unemployment ratio for young people aged 15-24 years was lower than the ratio for young people aged 25-29 years. In 2016, this difference was greatest in Greece, at 16.9 points, with unemployment affecting more than one quarter (28.6 %) of all young people aged 25-29 years. The next largest difference (7.1 points) was recorded in Spain, where more than one fifth of all young people aged 25-29 years were unemployed, while the difference in unemployment ratios was also 7.1 points in Slovenia, where 12.2 % of young people aged 25-29 years were unemployed.
There were eight EU Member States where the unemployment ratio for young people aged 15-24 years was higher than the ratio for young people aged 25-29 years, although the difference between these two ratios was generally quite small. In Sweden, more than one tenth (10.4 %) of all young people aged 15-24 years were unemployed in 2016, which was 3.7 points higher than the unemployment ratio for young people aged 25-29 years (6.7 %). A similar pattern was observed in the United Kingdom, the Netherlands, Malta and Finland, where unemployment ratios for young people aged 15-24 years were at least 2.0 points higher than for young people aged 25-29 years.
The development of EU-28 unemployment rates for young people during the most recent 10-year period for which data are available (see Figure 24) clearly shows the impact of the global financial and economic crisis. Having fallen to a low point in 2007 or 2008 there was a rapid increase in EU-28 unemployment rates for young people, as successive increases were recorded up until 2013 when rates peaked at 23.6 % for young people aged 15-24 years and 14.6 % for young people aged 25-29 years. Thereafter, there were three consecutive years of falling rates, as the share of unemployed persons in the labour force among young people aged 15-24 years fell to 18.7 % and that for young people aged 25-29 years to 11.2 %; note that these latest rates remained at a higher level than before the financial and economic crisis.
Educational attainment is one of the most important factors that may be used to assess unemployment. Across the EU-28, the unemployment rate for young people aged 15-29 years with a tertiary level of education was 9.6 % in 2016, reaching 13.5 % among young people with an upper secondary or post-secondary non-tertiary level of education and peaking at 25.3 % among young people with at most a lower secondary level of education.
This pattern was repeated in the vast majority of the EU Member States in 2016, as Denmark and Slovenia were the only Member States where the lowest unemployment rate was not recorded for young people with a tertiary level of education, while Cyprus was the only Member State where the highest unemployment rate was not recorded for young people with at most a lower secondary level of education (see Figure 25).
Long-term unemployment among young people
Long-term unemployment is a major concern for policymakers across the EU. Apart from its financial and social impact on personal lives, long-term unemployment may also have a negative effect on social cohesion and, ultimately, can also hinder economic growth.
The long-term unemployment rate is defined as the proportion of the labour force who have been unemployed for at least 12 months.
EU-28 long-term unemployment rates for young people fell to relative lows in 2008 at the onset of the global financial and economic crisis, after which they rose at a fairly rapid pace until 2013 and then fell for three consecutive years; these patterns closely resembled recent developments for overall unemployment rates among young people. Having peaked in 2013 at 8.0 % for young people aged 15-24 years and 6.3 % for young people aged 25-29 years, long-term unemployment rates for young people in the EU-28 fell to 5.4 % and 4.5 % respectively (see Figure 26); as such, both of these rates remained 1.9 points higher than they had been in 2008, prior to the labour markets feeling the impact of the crisis.
Long-term unemployment rates varied considerably across the EU Member States in 2016 (see Figure 27). Greece and Italy stood out with by far the highest long-term unemployment rates for young people aged 15-24 years, as just over one quarter (25.1 %) and close to one fifth (19.4 %) of the young Greek and young Italian labour forces had been unemployed for more than 12 months. These two Member States also recorded the highest long-term unemployment rates for young people aged 25-29 years, at 22.6 % in Greece and 11.6 % in Italy. By contrast, long-term unemployment affected less than 1 in 20 persons aged 15-29 years in a majority of the EU Member States in 2016, while rates fell to less than 2.0 % in Austria, Estonia, the United Kingdom, Finland, Luxembourg, the Netherlands, Germany, Denmark and Sweden.
Data sources and availability
The main source of the data presented in this article is the [[Glossary:Labour_force_survey_(LFS)|EU labour force survey (EU-LFS)], a large sample survey among private households which provides detailed annual and quarterly data on employment, unemployment and inactivity. The data can be analysed by many dimensions including age, sex, educational attainment, and distinctions between permanent/temporary and full-time/part-time employment. The concepts and definitions used in the EU-LFS follow the guidelines of the International Labour Organisation (ILO).
Context
In November 2009, the Council of Youth Ministers adopted the EU Youth strategy for 2010-2018 which has two overall objectives:
- to provide more and equal opportunities for young people in education and in the labour market; and
- to promote active citizenship and social inclusion for all young people.
The EU’s Youth strategy proposes initiatives in eight different areas, namely:
- employment and entrepreneurship;
- social inclusion;
- participation;
- education and training;
- health and well-being;
- voluntary activities;
- youth and the world;
- creativity and culture.
In September 2015, the European Commission adopted a 2015 EU Youth report (COM(2015) 429 final); it presented a complete picture of the situation facing young people in the EU and analysed the impact of youth policies during the period 2013-2015.
The open method of coordination supports the implementation of the youth strategy: it is designed to encourage favourable conditions for young people to develop their skills, fulfil their potential and actively participate in society. This focus on young people was reinforced with the adoption in June 2010 of the Europe 2020 strategy for smart, sustainable and inclusive growth; it included a number of concrete initiatives to support young people in getting jobs and dealing with related challenges. Quality education and training, successful labour market integration and increased mobility were considered as key elements that might assist in unlocking the potential of young people and thereby help achieve the Europe 2020 objectives.
Youth on the Move — An initiative to unleash the potential of young people to achieve smart, sustainable and inclusive growth in the European Union presents a framework of policy priorities for action at national and EU level to reduce youth unemployment by facilitating the transition from education into work. Particular focus is put on the role of public employment services, promoting the youth guarantee scheme to ensure that all young people are in a job, in education or in training, while other priorities included establishing a European vacancy monitor and supporting young entrepreneurs.
See also
Further Eurostat information
Main tables
Database
- Participation in education and training (educ_part)
- Education and training outcomes (educ_outc)
- LFS main indicators (lfsi)
- Employment and activity - LFS adjusted series (lfsi_emp)
- Unemployment - LFS adjusted series (une)
- Labour market transitions - LFS longitudinal data (lfsi_long)
- LFS series - Detailed annual survey results (lfsa)
Dedicated section
Methodology / Metadata
- Educational attainment level and transition from education to work (based on EU-LFS) (ESMS metadata file — edat1_esms)
- Employment and unemployment (Labour force survey) (employ) (ESMS metadata file — employ_esms)
- Labour market transitions — experimental statistics
- LFS main indicators (lfsi) (ESMS metadata file — lfsi_esms)
- LFS series — detailed annual survey results (lfsa) (ESMS metadata file — lfsa_esms)
Source data for tables, figures and maps (MS Excel)
![]() Labour market — access and participation: tables and figures
Labour market — access and participation: tables and figures
External links
- European Commission, Directorate-General for Employment, Social affairs & Inclusion
- European Commission, Education and Training Monitor
- European Commission, Europe 2020 strategy
- European Commission, Strategic framework — Education and Training 2020
- International Labour Organisation (ILO)
