Archive:People in the EU - statistics on household and family structures
- Data extracted in November and December 2017. Most recent data: Further Eurostat information, Main tables and Database. No update planned for this article.
This is one of a set of statistical articles that forms Eurostat’s flagship publication People in the EU: who are we and how do we live?; it presents a range of statistics that cover the characteristics of households and family structures in the European Union (EU).
A paper edition of the publication was released in 2015. In late 2017, a decision was taken to update the online version of the publication (subject to data availability). Readers should note that while many of the statistical sources that have been used in People in the EU: who are we and how do we live? have been revised since its initial 2015 release, this was not the case for the population and housing census, as a census is only conducted once every 10 years across the majority of the EU Member States. As a result, the analyses presented often jump between the latest reference period — generally 2015 or 2016 — and historical values for 2011 that reflect the last time a census was conducted.
(% share of all households)
Source: Eurostat (ilc_lvph03)
(%)
Source: Eurostat (lfst_hhnhtych)

(% share of all households)
Source: Eurostat (ilc_lvph02)
(%)
Source: Eurostat (lfst_hhnhtych)
(per 1 000 inhabitants)
Source: Eurostat (demo_nind) and (demo_ndivind)
Main statistical findings
Households
The average size of households in the EU has been shrinking in recent decades. This pattern may be attributed to a range of factors, including: a rising share of people living independently; an increase in the share of the elderly living alone; declining fertility rates; higher divorce rates; and a shift in household structures away from extended families living together under the same roof towards more households being composed of ‘nuclear’ families, single-parent families and people living alone.
In the context of social surveys and the population and housing census, private households include single persons living alone and groups of people, not necessarily related, living in the same accommodation. A private household comprises persons resident in the same dwelling, where this dwelling is not an institution. In the EU statistics on income and living conditions (EU-SILC) survey, a private household is defined as a person living alone or a group of people who live together in the same private dwelling and share expenditures, including the joint provision of the essentials for living.
A household-dwelling unit consists of the permanent occupants of a dwelling collected on the basis of ‘usual residence’, in other words, the place where the respondent normally lives (aside from temporary absences for the purposes of recreation, holidays, visits to friends and relatives, business, medical treatment or religious pilgrimage). An institutional household comprises persons who have board, lodging, care or nursing at an institution. Institutional households include, for example, student halls of residence, old people’s homes, nursing homes, military barracks, prisons or religious institutions; the data presented in this article generally focuses exclusively on private households.
Families and other groups of people may pool their incomes to a greater or lesser extent: this is known as the ‘housekeeping concept’, which allows a distinction to be made between boarders and lodgers: boarders take meals with the household and are generally allowed to share/use the household’s facilities (housekeeping, common expenses, or a shared living/sitting room or dining area) and are therefore considered as members of the same household; by contrast, lodgers rent or hire part of a dwelling for their exclusive use and therefore belong to a different household.
Household composition: number of persons
According to the population and housing census conducted in 2011, there were 495.6 million people in the EU-28 living in a private household; this equated to 98.7 % of the total population. The remaining 6.7 million persons (1.3 % of the population) were living in institutional households or were homeless.
In 2016, almost two thirds of all households in the EU were composed of one or two persons
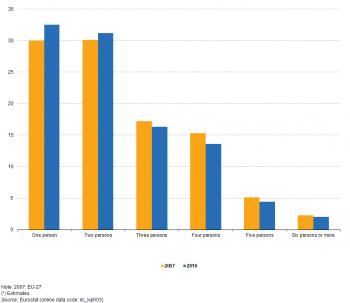
Fresher data is available from EU-SILC and this can be used to provide an analysis of household composition. In 2016, the two most common types of household in the EU-28 were those composed of one or two persons. They each accounted for almost one third of the total number of households, with single persons having a 32.5 % share and two person households a 31.2 % share (see Figure 1). Larger households were less common and accounted for a decreasing share: almost one sixth (16.3 %) were composed of three persons and 13.6 % by four persons, while households with more than four persons were relatively rare, those with five persons accounted for 4.4 % of the total and those with six or more persons for 2.0 %.
Between 2007 and 2016 the share of EU-28 households that were composed of one or two persons rose from 60.1 % to 63.7 %. By contrast, the relative importance of the other household types (by size) fell, with the biggest reduction — a fall of 1.7 percentage points — recorded among those households composed of four persons.
Average household size
Households in the EU had an average size of 2.3 persons in 2016
According to EU-SILC, the average size of private households in the EU-28 was 2.3 persons in 2016. This ratio ranged from highs of 2.8 persons in Croatia, Poland and Slovakia, down to an average of two persons per household in Denmark, Germany, Finland and Sweden. As such, households tended to be somewhat larger in size in those EU Member States that joined the EU in 2004 or more recently, while they were, on average, smaller in northern Member States.
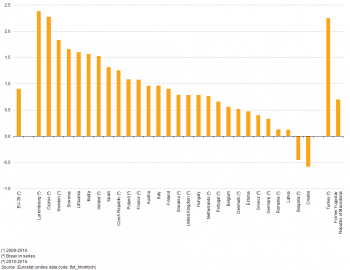
With the average size of private households decreasing and the total population of the EU-28 continuing to grow (albeit at a relatively slow pace), it is apparent that there was an increase in the overall number of households. According to the EU’s labour force survey (EU-LFS), the total number of private households within the EU-28 rose from 206 million in 2009 (the earliest period for which this indicator is available) to 220 million by 2016, equivalent to average growth of 0.9 % per annum (see Figure 2). In Luxembourg and Cyprus, there was a relatively fast expansion in the number of households (increases of more than 2.0 % per annum), whereas household numbers fell in Bulgaria (-0.5 % per annum) and Croatia (-0.6 % per annum).
More detailed information is available from the population and housing census, and this may be used to analyse the differences in the distribution of occupants per dwelling between capital regions and national averages (see Figure 3). The general pattern that may be observed across EU Member States is that there tends to be a higher (than the national average) proportion of dwellings inhabited by single persons in capital regions. Among the 23 EU Member States for which data are available (Croatia, Lithuania and Finland, not available; Cyprus and Luxembourg, no distinction made between national and regional data at this level of detail), only Estonia and Malta reported that a slightly higher share of dwellings at a national level were inhabited by single persons (the difference was no more than 1.1 percentage points). In contrast, a considerably higher share of the dwellings in the capital regions of Belgium, Poland, Germany and particularly France were inhabited by single persons (when compared with the national average for each of these countries), with differences in excess of 10 percentage points; this gap rising to 17.3 points between Paris and the French national average.
Single-person households
In 2016, single-person households accounted for almost one third (32.5 %) of the private households in the EU-28. Single-person households include those where a person lives alone in an individual, separate housing unit; they also include units where a single person lives independently, as a lodger, in a separate room (or rooms) in the same housing unit as other occupant(s) — for example, a self-contained flat within a residence that is occupied by other people. One of the main driving forces behind the fall in the average size of households has been an increase in the proportion of people living alone, which may be linked to a wide range of factors, including a reduction in the longevity of relationships (including higher divorce rates).
Figure 4 illustrates developments for four different types of single-person households during the period 2006 to 2016, based on information from EU-SILC. The relative share of all four types of single-person household in the total number of households rose over the period in question, with the highest increase recorded for single male households, up 2.5 percentage points to 14.1 %.
Single-person households: differences between EU Member States
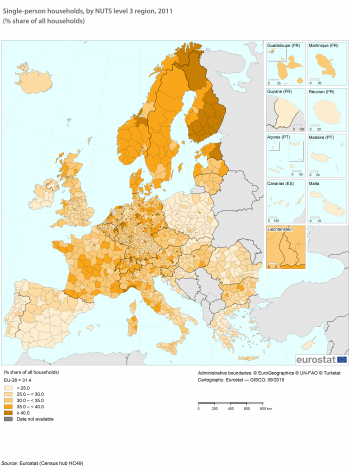
The proportion of households made up of people living alone in the EU-28 is split geographically insofar as more people in the northern and western EU Member States tend to live alone, while lower shares of single-person households are recorded in most of the southern and eastern Member States.
More than 50 % of households in Sweden, Denmark and Lithuania were composed of people living alone in 2016
In 2016, more than half of all households in Sweden, Denmark and Lithuania were composed of a single person, while shares of 40-45 % were recorded in Germany, Finland, Estonia, the Netherlands, France, Latvia and Austria. By contrast, single-person households accounted for close to one in four households in Poland, Portugal, Croatia, Slovakia and Malta (where the lowest share was recorded, at 23.2 %).
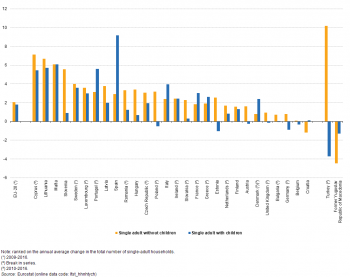
Figure 5 presents the change in the number of single-person households between 2006 and 2016; it is based on information from the EU-LFS. The number of single-person households in the EU-28 rose, on average, by 2.0 % per annum over this period. Croatia was the only EU Member State to report a fall in its number of single-person households, while there was no change recorded in Belgium. By contrast, the most rapid expansions in numbers of single-person households were recorded in Cyprus, Lithuania and Malta (where the average rate of change was 6-7 % per annum) and Slovenia (5.1 % per annum). As such, there was a pattern of catch-up, insofar as some of the fastest growth rates were recorded among those EU Member States that displayed a relatively low proportion of single-person households.
Single-person households: differences between the sexes
More women than men lived on their own in 2016
In 2016, a higher proportion of women (18.4 %) were living alone than men (14.1 %). This may, in part, be attributed to women outliving their (opposite sex) partners and therefore being more likely to live alone in old age, but also reflects a higher proportion of young women (than men) choosing to leave the parental home, while a larger proportion of young men stay longer at home with their parent(s). A high share of young adults (aged 18-24 years) in the EU-28 continued to live in the parental home: in 2016, some 84.1 % of young men were living with their parent(s), while the share for young women was 74.8 %.
A more detailed analysis by sex (again based on data from EU-SILC) reveals that women from the Nordic Member States and Baltic Member States, as well as those from Germany, were most prone to live alone, while women from Ireland, Malta, Cyprus and Spain tended to be less likely to live alone. Households composed of single women accounted for at least twice as many households as those occupied by single men in Latvia, Poland and Portugal and the proportion of households composed of women living alone was higher than the corresponding proportion for men in all of the remaining EU Member States; there was a small difference between the sexes in Denmark, Ireland, the Netherlands, the United Kingdom, Luxembourg, Malta and Sweden; this may be explained, at least in part, by relatively high numbers of young male economic migrants arriving in many of these countries in search of work.
The highest proportions of households composed of men living alone were recorded in many of the same EU Member States that recorded the highest shares of women living alone, namely, the Nordic Member States and Germany, although the proportion of households composed of men from the Baltic Member States who were living alone was equal to or lower than the EU-28 average. Men living alone accounted for less than 10.0 % of all households in Greece, Cyprus, Croatia, Poland, Slovakia and Portugal (where the lowest share was recorded, at 7.3 %).
Single-person households: growing old
According to EU-SILC, single-persons aged 65 years and over accounted for 14.1 % of all private households in the EU-28 in 2016. Their share rose to 18.3 % in Lithuania and was higher than 15 % in the other two Baltic Member States, as well as Bulgaria, Denmark, Romania and Finland. At the other end of the range, there was a relatively low likelihood of the elderly living alone in Cyprus (7.0 % of all households) and Luxembourg (8.9 %); these were the only EU Member States with single-digit shares. For more information on the elderly living alone and in institutional households, please refer to an article on An ageing society — focus on the elderly.
More detailed information is available from the population and housing census and this shows that there were 20.6 million persons aged 65-84 years who were living alone in the EU-28 in 2011; an additional 4.7 million persons aged 85 years and over were living in single-person households. Combining these figures, the elderly population aged 65 years and over accounted for almost 4 out of every 10 (39.0 %) single-person households in the EU.
In 2011, almost half of the people living alone in Croatia were aged 65 years and over
The proportion of single-person households accounted for by the elderly (aged 65 years and over) peaked at 49.3 % in Croatia, while shares of at least 45.0 % were recorded in Portugal, Italy and Lithuania. By contrast, the elderly accounted for less than one third of all single-person households in Cyprus, the Netherlands and Luxembourg (where the lowest share was reported, at 27.5 %).
Single-person households: a regional analysis
As noted above, capital regions often recorded some of the highest concentrations of single-person households, while the lowest proportions were generally recorded in more rural areas.
Single persons constituted more than half of all households in Paris and four German city regions in 2011
A more detailed analysis of single-person households is presented in Map 1. It is based on information from the population and housing census for 1 315 NUTS level 3 regions. In 2011, there were five regions in the EU where single-person households accounted for more than half of the total number of households, four of these were in Germany, namely: München, Kreisfreie Stadt; Flensburg, Kreisfreie Stadt; Regensburg, Kreisfreie Stadt; and Würzburg, Kreisfreie Stadt; while the fifth was the French capital region of Paris. However, the highest proportion (52.9 %) of single-person households was recorded in the Norwegian capital region of Oslo.
By contrast, there were just four regions in the EU where single-person households accounted for less than 15 % of the total number of households, all of which were located in northern Portugal, namely: Tâmega, Ave, Entre Douro e Vouga, and Cávado.
The proportion of single-person households also varied considerably between different municipalities within the same city
The information collected in the population and housing census allows an even more detailed analysis at the level of municipalities (although information at this level is only available for a restricted set of EU Member States). It is interesting to note that even within individual cities there were considerable differences in the proportion of single-person households. For example, in 2011, within the municipalities of Arrondissement de Bruxelles-Capitale/Arrondissement van Brussel-Hoofdstad, their share ranged from a high of 63.9 % in the central municipality of Ixelles/Elsene down to a low of 36.9 % in the western municipality of Berchem-Sainte-Agathe/Sint-Agatha-Berchem. In a similar vein, single-person households across the municipalities of Inner London accounted for between 68.8 % of all households in Queenhithe (a central area between the City and the river Thames characterised by office space and apartments) and 16.7 % of all households in East Ham (a municipality to the east of the Olympic Park characterised by terraced housing). More information pertaining to the proportion of single persons who owned their own dwelling is provided in an article on Home comforts — housing conditions and housing characteristics.
Other types of household
Eurostat has developed a common classification of household types which is applied across a range of social surveys. The classification is constructed by reference to the number of adults (their age and gender), and the numbers of dependent children living with them (with a distinction made between those aged under 25 years and those aged 25 years and over). The information that follows is derived from the population and housing census and covers 1 315 NUTS level 3 regions in the EU, describing the distribution of different household types across these regions.
One-family households
A one-family household, sometimes referred to as a ‘nuclear’ household, is defined as a household composed of a single family nucleus, in other words, a married/co-habiting couple (with or without children), a single father with children, or a single mother with children.
The highest proportion of one-family households — close to or above 80 % — was recorded in the northern Portuguese regions of Tâmega, Ave, Entre Douro E Vouga and Cávado (all close to Porto). There were 10 other regions where the share of one-family households was between 75 and 80 %; these included four other Portuguese regions (Pinhal Litoral, Baixo Vouga, the Região Autónoma Dos Açores and Dão-Lafões), three Spanish regions (Toledo, Cádiz and Murcia), and a single region from each of Italy (Barletta-Andria-Trani in Puglia), Greece (Pieria, to the south west of Thessaloniki), and Ireland (Mid-East, which surrounds Dublin).
Two or more family households
There were 27 out of the 1 315 regions in the EU where the share of two or more family households was in double-digits. Among these the vast majority were either in Poland or Slovakia, although there were also a couple of regions from each of Croatia and Romania. Four of these 27 regions reported that at least one in five households was composed of two or more families; all four of these were in Slovakia, namely, Kosický Kraj, Banskobystrický Kraj, Presovský Kraj and Trnavský Kraj.
Multi-person households
There were five regions in the EU where the share of multiperson households (composed of unrelated individuals) was in double-digits; all of these were in urban areas of the United Kingdom, namely: Inner London - East; Inner London - West; Outer London - West and North West; Nottingham; and Brighton and Hove. Among the 30 regions in the EU with the highest share of multiperson households composed of unrelated individuals, some 27 were regions in the United Kingdom, the three exceptions being Hlavní Mesto Praha (8.4 %), Byen København (7.7 %) and Heidelberg, Stadtkreis (also 7.7 %).
Families
There have been considerable changes in the household composition and living arrangements of Europeans: this is particularly true in relation to patterns of family formation, with traditional boundaries becoming increasingly blurred and different types of family nuclei becoming more common. The average age at which people get married has risen, as an increasing proportion of young people begin their adult lives by living alone or cohabiting, rather than leaving the parental home when they are ready to marry.
DEFINING FAMILIES AND CHILDREN
Traditionally, the family has been defined as a group of people who are linked through blood or marriage, typically centred on a married couple and their dependents. However, within the population and housing census a broader definition is applied. A family ‘nuclei’ is constituted when two persons (of either sex) choose to live together as a married couple, in a registered partnership, or in a consensual union, whether or not they have children; single parents with children also constitute a family unit, while people living alone do not, nor do groups of unrelated people who choose to share a house together (for example, students).
The family concept, as defined above, therefore limits relationships between children and adults to direct (first-degree) relationships, that is between parent(s) and child(ren). A child is a blood, step- or adopted son or daughter (regardless of its age or the marital status of its parents) who has their ‘usual’ residence in the household of at least one of its parents, and who has no partner or children of their own.
Marriage
The crude marriage rate was almost halved in the EU-28 between 1964 and 2014
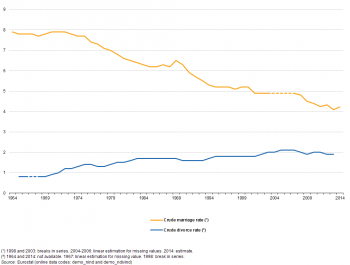
Eurostat’s annual demography data collection provides information in relation to marriages. It shows that there were 2.1 million marriages in the EU-28 in 2014, while the corresponding figure back in 1964 had been 3.4 million. Expressed in relation to the total population, the crude marriage rate fell from 7.9 to 4.2 per 1 000 inhabitants between 1964 and 2014 (see Figure 6).
In 2015, the highest crude marriage rates among the EU Member States were recorded in Lithuania (7.6 marriages per 1 000 inhabitants), Cyprus (7.2) and Malta (7.0), while Latvia and Romania both recorded crude marriage rates that were between 6.0 and 7.0 marriages per 1 000 inhabitants. By contrast, the lowest crude marriage rates were registered in Portugal and Slovenia (at 3.1 marriages per 1 000 inhabitants) and Italy (3.2 marriages per 1 000 inhabitants).
The increase in the share of people who delay getting married until after the age of 30 may be linked, at least in part, to some young adults considering cohabitation as a form of ‘trial marriage’, while others consider marriage only once they have decided to start a family.
In 2015, the mean age at first marriage for men was at least 30 years in all but two of the EU Member States, the only exceptions being Lithuania (28.9 years) and Poland (29.3 years). Men from the Nordic Member States (as well as Iceland and Norway) were most likely to defer getting married, with the highest mean age at first marriage recorded in Sweden (36.2 years), while the average age at first marriage for men was within the range of 34-35 years in Spain, Luxembourg and Denmark (as well as Norway).
The same countries also recorded the highest average ages for first marriage among women, peaking at 33.6 years in Sweden. The average age of women at first marriage was consistently lower than that recorded for men in each of the EU Member States, with the difference between the genders generally within the range of 2-4 years, falling to 1.8 years difference in Ireland, 1.7 years in Portugal and 1.4 years in Lithuania.
Almost three quarters of all family nucleii in 2011 were composed of married couples
More detailed information on different family units may be obtained from the population and housing census that was conducted in 2011. This shows that although marriage has become less prevalent, it remains a widespread institution. Indeed, almost three quarters (71.2 %) of all families in the EU-28 were composed of married couples. Put another way, registered partnerships, consensual unions and lone parent families accounted for just over one quarter (28.8 %) of all family nuclei.
Marriage remained a common form of family structure in many parts of Germany, as well as several of the southern and eastern EU Member States, including Greece, Croatia, Cyprus, Malta, Portugal and Romania. By contrast, it was less common as an institution in the Baltic Member States, France, Slovenia, Finland, Sweden and the United Kingdom.
In 2011, married couples accounted for a lower proportion of families in urban areas
Map 2 provides information on the share of married couples in the total number of families for NUTS level 3 regions. There were only five regions out of 1 315 across the EU where married couples accounted less than half of all families in 2011, they included three French overseas regions of Guadeloupe, Martinique and Guyane and two urban regions from the United Kingdom (Glasgow City and Inner London). These regions recorded some of the highest proportions of lone parent families (see below for more details). Married couples accounted for between 50 % and 60 % of all families in a number of capital regions — Byen København, Rīga, Põhja-Eesti (which includes Tallinn), Paris, Groot-Amsterdam, Stockholms län and Budapest.
Divorce
Crude divorce rates in the EU more than doubled between 1965 and 2013
It has been legal to seek a divorce in all 28 of the EU Member States since legislation was introduced in Malta in October 2011. The lowest divorce rates in the EU are often recorded in those Member States where adherence to religious (Catholic and Orthodox) and traditional family values form the foundations on which many families are built.
The information presented in this section on divorces is derived from Eurostat’s annual demography data collection. There were almost one million divorces in the EU-28 in 2013: the crude divorce rate stood at 1.9 divorces per 1 000 inhabitants, compared with a rate of 0.8 divorces per 1 000 inhabitants in 1965.
Among the EU Member States, crude divorce rates peaked in Lithuania and Denmark at 3.2 and 2.9 divorces per 1 000 inhabitants in 2015. Their rates were considerably higher than in any of the other EU Member States, as the next highest rates were recorded in Estonia and Latvia (both 2.6 divorces per 1 000 inhabitants). By contrast, the crude divorce rate was below 1.5 divorces per 1 000 inhabitants in Croatia, Italy, Greece (2014 data) and Slovenia, falling to less than 1.0 divorce per 1 000 inhabitants in Malta and Ireland (2013 data).
Alternatives to marriage?
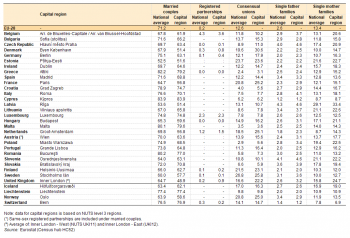
Table 1 shows a further selection of data from the population and housing census. It indicates that people living in some of the EU’s northern and western capital regions — including Byen København, Berlin, Groot-Amsterdam and Inner London — were much less inclined to be married (than the national average). This pattern of married couples accounting for a lower share of all family units than the national average was repeated for each of the EU’s capital regions; note that there is no distinction between the national average and the capital region at NUTS level 3 in either Cyprus or Luxembourg. Furthermore, the share of families constituted by consensual unions was generally higher than the national average in most of the EU’s capital regions, although this was not the case in Belgium, the Baltic Member States, Slovenia, Slovakia and Sweden.
More detailed information from the population and housing census in 2011 shows that while married couples accounted for 47.0 % of all family units in the municipality covering the city of Amsterdam, within the areas surrounding the Dutch capital the proportion of couples who were married was considerably higher. For example, in three municipalities to the north of Amsterdam (Waterland, Zeevang and Edam-Volendam) 75 to 80 % of families were composed of married couples. A similar analysis for Inner London - West reveals that the share of married couples in family units peaked at 72.3 % in Knightsbridge and Belgravia, while fewer than 45 % of family units in Kentish Town, Kilburn, King’s Cross, Queen’s Park and Shepherd’s Bush Green were composed of married couples.
In 2011, the proportion of lone mothers was higher than the national average for each of the EU’s capital regions
Each of the EU’s capital regions was also characterised by a relatively high proportion of lone mother families (single mothers who live with at least one child). This was particularly true in Arrondissement de Bruxelles-Capitale/Arrondissement van Brussel-Hoofdstad, Berlin, Groot-Amsterdam and Inner London, where the share of lone mother families in the total number of families was at least 5 percentage points higher than the national average in 2011.
Capital regions were also characterised by a high proportion of same-sex couples in 2011
There has been an expansion in the proportion of people living together in a consensual union (as opposed to being married), while several EU Member States have legislated to provide legal recognition of registered partnerships, civil unions and same-sex marriages.
With the results of the Irish referendum in May 2015, the number of EU Member States which legally recognise same-sex marriage rose to 13 (Belgium, Denmark, Germany, Ireland, Spain, France, Luxembourg, Malta, the Netherlands, Portugal, Finland, Sweden and the United Kingdom); same sex marriages are expected to become legal in Austria at the start of 2019; Greece, Cyprus and Italy have legalised civil unions between same-sex couples; and Estonia recognises same-sex marriages that are performed abroad. Same sex couples may also get married in Iceland and Norway. In some of the other EU Member States, marriage continues to be defined as a union between a man and a woman, effectively prohibiting the legalisation of same-sex marriages; these are generally eastern EU Member States, although there are a wide range of on-going legislative proposals to ban, or to introduce or strengthen the legal basis for same-sex partnerships and/or marriages.
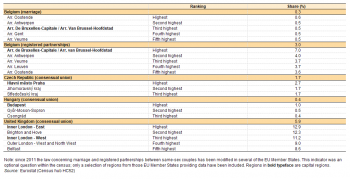
Table 2 provides a selection of the limited set of information that is available from the population and housing census, detailing those NUTS level 3 regions with the highest proportion of same-sex couples. Note that recent legislative changes within this domain have sometimes been enacted since the last population and housing census and as a result there are relatively few official statistics on same-sex partnerships and same-sex marriages. For example, same-sex marriage was introduced after the census of 2011 in Denmark, Germany, Ireland, France, Luxembourg, Malta, Finland and the United Kingdom.
In the Belgian capital region, same-sex couples accounted for 7.0 % of all registered partnerships (compared with a national average of 3.0 %) and for 0.5 % of all marriages (compared with a national average of 0.3 %). Same-sex couples accounted for a relatively high proportion of registered partnerships and marriages in a number of predominantly urban arrondissements (NUTS level 3 regions) in the Flemish region, while they were generally less common in rural regions, especially in the south of the Walloon region.
A similar pattern was observed in the Czech Republic, Hungary and the United Kingdom, as same-sex couples accounted for a relatively low share of those living in a consensual union in rural and isolated regions, and for a relatively high proportion of those living in a consensual union in urban areas and, in particular, capital regions. Some 2.7 % of those living in a consensual union in the Czech capital region of Hlavní město Praha were same-sex couples (compared with a national average of 1.7 %), while same-sex couples accounted for 1.0 % of those living in a consensual union in the Hungarian capital region of Budapest (compared with a national average of 0.4 %). Within the United Kingdom, less than 2 % of consensual unions in the remote Scottish regions of the Orkney Islands, the Shetland Islands, and Caithness & Sutherland and Ross & Cromarty were constituted by same-sex couples. This could be compared with the situation in Inner London, where same-sex couples accounted for more than 10 % of those living in a consensual union, which was also the case in the southern coastal region of Brighton and Hove.
Raising children
More than half of all married couples had dependent children living at home in 2011
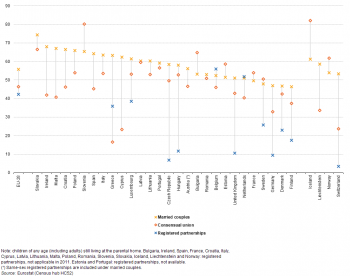
Although there has been a steady increase in the proportion of children born out of wedlock, marriage remains the most common form of family unit for raising children. The population and housing census conducted in 2011 shows that 55.8 % of all married couples in the EU-28 had children who were still living at home in the parental house (irrespective of their age); this share ranged from a low of 46.5 % in Finland up to a high of 74.4 % in Slovakia.
Slightly less than half (46.4 %) of all couples living in a consensual union in the EU-28 had children who were living at home, while some 42.3 % of couples living together as a registered partnership had children who were living at home; note that registered partnerships are restricted to same-sex couples in some of the EU Member States and this may, at least in part, explain why a relatively low proportion of these couples have children living at home.
Figure 7 supports the view that some people choose to formalise their union as they start a family; this pattern was most apparent in Greece, Cyprus, Malta, Ireland, Croatia and Spain, where a much higher proportion of children were born into families constituted by a married couple. These figures may be explained, at least to some degree, by the prominence of traditional religious values. By contrast, the proportion of couples living in a consensual union with children still living at home was higher than the corresponding share for married couples in Slovenia, Bulgaria, Estonia, France and Sweden.
In 2011, single parent families accounted for approximately one sixth of all family units in the EU
The population and housing census also provides evidence that families composed of lone parents (either a single mother with children or a single father with children) accounted for 16.0 % of the total number of families in the EU-28 in 2011 (see Map 3). These were predominantly lone mother families, as they accounted for 13.4 % of all families, compared with 2.6 % for lone father families. This difference between the sexes was most pronounced in the Baltic Member States, Poland and Slovakia, where the share of lone mother families was at least 15 percentage points higher than the corresponding share of lone father families. By contrast, the smallest gender gaps were recorded in Denmark, Germany, Cyprus, the Netherlands and Sweden.
As noted above, the highest proportions of lone parent families were often recorded in those NUTS level 3 regions where the share of married couples in the total number of families was particularly low. This was the case in Latvia, several French overseas regions (Martinique, Guadeloupe and Guyane), as well as some urban regions in the United Kingdom (Belfast, Liverpool, Glasgow Central and Inner London - East); relatively high rates of lone parent families were also recorded in Lithuania, Hungary, Poland and Slovenia. By contrast, lone parent families accounted for a relatively low proportion of all families in the Netherlands and Cyprus, as well as selected regions from northern Belgium, Denmark, Germany, western France, Finland and Sweden.
The population and housing census also provides a more detailed analysis at the level of municipalities. In 2011, there were five municipalities across the whole of the EU where the proportion of lone mother families rose to over 30 % of the total, they included: three French overseas regions (Martinique, Guadeloupe and Guyane), Rīga (the capital of Latvia) and Belfast (Northern Ireland). There were four municipalities in the EU where the share of lone father families was above 5 %. All four of these were in Spain: two municipalities from the Canary Islands (La Gomera and Fuerteventura) and the two autonomous cities of Ceuta and Melilla.
Belfast — which had one of the highest proportions of lone parent families in the EU, at 34.6 % — recorded considerable differences in the proportion of lone parent families between its municipalities. More than 60 % of families in the northern and western municipalities of New Lodge, Falls, Ardoyne and Whiterock were lone parent families, a share that fell to less than 15 % (in other words, just below the EU average) in the eastern and southern municipalities of Finaghy, Cherryvalley, Stranmillis, Malone and Stormont. By contrast, in the Dutch NUTS level 3 region of Noord-Overijssel — which recorded the lowest share (7.7 %) of lone parent families in the EU-28 — there were relatively small differences in the proportion of lone parent families, ranging from 10.1 % in the regional capital of Zwolle, down to a 5.3 % share in the municipality of Staphorst.
See also
- All articles from People in the EU: who are we and how do we live?
Further Eurostat information
Main tables
Database
Dedicated section
Source data for tables and figures (MS Excel)
Other information
- EU legislation on the 2011 Population and Housing Censuses — Explanatory Notes
- Legislation relevant for the population and housing census
- Target variables and common guidelines for EU-SILC
- Legislation relevant for income and living conditions statistics
- Demographic statistics: a review of definitions and methods of collection in 44 European countries
- Legislation relevant for population statistics
External links

