Archive:Marriages and births in Austria
This Statistics Explained article is outdated and has been archived - for recent articles on Population see here.
Births and marriages reflecting changes in Austrian society
- Author: Statistics Austria
- Data extracted in November 2015.
This article on marriages and births is part of a pilot project implemented by Eurostat together with the Member States. The aim of the pilot project is to better reply to users' needs by complementing the Eurostat article presenting data on an EU level with more detailed information on the same topic, but at national level. Articles from the participating Member States are available in the corresponding national languages as well as in English and they form, together with the Eurostat article, an online publication.
Main statistical findings
Marriages
The frequency of marriage has halved during the past 50 years in Austria
The number of marriages in Austria amounted to about 60 000 at the beginning of the 1960s, shrank to approximately 45 000 by 1970 and since then remained stable almost up to the millennium. Following the post-war low recorded in 2001 (34 213), on average some 37 000 marriages were contracted annually during the 2000s. From 2010 onwards, there were between 36 000 and 39 000 annual marriages. In 2014, 37 458 marriages were celebrated in Austria, i.e. 4.4 marriages per 1 000 population. In relation to the population, the number of marriages was more than 8 per 1 000 inhabitants at the beginning of the 1960s, then constantly decreased to about 4.2 in 2008. Since then, the marriage rate has remained fairly stable, varying between 4.2 and 4.6 marriages per 1 000 population.
Exceptions to this trend occurred in 1983 and 1987: In these years, Austrian marriage numbers were unusually high due to legal changes that reduced and later removed financial subsidy by the state for marriage.
Nowadays men marry eight years later and women nine years later than in the 1970s
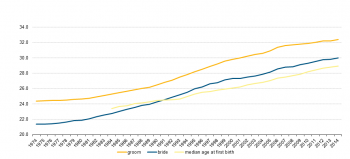
The median age at first marriage in Austria was 32.4 for men in 2014 and 30.0 for women. It has risen constantly since 1974, when it was 24.4 for men and 21.4 for women. Since 2000 alone, the increase has been 2.6 years for men and 2.7 years for women.
Nevertheless, the median age difference between groom and bride has remained remarkably stable since the beginning of the 1980s, varying just between 2.2 and 2.4 years.
It is also interesting to note that since 1991 the median age at birth of the first child is lower than the median age at marriage (cf. chapter births).
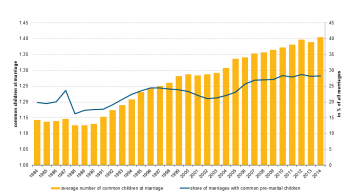
This development is also visible in the share of couples with children at marriage, which rose from 20 % in 1984 to 25 % in 1996 and 29 % in 2014. The number of common children at marriage during the same time increased more significantly from 1.14 in 1984 to 1.40 in 2014. However, the rise was not linear, but rather occurred in stages during the first half of the 1990s and since 2006. During the second half of the 1980s, the number of common children at marriage actually decreased slightly, which may well also be a result of the shrinking number of births around that time. While the share of marriages with common children has not evolved significantly, the number of children legitimised through marriage has seen some growth.
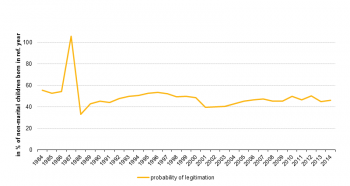
The declining social relevance of marriage for raising families may also be indicated by the reduction in the probability of extra-maritally born children to become legitimised. It does not decrease continuously, but appears to follow an oscillating pattern with an overall declining tendency. Thus, the probability for legitimisation was 55 % in 1984 and 46 % in 2014. Around the millennium, it was only at about 40 %, while in the exceptional year 1987 it was statistically over 100 % (cf marriages). A value of more than 100 % is possible due to the method of calculation of legitimisation probabilities. This relates the number of observed legitimisations in the reference year to the number of non-marital births during the same year. It then assumes that legitimisation rates observed in the reference year will not change over time. If the number of legitimisations is higher than the number of extra-marital births during the reference year, the probability would be greater than 100 %.
Births
Number of births in Austria has shrunk by 40 % since the mid-1960s
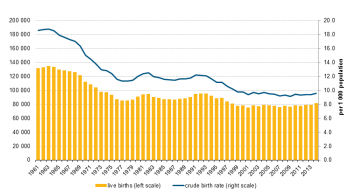
From a maximum of almost 135 000 births in Austria in 1963 the number of births declined to an all-time low of 75 000 in 2001. In the 1980s and 1990s, the number of live births averaged 90 000 a year, with figures peaking in 1982 (94 840) and 1992 (95 302). From 2001 to 2011, the total of live births ranged between 75 458 (2001) and 78 968 (2004). Since 2011, the number of live births has again slightly increased, to reach 81 722 in 2014, the highest figure since 1998.
Crude birth rates in Austria almost halved since the baby-boom of the 1960s
However, crude birth rates continue to decline from almost 19 live births per 1 000 population in 1963 to only 9.6 in 2014. The decline was most marked during the periods 1965–1975 and 1993–1999, with the rates remaining more stable for most of the other periods.
More than half of first children in Austria born extra-maritally since 2007
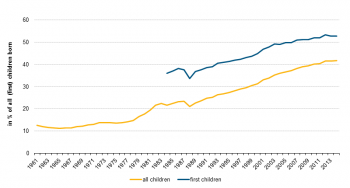
The proportion of live births out of wedlock increased from an all-time low of 11.2 % in 1965 to 41.7 % in 2014. It was even higher for first births, increasing from 36.0 % in 1984 (earlier figures are not available) to 52.6 % in 2014. Thus, since 2007, more than half of all first births occur extra-maritally.
Austrian women have an average of 1.46 children
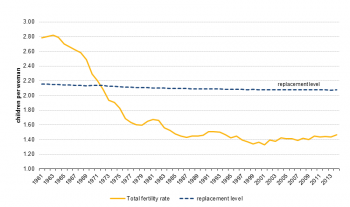
The total fertility rate was 1.46 children per woman in 2014, meaning that if age-specific fertility rates remained constant in the future, a 15-year-old woman can statistically expect 1.46 live births before her 50th birthday. At the beginning of the 1960s, women in Austria on average could statistically expect to have 2.80 children. This subsequently dropped to an all-time low of 1.33 in 2001 and has since risen again.
Yet, the current average is still well below the so called “replacement level”. This measures the number of children per woman necessary to completely replace the parent generation. Taking into account the mortality of children before entering reproductive age, in 2014 women on average would have needed to have 2.07 children to completely reproduce their generation. This is measured by the so called “net reproduction rate”, which was at 71 % in 2014 meaning that the generation currently at reproductive ages will numerically not reproduce itself by a margin of 29 %. Total fertility fell below the replacement level in Austria in 1972 and has remained there since. This means that – notwithstanding international immigration – during the last 40 years each generation of potential mothers shrank by 28 % on average.
In 2014, women became mothers on average five years later than in 1984
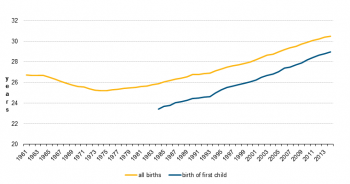
The fact that the period fertility is so low in Austria is also due to the ever rising age at childbirth (“postponement” of births). The median fertility age in 2014 was 30.5 , i.e. 2.5 years higher than in 2000. The median age at birth has been constantly on the rise since 1974, when it was 25.2. 40 years ago, women in Austria thus were about 5.3 years younger at birth of their children. Detailed studies show that the median fertility age at the birth of the first child has risen particularly fast: in 2014 it was 29.0 , i.e. 2.9 years higher than in 2000 and 5.5 years higher than in 1984 (the first year for which data is available).
Timing of motherhood has changed considerably in Austria during the last 50 years
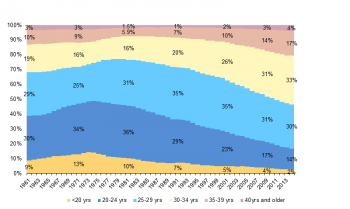
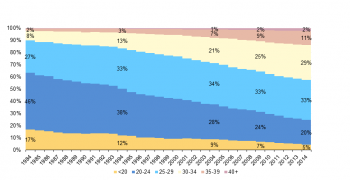
The trends for rising age at birth are also clearly visible in the age distribution of mothers at birth. Since the beginning of the 1960s there have been reverse developments in the timing of motherhood. While in the 1960s and the first half of the 1970s, the share of births to younger women under 25 years of age increased considerably, there has been a marked decline ever since. Thus, in 1961 some 39 % of births were to mothers of an age below 25 years, while in 1974 almost half of all births (49 %) were to this age group. This share subsequently fell to only 16 % in 2014. The evolution was similar for the subgroups of women under 20 years and between 20 and 24 years old.
In contrast, the share of births to women between 25 and 29 years has evolved in the opposite direction, first decreasing during the 1960s, then rising sharply during the 1970s and 1980s. It remained quite stable during the 1990s and eventually declined only after the millennium with the postponement of births into the early thirties becoming more common.
Births to mothers in their early thirties represented 19 % of all births at the beginning of the 1960s and remained quite stable until the beginning of the 1990s. However, the underlying reasons were quite different: While in the 1960s it was quite common to have a third or even a fourth child in this age group, in the 1980s typically only the second child would be born to mothers in their early thirties. From the beginning of the 1990s, however, the share of births to mothers between 30 and 34 years of age rose sharply, i.e. from 20 % in 1991 to 33 % in 2014. The share of births to over-35-year-old women evolved similarly – and also for similar reasons – from 10 % in 1961 to a minimum of 7 % in 1984 and then increased again to 21 % in 2014.
14 % of mothers at first birth over 35 years of age, only 5 % younger than 20 years old
The postponement of births to ever higher age groups becomes even more apparent when looking at the age distribution of mothers at first birth. Data is only available from 1984 onwards, thereby omitting the sinking median age at birth during the 1960s and 1970s. Nonetheless, the figures clearly show that motherhood has been shifted to ever later in life during the last 30 years.
While in 1984 almost 60 % of mothers had their first child before the age of 25, in 2014 it was only a quarter. In contrast, the share of women becoming a mother for the first time only after their 30th birthday rose from 10 % in 1984 to 42 % in 2014. While the share of first births in the age group 25 to 29 remained quite stable, the share of women having their first child at the age of 35 and more increased markedly from 2 % in 1984 to almost 14 % in 2014. At the same time the share of women becoming mothers at the age of less than 20 decreased significantly from 17 % in 1984 to 5 % in 2014. Equally, the share of women being between 20 and 24 when having their first child declined from 46 % in 1984 to 20 % in 2014.
Divorces
Number of divorces in Austria has doubled since 1961; trend reversal since 2007
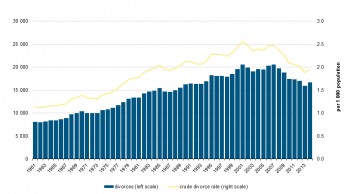
The number of divorces in Austria increased from about 8 000 a year at the beginning of the 1960s to about 16 000 on average during the 1980s and 1990s. So far, the highest absolute divorce number (20 582) was registered in 2001; the figures fell again slightly in the years thereafter. In 2014, the number of divorces amounted to 16 647. In relation to the population, divorce became equally more common, ranging from 1.1 cases per 1 000 population in 1961 to 2.6 in 2001 and declining thereafter to 1.9 in 2014. The reason behind this recent decline could lie in later and fewer marriages, but also the increasing share of migrant marriages that are less likely to be dissolved.
Decreasing divorce rates in Austria since 2007; divorce risk tripled since the 1960s
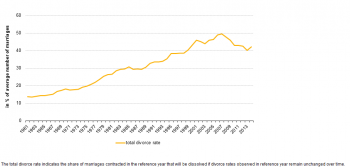
The total divorce rate indicates the share of marriages contracted in the reference year that will be dissolved, if divorce rates observed in the reference year would remain unchanged over time. It rose from 13.8 % in 1961 to a historic high of 49.5 % in 2007. At this time, almost half of new marriages were expected to end in divorce. In 2014, the total divorce rate stood at 42.1 %.
Marriages last longer than in the 1980s
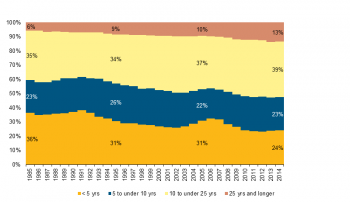
The average length of dissolved marriages has risen since 1981 from 7.7 to 10.7 years in 2014.
This increase is mainly due to a rise of divorces occurring after more than 25 years of marriage. While in 1985 only 6 % of divorces belonged to this group, in 2014 the share had more than doubled at 13 %. At the same time, the share of marriages dissolved after a length of less than five years has decreased from 36 % in 1985 to 24 % in 2014. The majority of divorces occur after a marriage length between five and 25 years. This has remained stable over time, increasing only from 59 % in 1985 to 63 % in 2014.
Consensual unions
Living together without marriage has become much more commonplace
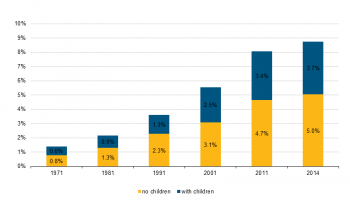
Since the beginning of the 1970s the share of the population living in consensual unions has constantly increased from 1.4 % in 1971 to 8.7 % in 2014. The increase was more marked for couples without children, whose share rose from 0.8 % in 1971 to 5.0 % in 2014. The relevance of cohabiting partners grew especially in the decade after 2001, increasing from 3.1 % to 4.7 % in 2011. Consensual unions including children grew a little less quickly over time, with their share increasing particularly during the 1990s from 1.3 % in 1991 to 2.5 % of the population in 2001.
20 % of all couples and 15 % of families have non-married partners
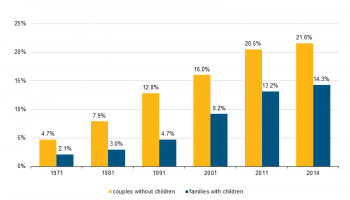
The share of non-married couples with and without children in the overall number of cohabiting couples offers insight into the changing social preferences of the population. While domestic partnerships formed 4.7 % of all couples without children in 1971, living together without marriage was chosen by 20.5 % of all couples without children in 2011. In 2014, the share had risen further to 21.6 %.
For families with children, the share of parents cohabiting without marriage was 2.1 % in 1971. Already rising slowly during the 1970s and 1980s to 4.7 % in 1991 and becoming even more common in the 1990s and the 2000s, their share out of all families increased to 9.2 % in 2001 and 13.2 % in 2011, respectively. In 14.3 % of all families with children, the partners were not married in 2014.
See also
External links


