Archive:Farm structure in France - 2007 results
- Data from December 2008. Most recent data: Further Eurostat information, Main tables and Database.
This article is part of a series of country-specific essays on the results of the European Union (EU) Farm structure survey (FSS) 2007. It provides a brief but nevertheless comprehensive insight into farm structure in France.
The 2007 FSS recorded 527 400 agricultural holdings in France, which represents a 7 % decrease since 2005.
Main statistical findings
8 % fewer holdings with vineyards in France in two years
In 2007, about 491 100 agricultural holdings in France had an economic size of at least one European size unit (ESU), compared to 527 600 in 2005 (a 7 % reduction).
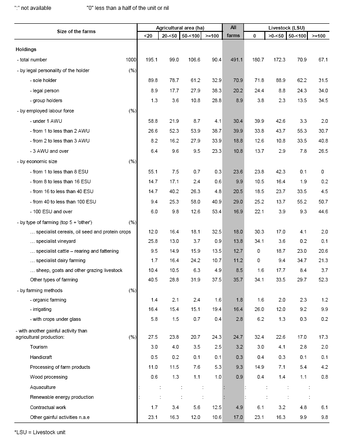
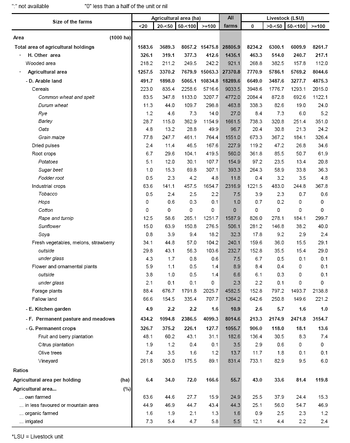
These farms made use of 27.4 million hectares (ha) of utilised agricultural area (UAA), this area represented 95 % of the UAA of French holdings and makes the average size of a holding in France 56 ha. See Figure 1 for the distribution of UAA in terms of farm size, while Table 2 describes the size distribution and other characteristics of the agricultural holdings.
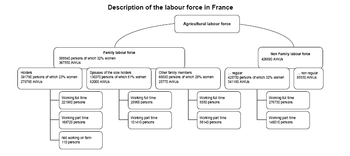
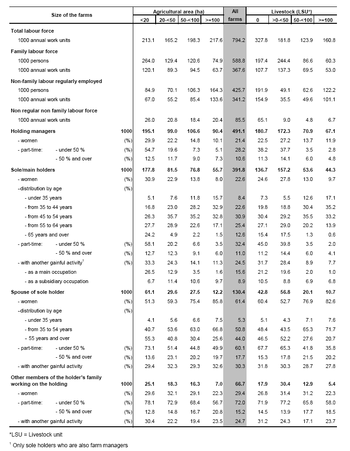
These holdings employed 794 000 annual work units (AWUs), the equivalent of 794 000 people working full time, a decrease of 6 % since 2005. The average area per AWU was 38.6. The organisation and distribution of the labour force in France is described in Figure 2 and Table 1.
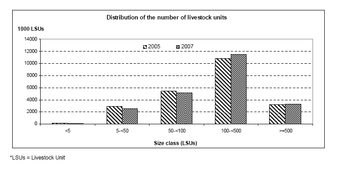
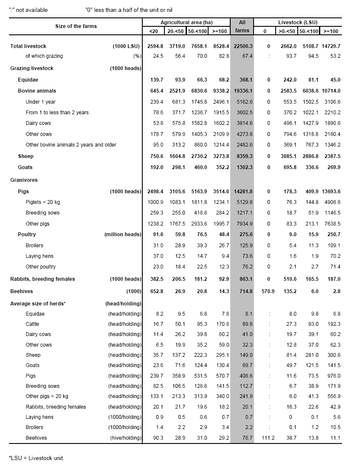
The farms contained 22.5 million livestock units (LSU) in 2007, 1 % less than in 2005. The distribution of livestock by farm size is shown in Table 4 and Figure 3.
Amongst the 491 100 agricultural holdings in 2007:
- 30 % made use of less than one AWU, while another 29.6 % made use of two or more AWUs;
- 10 % used less than 2 ha, while 41 % used 50 ha or more;
- 18 % of the holdings specialised in cereals, oil seed and protein crops;
- 13.8% of French farms specialised in vineyards,a 8 % decrease compared with 2005;
- 13 % were specialised in cattle – rearing and fattening;
- 11 % of the holdings were engaged in various dairy farming, and
- 9 % were specialised in sheep, goats and other grazing livestock;
Amongst the sole holders:
- 23 % were women in 2007;
- 38 % were aged 55 or more and 8 % were younger than 35 years; and
- 20 % had another gainful activity in 2007.
In France in 2007, 25 % of the agricultural area was farmed by its owners.
The family labour input has decreased by 11 % from 2005 to 2007 and represented 46 % of the regular labour input in France.
As in 2005 1.6 % of the UAA was used for organic production in 2007. Details of land use by size of farm are given in Table 3.
There was a noticeable decrease in the pulses area, as almost half (47 %) disappeared between 2005 and 2007. In the same time the area sown with rape and turnip rose by almost one third (32 %) to raise biofuels production.
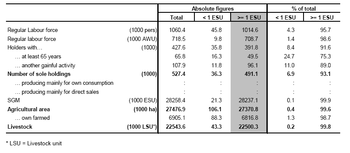
The situation for subsistence farming in France is outlined in Table 5.
Data sources and availability
Due to the different coverage of the FSS across Member States, the total number of farms is not comparable between countries. This is why the present analysis, including Tables 1-4 and the figures focus on holdings of at least one European size unit.
The "Service de la Statistique et de la Prospective" (SSP) is the central statistical department of the Ministry of agriculture (MAAP). In collaboration with its regional statistical services it implemented the survey on the structure of agricultural holdings in France. The previous full-scale agricultural census was conducted in 2000. Since 2003 the delivered results also include the overseas departments. The reference period of the survey was the crop year ending on 31 October 2007. However, in the case of the livestock, the reference date is the day of the interview.
The target population consisted of all the holdings producing agricultural goods, reaching a certain threshold (in terms of land area, number of livestock or volume of production) and independently managed. The sampling frame was the Agricultural Census in 2000. The permanent panel (used also in the 2003 and 2005 FSS) was drawn using random sampling with the Neyman-allocation method based on the type of farm and economic size. For each department (NUTS 3) an exhaustiveness threshold (generally 250 ESU) was defined to ensure all larger units were included; these holdings were inserted into a separate stratum. The sample size covered 13.3 % of the French farms, i.e. near 77 774 units (of which 3 554 were in the overseas departments).
The questionnaires were filled in during personal interviews carried out from October 2007 until February 2008.
Non-response rate in the 2007 FSS in France was quite low: (0.1 %). Data from the previous 2003 and 2005 census was, as well as administrative sources were used for imputation.
Between FSS 2005 and 2007 "maintaining land in good agricultural and environmental conditions" (GAEC) became an agricultural activity and the concerned land has been included in the agricultural area. In France it covers close to 90 000 ha, 97 % in holdings with at least 1 ESU.
For each activity (`enterprise`) on a farm (for instance wheat, dairy cow or vineyard), a standard gross margin (SGM) is estimated, based on the area (or the number of heads) and a regional coefficient. The sum of such margins in a farm is its economic size, expressed in European size units (ESU, 1 ESU is a 1200-euro SGM).
An annual work unit (AWU) is equivalent to a worker employed on a full time basis for one year. In France it is 1603 hours (229 working days of 7 working hours per day).
Context
European Commission Rural development policy aims to improve competitiveness in agriculture and forestry, improve the environment and countryside, improve the quality of life in rural areas and encourage the diversification of rural economies.
As agriculture has modernised and the importance of industry and services within the economy has increased, so agriculture has become much less important as a source of jobs. Consequently, increasing emphasis is placed on the role farmers can play in rural development, including forestry, biodiversity, the diversification of the rural economy to create alternative jobs and environmental protection in rural areas.
The FSS continues to adapt to provide timely and relevant data to help analyse and follow these developments.
See also
Further Eurostat information
Publications
- Farm Structure Survey in France - 2007 - Statistics in focus 84/2009
- National Methodological Report – FSS 2007 France (available on request)
Main tables
- Agriculture, see:
- Farm structure: historical data (1990-2007) (t_ef)
Database
- Agriculture, see:
- Farm structure (ef)
Dedicated section
- Ad-hoc tables: Farm Structure Survey
Methodology / Metadata
- Farm structure (ESMS metadata file — ef_esms)

