Archive:EU-Commonwealth of Independent States (CIS) - statistics on international trade by CIS country
This Statistics Explained article is outdated and has been archived - for recent articles on non-EU countries see here.
- Data extracted in May 2014. Most recent data: Further Eurostat information, Main tables and Database. No planned update.
Article drafted in cooperation with CIS-STAT, the Interstate Statistical Committee of the Commonwealth of Independent States.
This article is part of an online publication EU-Commonwealth of Independent States (CIS) - statistical overview (archived) and focuses on international trade between the European Union (EU) and the Commonwealth of Independent States (CIS) countries.
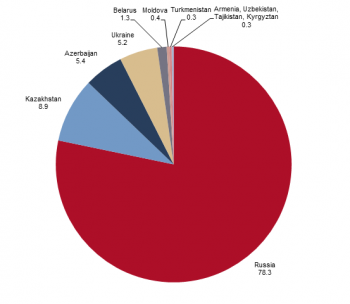
The Commonwealth of Independent States (CIS) has become a significant trading partner of the European Union (EU) in recent years, with imports and exports growing from EUR 129.9 billion in 2002 to EUR 433.5 billion in 2013 (+ 234 %). Russia’s weight among the eleven countries comprising the CIS is considerable, accounting for 78.3 % of EU-28 imports from the CIS and 70.6 % of EU-28 exports to the CIS.
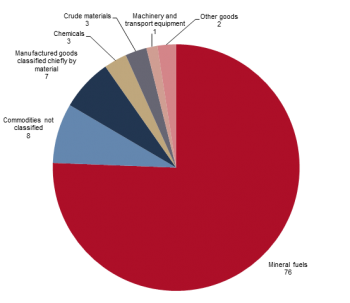
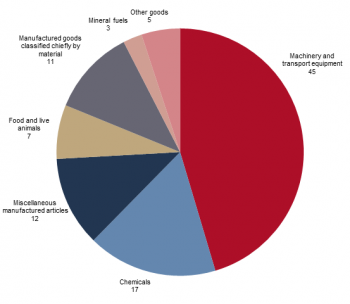
In 2013, 76 % of EU imports from the CIS consisted of ‘Mineral fuels’ (subject to considerable price fluctuations), while EU exports were more diversified, albeit with a significant share for ‘Machinery and transport equipment’ (45 %).
The more recent increase in EU-28 imports from countries such as Azerbaijan and Kazakhstan can essentially be attributed to energy products.
Main statistical findings
Highlights
Russia was the main trading partner, while oil accounted for more than 90 % of total EU-28 imports from Azerbaijan and Kazakhstan and more than 70 % from Turkmenistan in 2013.
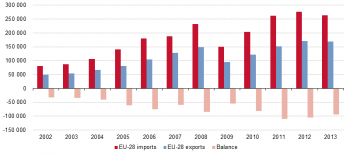
In 2013, the EU-28 imported close to EUR 264 billion in goods from the CIS, accounting for 15.8 % of total extra-EU-28 imports. In parallel, EU-28 exports to the CIS amounted to EUR 170 billion, representing 9.8 % of total extra-EU-28 goods exports.
The EU-28 trade deficit with the CIS amounted to EUR 94.2 billion in 2013, which is equivalent to 21.7 % of the total value of the EU-28’s goods trade with the group (Figure 1).
CIS members have followed different development paths since the early 1990s. Between 2002 and 2013, numerous trade partnerships have been agreed between CIS countries, the EU-28 and individual Member States.
The European Commission actively supports its partners in developing trade, for example through Partnership and Cooperation Agreements. In a further example, most Central Asian countries are beneficiaries of the EU’s Generalised System of Preferences.
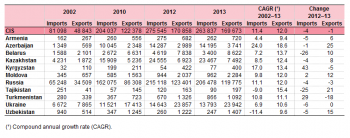
The value of the bilateral trade in goods between the 11 CIS countries and the EU-28 is detailed for the years 2002, 2010, 2012 and 2013 (Table 1).
From 2002 to 2008, EU-28 imports from the CIS grew at an average annual rate of 15.8 %, while exports rose by 19.3 % a year. Both trade flows were reduced by over one third in 2009. From 2010 to 2012, EU-28 imports from the CIS continued to grow at an average annual rate of 12.4 %, while exports also continued to rise by 17.5 % a year. A marginal decline for both flows took place in 2013.
Between 2002 and 2013, the value of EU-28 imports from the CIS more than tripled and grew by 11.3 % [1] a year, which can be explained to a large extent by the rise in imports from Russia (which has a considerable weight in the CIS total), and by higher imports from Kazakhstan, Azerbaijan and Ukraine. A large part of EU-28 imports from these countries is ‘Mineral fuels’, whose value is significantly affected by changes in price.
Over the same period (2002–13), EU-28 exports to CIS countries grew by 12 % a year on average, mainly as a result of exports to Russia, Ukraine, Belarus and Kazakhstan.
EU-28 imports
Ten-fold increase of EU-28 imports from Azerbaijan in 12 years
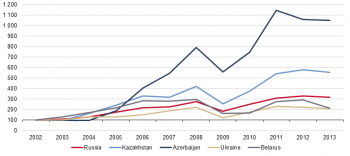
Figure 2 presents import indices for the five countries accounting for the greatest shares of EU-28 imports from the CIS countries in 2013.
Although EU-28 imports from the entire CIS grew by close to 225 % between 2002 and 2013, imports from Azerbaijan and Kazakhstan increased by 952 % and 455 % respectively over the same period.
Starting from a low level in absolute terms, the strong growth in those countries’ exports to the EU-28 can be mainly attributed to an increase in production and distribution capacity for ‘Mineral fuels'.
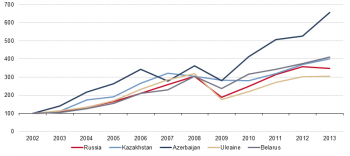
Figure 3 presents export indices for the five countries accounting for the greatest shares of EU-28 exports to the CIS countries in 2013.
EU-28 exports to the CIS grew by 247 % from 2002 to 2013. Exports to the five selected countries grew solidly, in particular to Azerbaijan (558 %). Given the small export volumes in 2002, close to half of EU exports to Azerbaijan can be explained by an increase in exports of ‘Machinery and transport equipment’.
EU-28 trade in goods by CIS country
Central Asian CIS countries with small shares
Between 2002 and 2013, trade in goods between the EU-28 and the CIS was characterised by growing demand for imports, new or stronger product marketing (in particular regarding certain CIS countries’ endowments in mineral fuels), the 2009 financial crisis and high volatility in raw-materials prices.
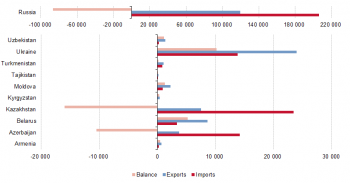
Figure 4 presents EU-28 trade in goods with the individual CIS countries in 2013. In terms of total trade value, four main partners stand out:
- Russia, the EU-28’s third main partner in goods trade worldwide, and its main source of imports and destination of exports in the CIS;
- Ukraine, the second main destination for EU-28 exports among the CIS and the fourth main source of imports;
- Kazakhstan, the EU-28’s second main source of imports among the CIS and its fourth main destination of exports;
- Azerbaijan, newly ranked fourth in terms of total trade among the CIS, with an average annual growth rate of 24 % over the twelve-year period.
Russia, Kazakhstan and Azerbaijan, from which the EU-28 imports most of its mineral fuels, contributed in a large part to the EU-28’s EUR 94.2 billion trade deficit with the CIS. Situated in the ‘Caspian belt’ and with high levels of foreign direct investments (FDI), Kazakhstan and Azerbaijan are finding new opportunities to market their oil and gas reserves internationally.
Figure 5 presents the distribution by country of the value of EU-28 imports from the CIS in 2013. The share of EU imports from Russia in total CIS imports fell by 2 percentage points (pp), from 80 % in 2002 to 78 % in 2013. Azerbaijan's share in EU-28 imports from the CIS rose by 3.7 pp, from 1.7 % to 5.4 %. Kazakhstan recorded a similar proportional increase, its share growing from 5.2 % to 8.9 %.
Figure 6 shows the distribution of the value of EU-28 exports to the CIS countries in 2013. Russia has kept its position as the main destination of EU-28 exports to the CIS, as the share of EU-28 exports to Russia has declined marginally from 70.7 % in 2002 to 70.6 % in 2013. Over the same period, the export market share of Ukraine decreased by 2 pp, while Azerbaijan and Belarus recorded increases (1 pp) in their share of EU-28 exports to the CIS.
The EU-28’s deficit in goods trade with Russia grew from EUR 30.7 billion in 2002 to EUR 86.7 billion in 2013. Deficits also increased with Kazakhstan and Azerbaijan, and amounted to EUR 16.0 billion and EUR 10.5 billion respectively in 2013. These trade deficits, which mainly arise from EU mineral fuels imports, were compensated to a certain extent by trade surpluses with the eight other CIS countries. Nevertheless, they explain the EU-28’s EUR 94.2 billion deficit with the CIS in large part.
Types of goods traded
Oil and gas from the CIS, machinery and transport equipment to the CIS
Looking in more detail at the types of goods traded between the EU-28 and the CIS, Figure 7 and Figure 8 respectively show the distributions of EU-28 imports from and exports to the CIS by Standard international trade classification (SITC) (1-digit) Section, in 2013. While EU-28 imports were mainly ‘Mineral fuels’ (76 %), exports to the CIS can be divided into three main categories: ‘Machinery and transport equipment’ (45 %), ‘Other manufactured goods’ (23 %) and ‘Chemicals’ (17 %).
From 2002 to 2013, the increase in the value of EU-28 imports from the CIS was almost entirely due to greater purchases of ‘Mineral fuels’. The increasing demand for products of that section was reflected by changes in the distribution by product of EU-28 imports from the CIS.
The share of ‘Mineral fuels’ in EU-28 imports from the CIS grew by 12 pp from 63.4 % in 2002 to 75.6 % in 2013. Import shares were especially reduced in all ‘Manufactured goods (SITC 5 to 8)’ (– 13 pp) and ‘Chemicals’ (– 5 pp).
Over the same period, nearly three quarters of the increase in value of EU-28 exports to the CIS can be explained by the increase in sales of ‘Machinery and transport equipment’, ‘Chemicals’, followed by ‘Manufactured goods’. The share of ‘Machinery and transport equipment’ in total EU-28 exports to the CIS increased (+ 2 pp) between 2002 and 2013, as did that of ‘Manufactured goods classified chiefly by material (SITC 6)’ (+ 6 pp), while the relative importance of ‘Chemicals’ (– 7 pp), ‘Miscellaneous manufactured articles’ (– 3 pp), and ‘Food and live animals’ (– 1 pp) was reduced.
A closer look at Eurostat Comext trade data, including some expressed in units of weight (kg) reveals that the increase in the value of EU-28 imports of ‘Mineral fuels’ from the CIS appears to have been largely driven by price increases.
This appears to be the case, for example, with SITC product Group (3-digit) ‘Petroleum oils and oils obtained from bituminous minerals, crude’, which accounted, in value, for half of all imports from the CIS in 2013 (50.9 %).
Reflecting stronger demand, met thanks to higher production and transport capacity, the weight in kg of annual EU-28 imports of crude oil from the CIS increased by 38.8 % from 2002 to 2013.
The value of EU-28 imports of crude oil from the CIS increased significantly over the period (+ 356 %). In particular, the difference can be attributed to strong rises in crude oil prices on international markets between 2003 and mid-2008.
One may note that, over the period under analysis, the euro appreciated by 67 % with respect to the Russian rouble, and by 51 % with respect to the US dollar (Source: European Central Bank (ECB)).
Product range
EU-28 exports far more diverse than imports
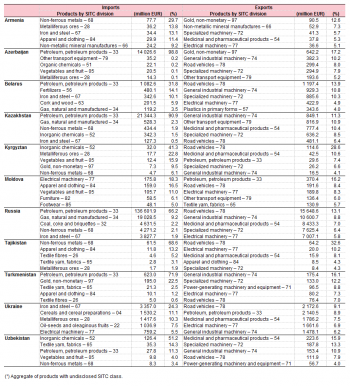
Table 2 presents the five top products at SITC 2-digit (Division) level imported from and exported to the individual CIS countries by the EU-28 in 2013.
The percentage of the top 5 products imported by the EU-28 from the CIS countries is generally much greater than that of the top 5 products exported by the EU-28 to the CIS countries. For six CIS countries, a single product Division accounted for over half of the EU-28’s imports from that country.
In those cases, the product imported was also always ‘Petroleum, petroleum products and related materials’ (SITC 33), except in the case of EU-28 imports from Tajikistan (69 %: ‘Non-ferrous metals’) and from Uzbekistan (51 %: ‘Inorganic chemicals’). In contrast, EU-28 imports from Ukraine, Armenia, Belarus and Moldova were more diversified.
EU-28 exports to the CIS countries also displayed more diversity in 2013, as the share of the top product Division exported by the EU-28 to the CIS did not exceed 17 %, except in the case of EU-28 exports to Tajikistan (33 %: ‘Road vehicles’) and to Kyrgyzstan (29 %: ‘Road vehicles’).
Data sources and availability
All data presented in this publication stem from Comext, Eurostat’s database containing statistics on trade in goods. These data may differ from those produced by the national statistical services of the countries of the Commonwealth of Independent States (CIS).
Methodology for external trade statistics
In the methodology applied for statistics on the trading of goods, extra-EU trade (trade between Member States and non-member countries) statistics do not record exchanges involving goods in transit, placed in a customs warehouse or given temporary admission (for trade fairs, temporary exhibitions, tests, etc.). This is known as ‘special trade’. So the partner will be the country of final destination of the goods.
Information on commodities exported and imported are presented according to the Standard international trade classification (SITC) at a more general level (1-digit — Figures 7 and 8) and a more detailed level (2-digit — Table 2).
In this statistical article: 1 billion = 1 000 000 000.
For further reading, Metadata are available in ESMS form (International trade data (ext)).
Context
Article drafted in cooperation with CIS-STAT, the Interstate Statistical Committee of the Commonwealth of Independent States within the framework of the Memorandum of Understanding signed by both institutions in 2010.
See also
Further Eurostat information
Publications
Main tables
- International trade, see:
- International trade data (t_ext)
- International trade long-term indicators (t_ext_lti)
- International trade short-term indicators (t_ext_sti)
Database
- International trade, see:
- International trade data (ext)
- International trade long-term indicators (ext_lti)
- International trade short-term indicators (ext_sti)
Traditional international trade database access (ComExt) (comext)
Dedicated section
- International trade detailed data (detail)
- EU trade since 1988 by SITC (DS-018995)
