Archive:Canada-EU - statistical indicators and trade figures
This Statistics Explained article is outdated and has been archived - for recent articles on non-EU countries see here.
This article compares selected statistical indicators for Canada and the European Union (EU). Canada, the second largest country in the world in terms of area, is a major trade partner of the EU-27. For the extra-EU-27 trade in goods in 2010, Canada is the 11th most important partner worldwide.
Source: Eurostat (bop_its_det)
Source: Eurostat (bop_its_det)
Source: Eurostat (bop_its_det)
Source: Eurostat (bop_fdi_main)
Source: Eurostat (bop_fdi_main)
Main statistical findings
EU-27 and Canada: Selected statistical indicators, trade and investment figures 2000-2010 - Trade in services less affected by crisis than trade in goods
After a considerable drop in 2009, the bilateral trade volume (imports and exports) increased again in 2010 to reach a total value of EUR 46.8 billion (+24 % compared to 2009). Bilateral trade is dominated by products with a high value-added. The volume of trade in services (valued at EUR 22.6 billion in 2010) was less affected by the crisis. For both goods and services, the EU-27 registered a trade surplus with Canada.
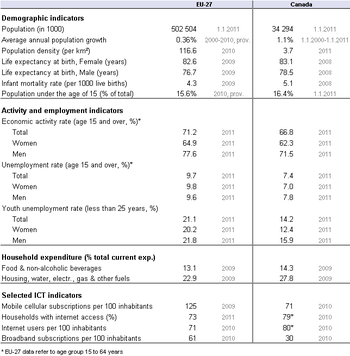
The Canadian territory exceeds that of the EU-27 by a factor of 2.3 but at the same time features a population that is less than 7 % of that of the EU-27. Both have ageing populations with a high life expectancy, as in many highly developed countries.
There is a higher labour market activity rate in the EU-27 than in Canada, especially among men. However, the EU-27 unemployment rates are also higher, particularly among the young.
The proportion of household expenditure for the two broad consumption items related to food and housing, were broadly similar.
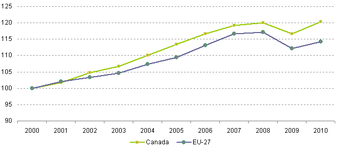
Figure 1 shows that Canada’s gross domestic product has been increasing faster than that of the EU and was somewhat less affected by the recent financial and economic crisis.
Goods trade: trade volume back to pre-crisis level in 2010
In 2010, the EU-27’s trade volume with Canada (EU-27 imports and exports combined) had a total value of EUR 46.8 billion, a 24 % increase compared to the 2009, the year particularly affected by the worldwide financial and economic crisis. In 2010, the level of goods trade between the EU and Canada was very close to that of 2006.
With a share of 1.6 % in total extra-EU-27 trade in 2010, Canada held the 11th position in the ranking of the EU’s most important trade partners. For Canada, the EU-27 is the second most important trade partner (share of 10.4 %), but still well behind Canada’s main trade partner, the United States (share of 62.4 % - data not shown).
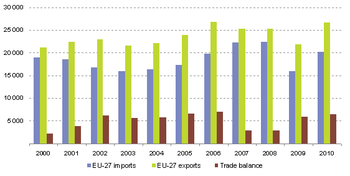
Throughout the period shown here (Figure 2), the value of EU-27 exports to Canada has exceeded that of EU- 27 imports from Canada.
The EU-27’s trade surplus with Canada amounted to EUR 6.4 billion in 2010. In 2007 and 2008, this surplus was comparatively low, at around EUR 2.9 billion.
Canada –EU bilateral trade in goods is dominated by high value-added products such as machinery, transport equipment, chemicals and other manufactured goods.
Imports
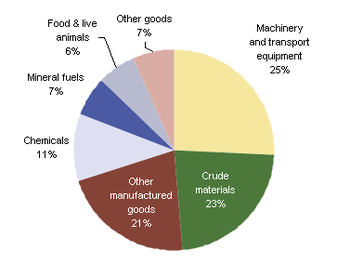
Indeed, 26 % of the total value of goods imported from Canada in 2010 consisted of ‘Machinery and transport equipment’ (see Figure 3). ‘Other manufactured goods’ and ‘Chemicals’ had shares of 21 % and 11 % respectively.
These three goods categories together represented about 60 % of total EU-27 imports from Canada. Figure 3 shows that ‘Crude materials’ had an important share, too (23 %), the largest part consisting of metalliferous ores.
It does not come as a surprise that the EU imports energy products from Canada, given that country’s large energy resource base. However, ‘Mineral fuels’ only represent 7 % of the total value of EU-imports (corresponding to EUR 1 315 million), only slightly above the value of ‘Food and live animals’ (EUR 1 258 million).
Exports
Turning to EU-27 exports to Canada (Figure 4), ‘Mineral fuels’ also show up, albeit with a share of only 7 % (corresponding value: EUR 1 986 million).
Far more important are ‘Machinery and transport equipment’ (37 %), ‘Other manufactured goods’ (21 %) and ‘Chemicals’ (20 %), which together made up 78 % of all EU-27 exports to Canada.
Additional commodity details
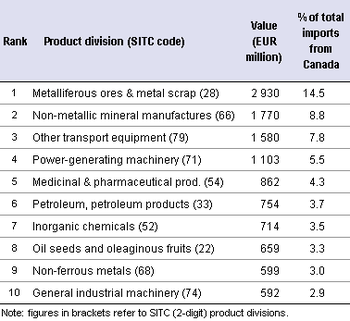
In further detailing the goods traded with Canada Standard International Trade Classification (SITC), 2-digits level: see Data sources and availability, ‘Metalliferous ores and metal scrap’ is the most important product division for imports, being responsible for 14.5 % of the total (corresponding value: EUR 2 930 million - see Table 2). ‘Non-metallic mineral manufactures’ and ‘Other transport equipment’ (i.e. transport equipment other than road vehicles, such as aircraft, ships and boats) follows with a share of 8.8 % and 7.8 %, respectively.
Detailing the ‘Other transport equipment’ at the level of product groups (SITC 3-digit level - data not shown), it appears that the large majority (79 %) within this product division consists of ‘Aircraft and associated equipment’.
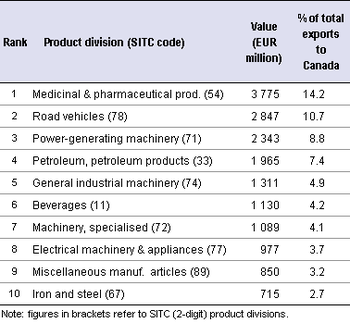
Looking at the EU-27 exports to Canada, ‘Medicinal and pharmaceutical products’ come first, with a share of 14.2 % in the total value. Indeed, the EU is a major world trader in these products and its exports to Canada increased from a value of EUR 1.1 billion in 2000 to EUR 3.8 billion in 2010. In parallel, the share of ‘Medicinal and pharmaceutical products’ in the broader ‘Chemicals’ section has gradually increased from 42 % in 2000 to 70 % in 2010. ‘Road vehicles’ follow with a share of 10.7 %; within this category, 86 % concern passenger cars.
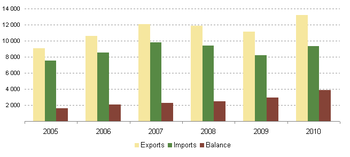
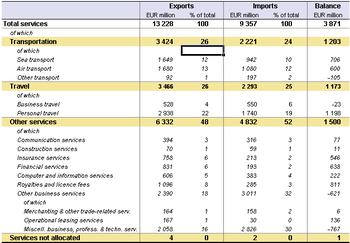
As well as Canada’s important position for the EU’s trade in goods, trade in services is also sizeable. In 2010, the EU-27 exported services worth EUR 13.2 billion to Canada (corresponding to 2.4 % of the total extra-EU-27 services exported), whereas services worth EUR 9.4 billion were imported from Canada (2.1 % of the total extra-EU-27 services imported).
Hence the EU-27 registered a surplus of EUR 3.9 billion in the trade of services with Canada (see Figure 5). The general upward tendency in the bilateral trade in services experienced a slowdown during the years 2008 and 2009.
The 2010 figures show a recovery, as services exported to Canada increased by 19 % and services imported by 14 % compared to the previous year. Nevertheless, EU-27 imports of Canadian services in 2010 have not yet reached the level of 2007 (when these amounted to a total value of EUR 9.8 billion).
Imports
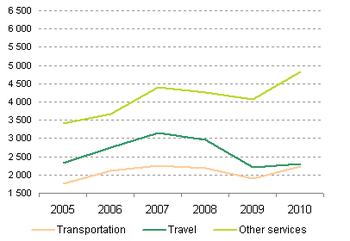
The picture is somewhat different when observing Canadian services supplied to the EU-27 (Figure 7). Whereas transportation services, fairly equally spread between sea and air transport, remained fairly stable throughout the period observed, with however a temporary slowdown during 2008 and especially 2009, considerably less services related to travel have been supplied in recent years.
The decrease is particularly visible between 2008 and 2009 (-25 %) and was not followed by a subsequent recovery. Between 2009 and 2010 the value of travel-related services supplied to the EU-27 increased by only 4 %.
As for EU-27 services supplied by Canada, the Canadian ‘Other services’ supplied to the EU are far more important and reached a total value of EUR 4.8 billion in 2010, a 42 % increase compared to 2005.
Exports
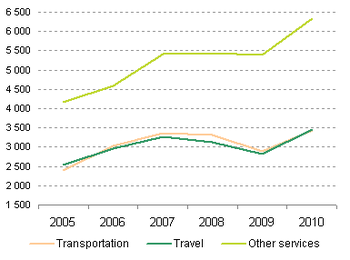
Looking at the three large categories of services in Figure 6 -‘Transportation’, ‘Travel’ and ‘Other services’ - it appears that the former two roughly display the same value and growth since 2005.
The value of both ‘Transportation’ services (incorporating freight and passengers) and ‘Travel’ services (business and private) exported have gradually increased overall but decreased during the crisis years 2008 and 2009. In 2010 however, both categories displayed a sharp upward trend again. In that year, the transportation services supplied to Canada by the EU-27 amounted to a total value of EUR 3.4 billion (+ 43 % compared to 2005), services linked to travel were worth EUR 3.5 billion (+37 % compared to 2005).
The broad category ‘Other services’ was far more important in absolute terms: in 2010, these services were worth EUR 6.3 billion, a 52 % increase compared to 2005. The supply of ‘Other services’ has obviously been less affected by the financial and economic crisis as their value has remained fairly stable during 2008 and 2009. More information on this category is given in Table 4.
Additional commodity details
Table 4 focuses on the reference year 2010 and is particularly interesting as it details the three large categories further, especially the ‘Other services’, which is responsible for roughly half of all services traded, both for imports and exports. Within the large category ‘Other services’, most sub categories show fairly small shares. Noticeable is the EUR 1.1 billion that Canada paid for ‘Royalties and licence fees’(share of 8 % in the total). The other larger sub category is ‘Other business services’, where the EU-27 displayed a deficit, as services worth EUR 2.4 billion were supplied by the EU to Canada and services valued EUR 3.0 billion were received from Canada. Looking more closely, these services were nearly entirely allocated to ‘Miscellaneous business, professional and technical services’. The latter consisted mainly of ‘Legal, accounting, management and public relations services’ and ‘Services between affiliated enterprises’ for EU-27 services supplied to Canada, and ‘Research and development services’ and also ‘Services between affiliated enterprises’ for Canadian services supplied to the EU (data not shown).
Foreign direct investment (FDI): inflows from Canada double between 2009 and 2010
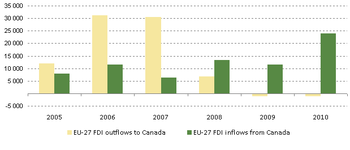
Whereas in 2006 and 2007, the EU-27 still invested considerably in the Canadian economy (EUR 31.2 billion and 30.1 billion respectively), the amount invested in 2008 and 2009 was considerably reduced (EUR 6.4 billion and EUR 3.7 billion respectively). The year 2010 saw a disinvestment and the EU-27 has been pulling out capital from the Canadian economy (see Figure 8).
In contrast, Canada has continued to build up assets in the EU-27. In 2008, unlike the previous years, it exceeded the EU-27 investments in Canada. In 2009, Canada invested EUR 12.9 billion in the EU economy; in 2010, this amount increased by 85 % to reach EUR 23.9 billion.
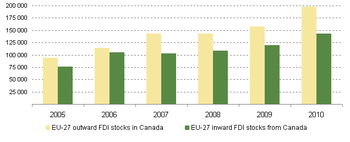
Through its foreign direct investment (FDI) flows to Canada, the EU-27 builds up assets in the Canadian economy (the FDI stocks). The value of these stocks has been constantly increasing and amounted to EUR 197.4 billion in 2010, 23 % higher than in 2009.
Canadian assets in the EU-27 economy have also increased in value. In 2006, the total value of Canadian assets was close to those of the EU-27 in the Canadian economy (EUR 105 billion and EUR 114 billion respectively). In 2010, FDI stocks held by Canada amounted to EUR 143 billion.
Unlike the FDI flows, the value of outward FDI stocks can be materially affected by the revaluation on foreign currency denominated assets (see Data sources and availability).
Data sources and availability
Data sources:
The contents of this article are based on data available at Eurostat and at Statistics Canada/Statistique Canada .
Table 1: Selected indicators : data for EU-27 come from Eurostat’s reference database. The following online data codes apply:
Population density (demo_r_d3dens)
Life expectancy (demo_mlexpec)
Infant mortality (demo_minfind)
Statistics Canada: CANSIM database:
Canadian Internet Use Survey: the target population of the Canadian Internet Use Survey is individuals aged 16 years or older, excluding: Residents of the Yukon, Northwest Territories and Nunavut, inmates of institutions, persons living on Indian reserves, and full time members of the Canadian forces.
Data on the trade of goods are available in Eurostat’s Comext database. In the methodology applied for the statistics on the trading of goods, extra-EU trade (trade between Member States and non-member countries) statistics do not record exchanges involving goods in transit, placed in a customs warehouse or given temporary admission (for trade fairs, temporary exhibitions, tests, etc.). This is known as "special trade". For EU exports, the partner is the country of final destination of the goods, for EU imports, it is normally the country of origin (with some exceptions).
Data on the trade of services are based on balance of payments statistics. The balance of payments records all economic transactions between a country (i.e. its residents) and foreign countries or international organisations (i.e. the non-residents of that country) during a given period. As part of the balance of payments, the current account records real resources and is subdivided into four basic components: goods, services, income and current transfers. The methodological framework used is that of the fifth edition of the International Monetary Fund Balance of Payments Manual (BPM5). The EU balance of payments is compiled by Eurostat in accordance with a methodology agreed with the European Central Bank (ECB).
Data of Foreign Direct Investment (FDI) is based on the methodological framework of the OECD: Benchmark Definition of Foreign Direct Investment Third Edition, a detailed operational definition fully consistent with the IMF Balance of Payments Manual, Fifth Edition, BPM5. Foreign Direct Investment (FDI) is the category of international investment made by an entity resident in one economy (direct investor) to acquire a lasting interest in an enterprise operating in another economy (direct investment enterprise). The lasting interest is deemed to exist if the direct investor acquires at least 10 % of the voting power of the direct investment enterprise. Through outward FDI flows, an investor country builds up FDI assets abroad (outward FDI stocks). Correspondingly, inward FDI flows cumulate into liabilities towards foreign investors (inward FDI stocks). However changes in FDI stocks differ from FDI flows because of the impact of revaluation (changes in prices and, for outward stocks, exchange rates) and other adjustments such as catastrophic losses, cancellation of loans, reclassification of existing assets or liabilities. FDI flows are components of the financial account of the Balance of Payments, while FDI assets and liabilities are components of the International Investment Position.
SITC classification (Figures 3 and 4 and Tables 2 and 3). Information on commodities exported and imported are presented according to the SITC classification (Standard International Trade Classification, Revision 4) at a more general level (1-digit - Figures 3 and 4) and a more detailed level (2-digits - Table 2 and 3). A full description is available through Eurostat’s classification server RAMON.
In this article: 1 billion = 1000 million
Context
Canada is one of the European Union’s oldest and closest partners. What started out in the 1950s as a purely economic relationship has evolved over the years to become a close strategic partnership. European and Canadian representatives meet regularly to exchange views, from bilateral summits of leaders to meetings between officials on specific issues. The EU-Canada Partnership Agenda adopted at the Ottawa Summit on 18 March 2004, identifies ways of working together to move forward, especially where joint action can achieve more than acting alone.
Eurostat and Statistics Canada/Statistique Canada signed a Memorandum of Understanding in October 2009. We thank Statistics Canada for their input into this article.
See also
- Africa-EU - key statistical indicators
- Latin America-EU - economic indicators, trade and investment
- Mexico-EU - basic statistical indicators
Further Eurostat information
Publications
Main tables
- International trade data (t_ext)
