Air passenger transport - data by month
Data extracted on 28 March 2024.
Planned article update: 16 July 2024.
Highlights
The biggest recovery in the number of commercial air flights in the EU occurred in the second and third quarter of 2023.
In the first nine months of 2023, there were 749 million air passengers carried in the EU, a 21 % increase compared to the same period in 2022.
In the first nine months of 2023, air passenger transport increased in all EU Member States compared to the same period in 2022.
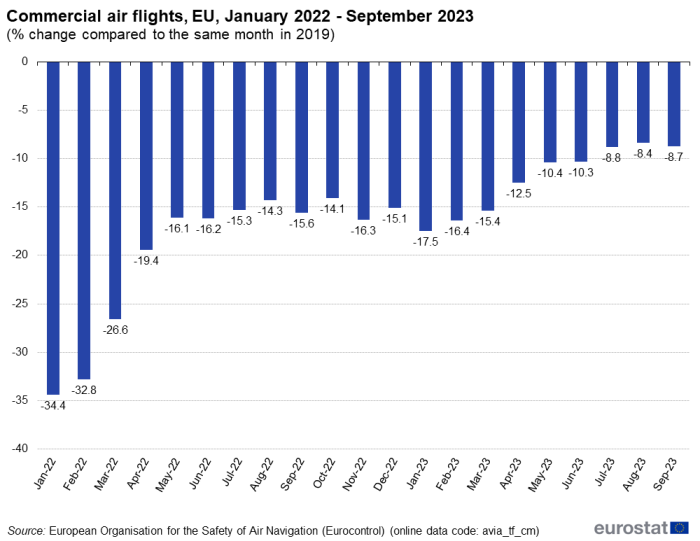
(% change compared with the same month in 2019)
Source: European Organisation for the Safety of Air Navigation (Eurocontrol) (avia_tf_cm)
This article describes the recent monthly development of commercial air flights and passenger transport by air in the European Union (EU), as well as in the EFTA countries Iceland, Norway, Switzerland and in the Candidate countries Bosnia and Herzegovina, Montenegro, North Macedonia, Serbia and Türkiye. A distinction is made between national (domestic), intra and extra-EU transport, while looking at the evolution of airport traffic.
Full article
Recovery in the number of commercial flights continues in the first nine months of 2023
Since the beginning of 2020, in order to prevent the spread of the COVID-19 pandemic, countries around the world took a variety of restrictive travel measures that severely hit the air travel industry. Starting from the second half of 2021, restrictive measures were gradually removed, encouraging people to travel by air again, thus impacting commercial air traffic.
In 2022, there were visible signs of recovery, repeated in each month of 2022, where small decreases were registered in the total number of commercial flights (passengers, freight and mail) in the EU compared with the same month in 2019 (Figure 1). The largest decreases compared with the same months of 2019 were recorded in January (-34.3 %), February (-32.8 %), March (-26.6 %) and April (-19.4 %). Starting from May 2022, the number of flights decreased by less than 17 % compared with the same months of 2019. The smallest decreases are from 14.1 % in October 2022, to 14.3 % in August 2022.
In the first six months of 2023, the recovery continued with smaller decreases compared with the same month in 2019: from 17.5 % in January 2023 to 10.3 % in June 2023. Starting from July 2023, decrease below 10 % were registered for all months. The decrease in terms of commercial flights reached the bottom in August 2023 with a decrease of only 8.4 % compared with the same month in 2019.

(% change compared with the same month in 2019)
Source: European Organisation for the Safety of Air Navigation (Eurocontrol) (avia_tf_cm)
In the first nine months of 2023 749 million air passengers carried at EU level, a 21 % increase compared with the same period in 2022
Starting from January 2022 which carried 31.5 million passengers, the number of passengers has been increasing subsequently every month (Figure 2). The highest growths were observed between February and March (+36.0 %) and from March to April (+34.5 %). Between April and July, stable increases around 12 % were registered each month. Passenger traffic reached its peak in August 2022 with almost 96 million passengers carried, before three consecutive decreases between August and September (-9.1 %), September and October (-6.7 %) and October and November (-27.2 %). In the first quarter of 2023, the biggest increase registered in 2023 was observed between February and March 2023 (+19.7 %), following two consecutive decreases in January and February.
During the first nine months of 2023, 749 million passengers were carried at EU level, a 21 % growth compared with the same period of 2022. International extra-EU transport represented 48.5 % of all passengers carried at EU level in the first nine months of 2023, while international intra-EU and national transport shares were 36.2 % and 15.3 % respectively. Compared with the respective months of the first quarter of 2022, significant increases were observed for extra-EU transport, with 26.6 %, followed by intra-EU transport (+18.0 %) and national transport (+12.0 %).
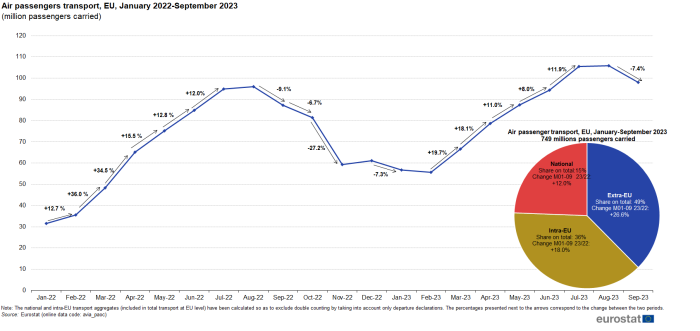
(million passengers carried)
Source: Eurostat (avia_paoc)
Figure 3 shows that an increase in passenger transport was registered for every month of 2022 and 2023 compared with the same month of the previous year. February, March and April 2022 registered again large increases compared with the same month of 2021. The growth continued in the first nine months of 2023, with the largest increase in January (+79.8 %). Since June 2023, the increase has remained stable, around 10.0 % for each month.
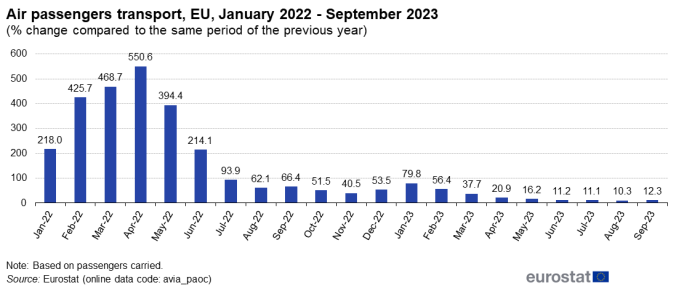
(% change compared to the same period of the previous year)
Source: Eurostat (avia_paoc)
All EU Member States continue to register increasing numbers of air passenger transport in the first nine months of 2023 compared with the same period of 2022
The number of passengers carried by air increased in all EU Member States in the first nine months of 2023 compared with the same period of 2022. The only exception is Greece that registered a 6.5 % decrease, but figures were only estimated from March to September 2023. The largest increase was recorded for Cyprus (38.4 %), ahead of Malta (35.5 %). Four Member States recorded an increase between 29 % and 30 %: Poland, Slovenia, Austria and Czechia. Thirteen further Member States recorded an increase of more than 20 %: Latvia, Italy, Slovakia, Finland, Ireland, Bulgaria, Sweden, Denmark, Germany, Hungary, Luxembourg, France and Portugal. The smallest increase was recorded for Estonia (+9.0 %), followed by Lithuania (+13.5 %) and Croatia (+16.3 %). All of this confirms that air passenger transport is on a good recovery path from the COVID-19 pandemic.
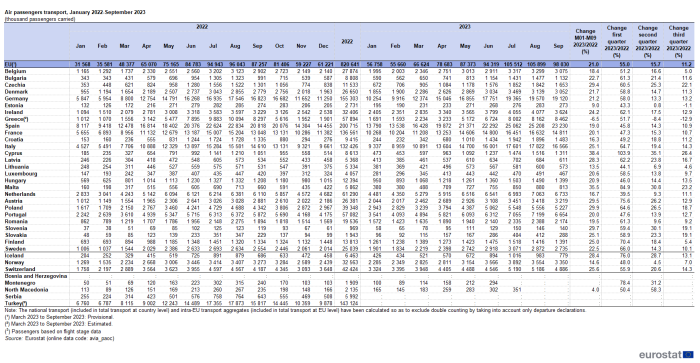
(thousand passengers carried)
Source: Eurostat (avia_paoc)
All top 30 EU airports showed signs of recovery in the first nine months of 2023
Table 2 presents the evolution of air passenger transport in the top 30 EU airports. The ranking of the airports was established based on the total annual passengers carried in 2022. Paris Charles de Gaulle airport, maintained first position in the ranking for the entire period from January 2022 to September 2023.
All the airports in the top 30 registered an increase in the first nine months of 2023 compared with the same period of 2022. The largest increase was recorded for Roma/Fiumicino (+41.2 %), followed by Athinai/ Eleftherios Venizelos (+36.4 % - Estimated), Warszawa/Chopina (+31.8 %), Wien-Schwechat (+29.0 %), and Bergamo (+24.9 %). Sixteen additional airports recorded an increase of more than 20 %. The lowest increases were for Palma de Mallorca (+8.8 %), Paris-Orly (+14.5 %) and Gran Canaria (+14.9 %).
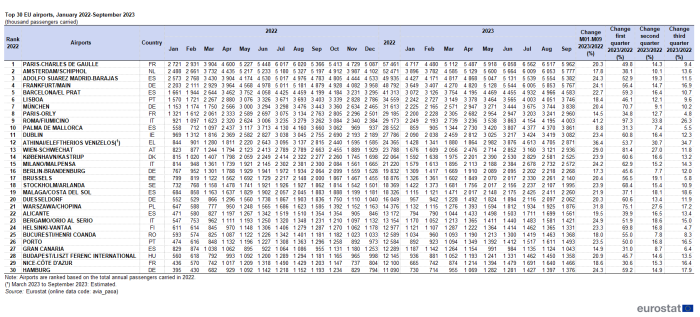
(thousand passengers carried)
Source: Eurostat (avia_paoa)
Source data for tables and graphs
Data sources
Definition of 'passengers carried'
All passengers on a particular flight are counted once only and not repeatedly on each individual stage of that flight. This excludes direct transit passengers.
Exclusion of double counting
The national transport (included in total transport at country level) and intra-EU transport aggregates (included in total transport at EU level) were calculated by taking into account only departure declarations so as to exclude double counting.
Notes on some reporting countries
- Türkiye: provides only flight stage data (Dataset A1 of the Regulation with passenger on-board information).
Context
The content of this statistical article is based on data collected within the framework of the air transport statistics Regulation (EC) No 437/2003 on statistical returns in respect of the carriage of passengers, freight and mail by air.
Direct access to
- Air transport statistics
- Transport statistics at regional level (see air transport)
- Transport, see:
- Air transport (t_avia)
- Air transport of passengers (ttr00012)
- Air transport of goods (ttr00011)
- Transport, see:
- Air transport (avia)
- Air transport measurement - passengers (avia_pa)
- Air transport measurement - freight and mail (avia_go)
- Passenger and freight transport by air/Traffic data/Air transport at regional level (ESMS metadata file — avia_pa_esms)
- Reference Manual on Air Transport Statistics - Version 14 (Methodological manual)
- Glossary for transport statistics - 5th edition - 2019
The basic legal act was amended by: