Agricultural production - crops
Data extracted on 17 October 2023.
Planned article update: November 2024.
Highlights
Production of main cereals, EU, 2012-2022
Editorial note: Throughout this article, which deals with time periods when the United Kingdom was a Member State of the European Union, the acronym EU, however, refers to EU-27, the post-Brexit composition of the European Union as of 1 February 2020.
Crops can be broadly categorised into two groups: annual and perennial. Annual crops are those that do not last more than two growing seasons and typically only one. Perennial crops (e.g. fruit trees and vines) last for more than two growing seasons, either dying back after each season or growing continuously; these are also termed permanent crops. Annual crops can be subdivided in winter crops and spring and summer crops. Winter crops are sown in autumn and harvested in the summer of the following year. Spring and summer crops are sown and harvested in the same year. In the EU, wheat, rapeseed, rye and triticale are typically winter crops, whereas maize, sunflowers, rice, soybeans, potatoes, and sugar beet are summer crops. Barley is common in both its winter and spring varieties.
When making decisions on which annual crops to sow, farmers consider agronomic factors (for example, crop rotations and soil conditions), the availability of labour and machinery, input costs (for example, of seeds and fertilisers), anticipated returns, and policy incentives or restrictions. These decisions have an impact on the production of specific crops from one year to the next.
Plants need sunlight, water, healthy soils, air and heat to grow; and farmers need suitable weather and soil moisture conditions to conduct the necessary field operations on time. Crop production is sensitive to weather conditions throughout the growing season and at harvest. For example, heavy spring frosts can damage the leaves of cereals and destroy fruit blossoms. Likewise, summer drought and heatwaves can reduce yield formation, while strong winds and heavy rainfall can incur harvest losses and compromise yield quality.
The important role of weather conditions on the quantity and quality of harvests has a knock-on effect on prices, as the mechanism between supply and demand. It is for this reason that production levels and prices are brought together in this article. As the EU covers a large area with a wide range of climates, the impact of adverse weather conditions on production levels in one region may be offset by better conditions in another. However, where the production of certain crops is concentrated in a few regions, EU production levels will be particularly susceptible to adverse weather conditions as well as to pest attacks.
The statistics on crop production in this article are shown at an aggregated level and have been selected from over 100 different crop products for which official statistics are collected.
Full article
Agrometeorological review
Among meteorological factors, temperature and precipitation are of particular significance for yields and production levels. The 2022 crop year in the EU experienced extreme weather events in terms of both temperatures and rainfall[1].
Autumn 2021
The rainy conditions of August in most northern and central European countries caused some delay to the start of rapeseed sowing. Nevertheless, overall, weather conditions allowed for rapeseed sowing to be concluded within a suitable time window in most parts of Europe. Adequate temperatures and soil moisture sustained the emergence and early development of rapeseed seedlings, allowing plants to enter the winter period in good condition. However, very dry conditions in September in parts of central, eastern, and southern Europe, particularly in Romania, impaired sowing and germination. Although precipitation in October improved soil moisture conditions (especially in southern Romania), plants continued to be behind in their development before winter.
The beginning of the sowing campaign for winter cereals was slightly delayed in northern countries due to the difficult harvest of the preceding crops and/or excess rainfall, but sowings progressed thereafter. Mild temperatures and adequate soil moisture conditions favoured rapid emergence and good stand formation in most regions. However, in western Europe, particularly in France, the prevalence of below-average temperatures from early October hampered the early development of winter wheat and only a few fields entered the tillering stage before December. In Bulgaria and Romania, sowing was initially delayed due to dry conditions but progressed well after substantial rainfall in October and November, which, combined with favourable temperatures created adequate conditions for germination and emergence.
Winter 2021-2022
The 2021/2022 winter season was warmer than usual in almost all parts of Europe; it was particularly noticeable in northern Germany, Poland, the Baltic Sea countries, and Scandinavia, where average temperatures exceeded the long-term average (LTA) by up to 2°C. These conditions allowed even the late-sown winter crops to establish well and to enter spring in fair-to-good condition in most of Europe.
The most significant cold weather event during winter was a sharp decrease in temperatures in most of the Balkan Peninsula and eastern Europe during the last days of January, when daily minimum temperatures plunged to as low as -24°C (in Romania). This only lasted a few days, with negligible damage to crops.
An increasing concern was the progression of a severe drought in most of the Iberian Peninsula, southernmost France, and north-western Italy. At least during winter, the direct impact on crops remained relatively limited. However, historically low levels of water reservoirs (i.e. snow packs in the Alps, and inland water bodies) raised serious concerns about water availability for irrigation in late spring and summer.
Spring 2022
Spring 2022 was marked by drier than usual conditions in most parts of Europe.
April was typically colder than usual in most regions. A distinct cold spell in the first half of April extended from central Spain to the Baltic Sea region. The impact on annual crops was limited. However, there was severe and irreversible damage to blooming fruit crops, particularly in Spain.
The cold April conditions resulted in some delays to the sowing of summer crops. Furthermore, low soil water content raised concerns for the early development of maize and sunflowers in France, eastern Germany, Hungary, and Romania.
Drought conditions persisted and expanded in southern France and northern Italy, resulting in a worsening of prospects for summer crops and of yield expectations for winter crops and spring cereals. In Spain and Portugal, spring started with favourable rains, but soil moisture content remained low due to the preceding drought; and exceptionally hot and dry conditions in May seriously reduced the yield potential in the main production regions.
In Romania and Hungary, cold and dry conditions in March and April negatively affected winter crops; whereas a persistent rain deficit combined with warm temperatures in the following months further diminished their yield potential.
Summer 2022
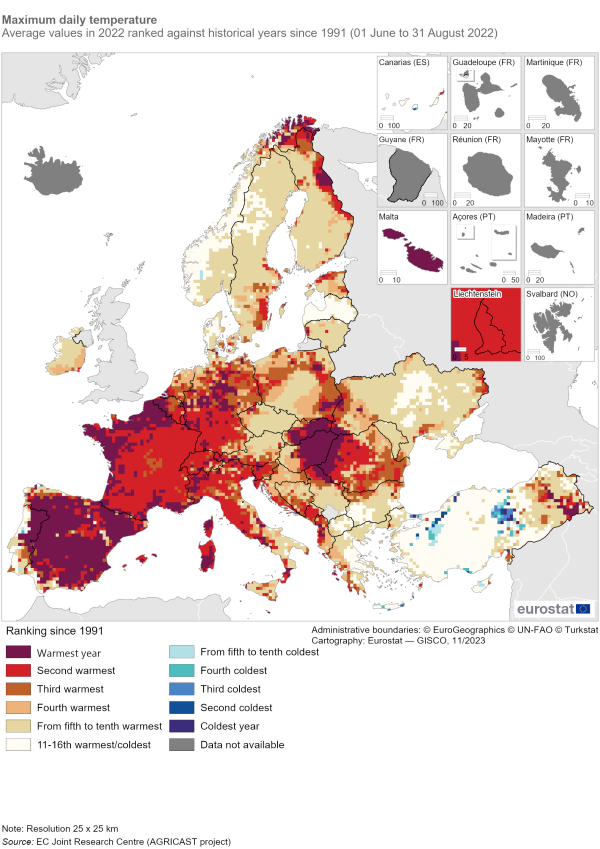
The summer of 2022 was characterised by exceptionally hot and/or dry weather conditions in large parts of Europe (see Map 1). Average daily maximum temperatures were the highest on record in most of western Europe and large parts of southern, central and northern Europe, and record-high daily maxima were experienced in many of these regions.
In most regions, winter crops and spring cereals were already too far advanced in development to be negatively impacted by these conditions - in fact, the warm and dry conditions were favourable for harvesting. However, in central Germany, Slovenia, Croatia, eastern Slovakia, and eastern Hungary, the persistent rainfall deficit combined with the heatwaves in July shortened the grain filling of winter crops and spring barley, with negative impacts on their yields.
Concerning summer crops, Hungary, Romania, Bulgaria, Spain, France, central and northern Italy, Slovenia, Croatia, eastern Slovakia, and central Germany, were among the most severely affected regions. Periods of water and heat stress partly coincided with the sensitive flowering and grain filling stages of plant growth, which resulted in an irreversible loss of yield potential. However, the scarcity of rainfall combined with occasionally hot temperature peaks also stressed summer crops in other regions. Several countries imposed measures to restrict water use for irrigation. At country level, only Poland, Denmark and Sweden experienced favourable conditions for crop growth during summer.
At EU level, the crops most seriously impacted were grain maize, sunflowers, rice and soybeans. Sugar beet, potatoes and green maize, which are mostly produced in northern regions were less impacted and even slightly benefited from the sunny and warmer than usual conditions, where irrigation was sufficient to complement water demands.
In most of the regions affected, the summer drought came to an end in the course of August. However, the improved weather conditions arrived too late to significantly benefit summer crops.
Autumn 2022
Autumn weather conditions allowed good progress with the harvesting of summer crops. Nonetheless, some grain maize fields were in such poor condition that they were harvested as green maize (for fodder or silage), leading to an additional reduction in grain maize production.
Cereals
The EU's 2022 cereal harvest fell sharply, impacted by a widespread drought
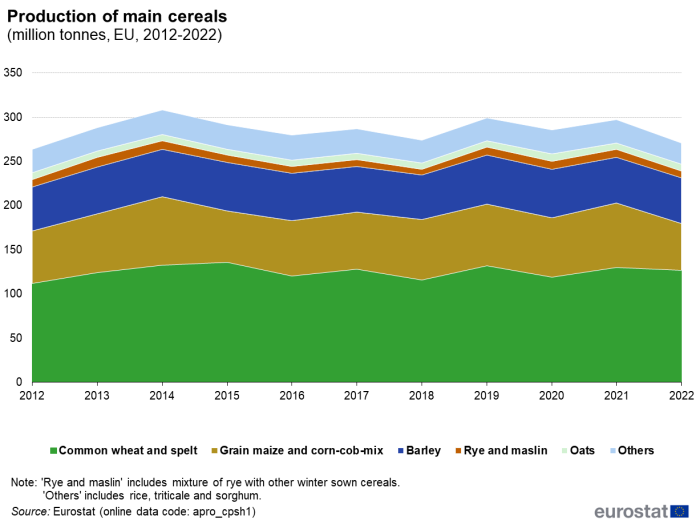
The harvested production of cereals (including rice) across the EU was an estimated 270.9 million tonnes in 2022. This was 26.7 million tonnes less than in 2021, the equivalent of an 9.0 % decrease. As such, production levels fell even further below the record 307.9 million tonnes recorded in 2014 (see Figure 1).
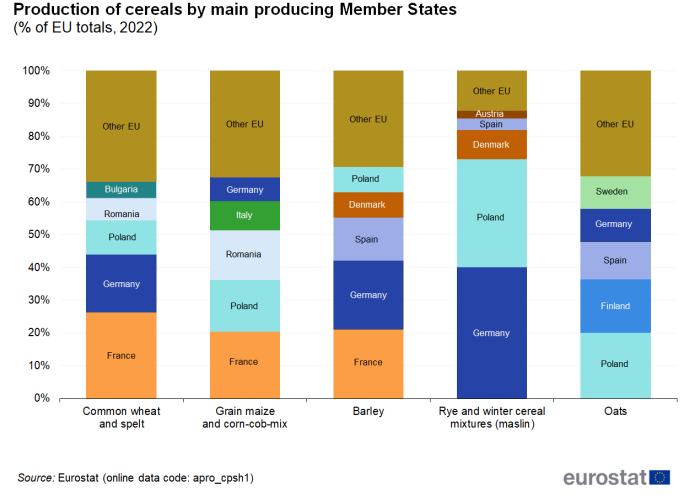
France harvested 59.9 million tonnes of cereals in 2022, corresponding to 22.1 % of the EU's total harvested production. Germany harvested 43.5 million tonnes of cereals (16.1 % of the EU total), Poland 35.0 million tonnes (12.9 % of the EU total), Spain 19.3 million tonnes (7.1 % of the EU total) and Romania 18.9 million tonnes (7.0 % of the EU total).
The overall decline in the EU's harvested production of cereals in 2022 was driven by developments in drought-affected Romania (-32.1 %: a decline of 8.9 million tonnes), France (-10.4 %: a decline of 7.0 million tonnes), Spain (-24.4 %: a decline of 6.2 million tonnes) and Hungary (-35.2 %: a decline of 4.9 million tonnes). There were very few countries where the overall cereals harvest increased but they included, among others, Germany (+2.6 %, an increase of 1.1 million tonnes), Finland (+39.1 %, a rebound of 1.0 million tonnes after a poor harvest in 2021) and Poland (+2.9 %, an increase of 1.0 million tonnes).
Slump in grain maize harvest: less common wheat: barley harvest unchanged
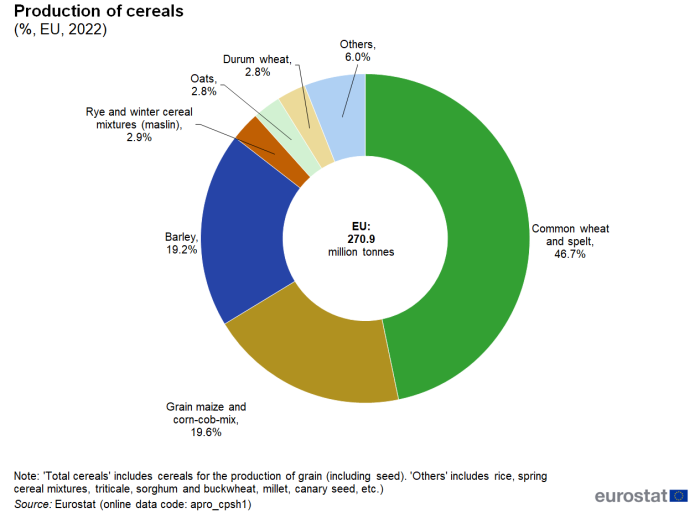
The EU harvested 126.7 million tonnes of common wheat and spelt in 2022, the equivalent of 46.7 % of all cereal grains harvested (see Figure 2). This was 3.2 million tonnes less than in 2021, a decrease of 2.5 %. This downturn was entirely due to falls in apparent yields, as the area harvested was marginally higher (+0.5 % to 21.9 million hectares). Lower harvested production levels in Spain (a decline of 1.9 million tonnes, the equivalent of -25.1 %), France (1.7 million tonnes less than in 2021), Romania (1.7 million tonnes less) and Hungary (0.9 million tonnes less) were only partially countered by higher production in Poland (an increase of 1.3 million tonnes) and Germany (an increase of 1.1 million tonnes).
The EU's harvested production of grain maize and corn-cob-mix slumped to 53.0 million tonnes in 2022, which was 20.0 million tonnes less than in 2021 (the equivalent of a 27.5 % decline). This sharp fall principally reflected the impact of the widespread droughts in the EU, with apparent yields down sharply, but also a fall in the area harvested (-4.4 % to 8.8 million hectares). The EU-level slump came principally from lower harvested production levels in Romania (down 6.8 million tonnes, the equivalent of -45.8 %), France (down 4.5 million tonnes, or -29.2 %) and Hungary (down 3.7 million tonnes, or -57.0 %).
The EU's harvested production of barley in 2022 was almost unchanged at 52.0 million tonnes. There were considerable contrasts among key producer Member States; there was a sharp decline in the harvested production of barley in Spain (-24.2 %, a reduction of 2.2 million tonnes) but higher levels in Germany (+7.6 %, an increase of 0.8 million tonnes) and in the Nordic Member States (Denmark +19.1 %, Sweden +42.4 % and Finland +40.4 %).
The EU's harvested production of oats was also unchanged in 2022 at 7.5 million tonnes, despite a sharp reduction in the area harvested (-8.0 %). The production rebounds in Finland (+52.1 %) and Sweden (+33.3 %) largely offset the declines in Spain (-27.3 %), France (-21.0 %) and Poland (-7.6 %).
A sharp reduction in the harvested area of rye across the EU in 2022 (a total -9.9 %) filtered through to a decline (-7.7 %, or 0.6 million tonnes) in harvested production to 7.8 million tonnes. This EU decline stemmed principally from lower production in Poland (-9.5 %), Germany (-5.8 %) and Spain (-33.1 %).
(% of EU totals, 2022)
Source: Eurostat (apro_cpnh1)
Prices for EU cereals continued to soar in 2022
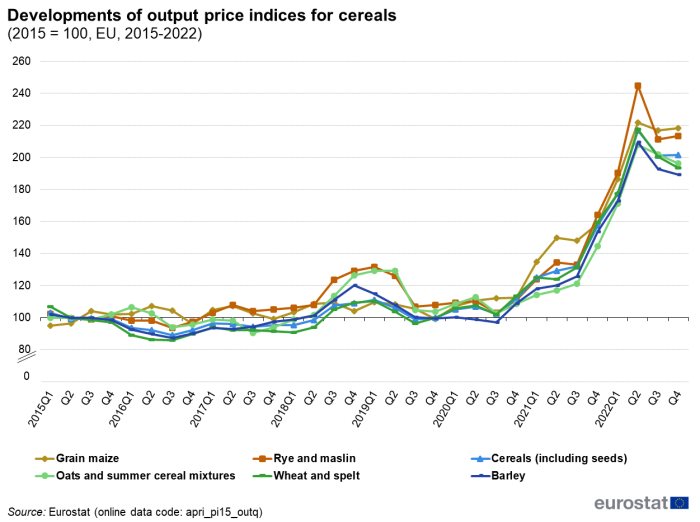
Continued instability on global markets, heightened by the war in Ukraine, as well as the overall reduction in cereals production in the EU, pushed prices for cereals even higher than in 2021 (up an average 45.6 % in nominal terms). The acceleration in the price increase of cereals in 2022 was a development common to all types of cereal: oats (+58.2 %), rye and maslin (+53.3 %), barley (+47.9 %), wheat and spelt (+46.3 %) and grain maize (+41.0 %). The price for cereals as a whole in 2022 was double that in 2015.
The upward surge in the average price of cereals after the third quarter of 2020 gained momentum into 2022 (see Figure 4). [2]. Apart from a temporary rise in prices from the third quarter of 2018 to the first quarter of 2019, there had otherwise been relative price stability over the medium term until late into 2020.
(2015 = 100, EU, 2015-2022)
Source: Eurostat (apri_pi15_outq)
Potatoes and sugar beet
Two main root crops are grown in the EU, namely sugar beet, grown on 1.4 million hectares across the EU in 2022, and potatoes, grown on another 1.4 million hectares. Other root crops like fodder beet, fodder kale, rutabaga, fodder carrot and turnips are specialist crops grown on a combined total of only an estimated 0.1 million hectares.
The EU is the world's leading producer of beet sugar, accounting for about one half of global production. However, only 20 % of the world's sugar production comes from beet sugar, the other 80 % being produced from sugar cane[3].
The EU sugar market was regulated by production quotas until September 2017. The European Commission's Directorate-General for Agriculture and Rural development then established a Sugar Market Observatory in order to provide the EU sugar sector with more transparency by means of disseminating market data and short-term analysis in a timely manner.
Sugar beet production and potato production in 2022 were down sharply on 2021 levels
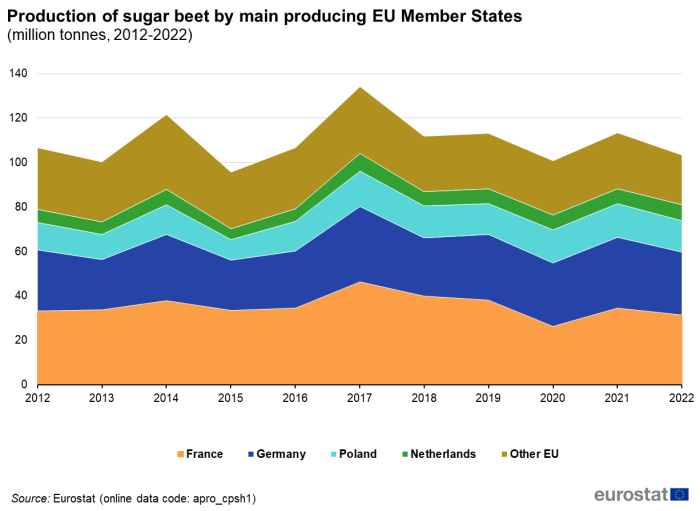
Following the decision to end production quotas, the EU sugar sector — supported by the CAP — underwent a series of deep reforms to prepare it more effectively for the new challenges and opportunities this would bring. In 2017, EU farmers responded by sowing more sugar beet (the cultivated area across the EU was 16.5 % higher than in 2016). The harvested production in 2017 reached a high of 134.2 million tonnes. Steady reductions in the harvested sugar beet area in subsequent years, with the exception of 2021, underpinned the downward trend in sugar beet production (see Figure 5). A combination of lower harvested area in 2022 (-4.5 %) and lower apparent yields, resulted in EU production falling to 103.5 million tonnes in 2022 (the equivalent of an 8.7 % decline).
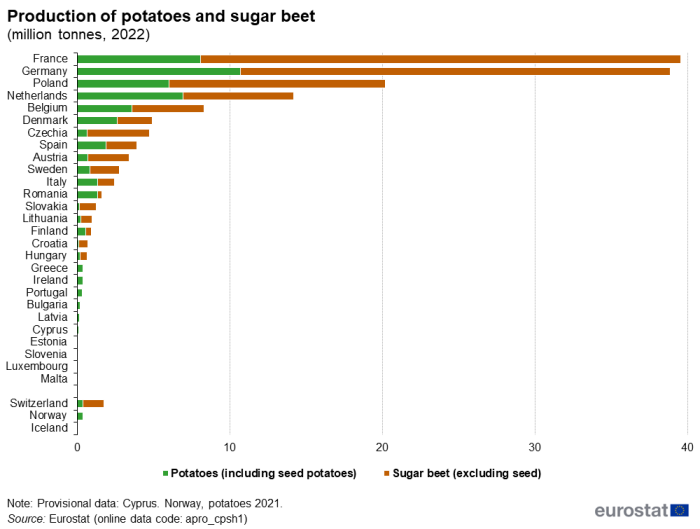
Almost four-fifths of the EU's production of sugar beet in 2022 came from four Member States; these were France (with a 30.4 % share), Germany (27.3 %), Poland (13.7 %) and the Netherlands (7.0 %). France produced 31.5 million tonnes of sugar beet in 2022, down 2.9 million tonnes on the level in 2021 (equivalent to a decline of 8.3 %). Germany also recorded a sharp decline in production (a loss of 3.7 million tonnes, equivalent to a decline of 11.7 %) to 28.2 million tonnes in 2022. Among the main producers of sugar beet, the Netherlands was the only one where production of sugar beet increased in 2022 (an additional 0.7 million tonnes, the equivalent of a 10.7 % increase).
The EU produced 47.5 million tonnes of potatoes in 2022, which was 3.0 million tonnes less than in 2021 (the equivalent of a 5.9 % decrease). This decline was driven, in particular, by lower production in Poland (-14.8 % to 6.0 million tonnes), France (-10.2 % to 8.1 million tonnes) and Germany (-5.6 % to 10.7 million tonnes).
Strong prices rises for sugar beet and potatoes in 2022
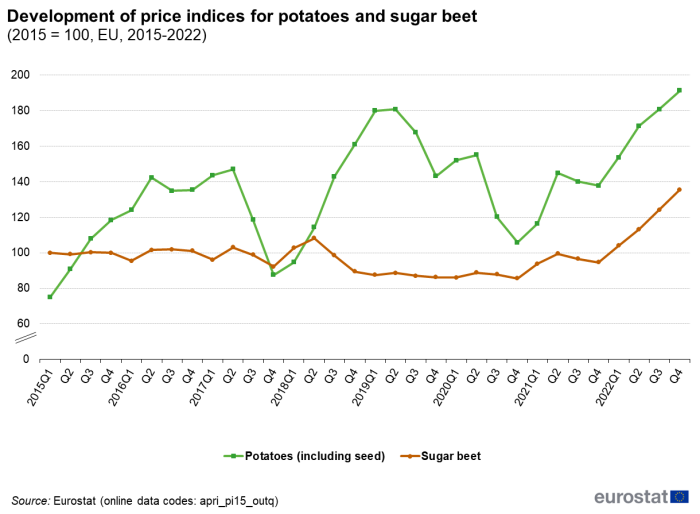
For the second successive year, there were strong average price rises for sugar beet in the EU as a whole; after a rebound of 12.3 % in 2021, there was an even steeper price rise of 34.9 % in 2022 (see Figure 7). The average price of potatoes across the EU as a whole also rose sharply in 2022 (an average +30.5 %), underlining the particularly volatile nature of potato prices.
(2015 = 100, EU, 2015-2022)
Source: Eurostat (apri_pi15_outq)
Oilseeds
Rise in overall oilseeds production in 2022, with strong increase in rape production
The EU principally cultivates three types of oilseed crop; the main two are rape and turnip rape, and sunflower, but there is also some soya. The EU harvested an estimated 32.5 million tonnes of oilseeds in 2022, about 1.2 million more tonnes than in 2021.
The harvested production of rape and turnip rape seeds in the EU was 19.4 million tonnes in 2022 (see Figure 8), which was 2.5 million tonnes more than in 2021 (equivalent to a rise of 14.6 %). This increase largely stemmed from an expansion in the area of rape and turnip rape harvested in 2022; the rise to 5.9 million hectares represented an increase in area of 10.5 % over that in 2021.
By contrast, adverse weather heavily impacted the apparent yields of sunflower seeds across the EU in 2022. The harvested production of 9.3 million tonnes in 2022 was 1.1 million tonnes less than in 2021 (the equivalent of a decline of 10.1 %), despite the considerable increase in the area harvested (+12.9 % to 4.9 million hectares). It was a similar development for soya, with adverse weather heavily impacting apparent yields. The harvested production of soya declined sharply (-7.6 %) to 2.5 million tonnes, despite the expansion in harvested area (an estimated +16.5 %).
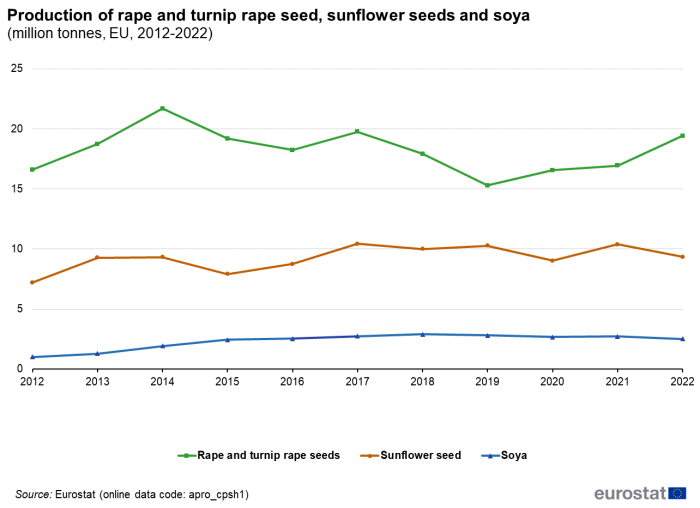
(million tonnes, EU, 2012-2022)
Source: Eurostat (apro_cpsh1)
Prices of all main oilseeds continued to rise sharply in 2022
The output prices of oilseeds continued to surge in 2022; the average EU price of rape and turnip rape seeds (+30.3 %), sunflowers seeds (+32.7 %) and soya (+11.8 %) all increased sharply. This reflected continued global production and distribution issues and unfavourable weather conditions for some oilseeds in key EU producer countries. Prices in the EU began to rise sharply from the fourth quarter of 2020 and that momentum continued through until mid-2022 (see Figure 9 and footnote 2).
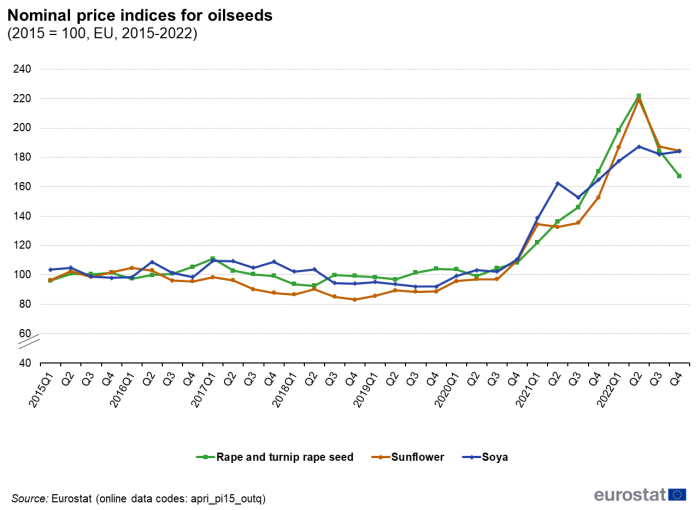
(2015 = 100, EU, 2015-2022)
Source: Eurostat (apri_pi15_outq)
Fruit
The EU supports the fruit and vegetable sector through its market-management scheme, which has four broad goals:
- a more competitive and market-oriented sector;
- fewer crisis-related fluctuations in producers' income;
- greater consumption of fruit and vegetables in the EU; and
- increased use of eco-friendly cultivation and production techniques.
The EU produces millions of tonnes of fruit every year
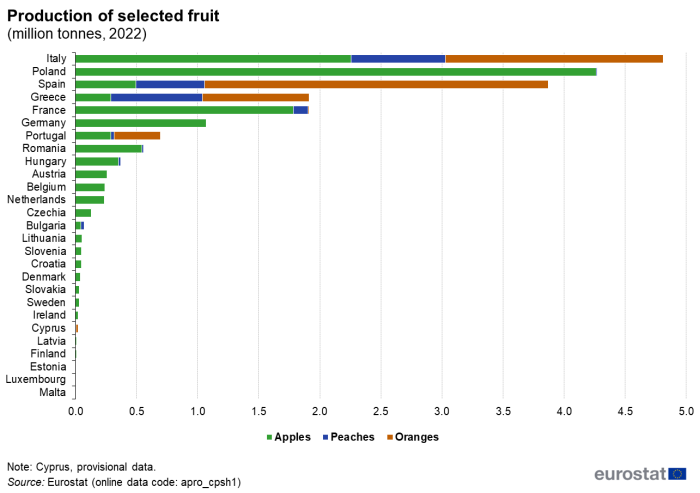
The EU produces a wide range of fruit, berries and nuts. An estimated 35.9 million tonnes were harvested in 2022, of which 14.7 million tonnes were pome fruit (apples and pears), 10.5 million tonnes were citrus fruit (such as oranges, satsumas and lemons), 6.3 million tonnes were stone fruit (such as peaches, nectarines, apricots, cherries and plums), 2.6 million tonnes were sub-tropical and tropical fruit (such as figs, kiwis, avocadoes and bananas), 1.1 million tonnes were nuts and 0.7 million tonnes were berries.
The harvested production of both apples and pears was higher in 2022 than 2021: the production of apples rose to 12.6 million tonnes (up 1.2 % on 2021) and pears to 2.1 million tonnes (+8.3 %). The harvested production of stone fruits was also higher in 2022 (+5.1 %), despite adverse weather conditions in some Member States; for example, the harvested production in Spain was down about one quarter in 2022 and that in Romania down about one fifth. Those same adverse weather conditions impacted the harvested production of citrus fruit, the reductions in Spain particularly impacting the EU decline (down -9.2 %).
Italy, Poland and Spain are the main EU producers of fruit, but for some specific fruit other Member States were key producers.
34 % of EU apple production in Poland; just under one half of all EU oranges from Spain
Thousands of varieties of apple are grown worldwide, many of which have been created and selected to grow in varied climates. This has enabled commercial apple production to take place in all Member States. Broadly speaking, three in every ten apples produced in the EU in 2022 (34.0 %) were harvested in Poland. The other principal apple-producing Member States were Italy (18.0 % of the EU total) and France (14.2 %).
By contrast, orange production and peach production are much more restricted by climatic conditions (see Figure 10); a little over 90 % of all oranges and peaches produced in the EU came from Spain, Italy and Greece.
Vegetables
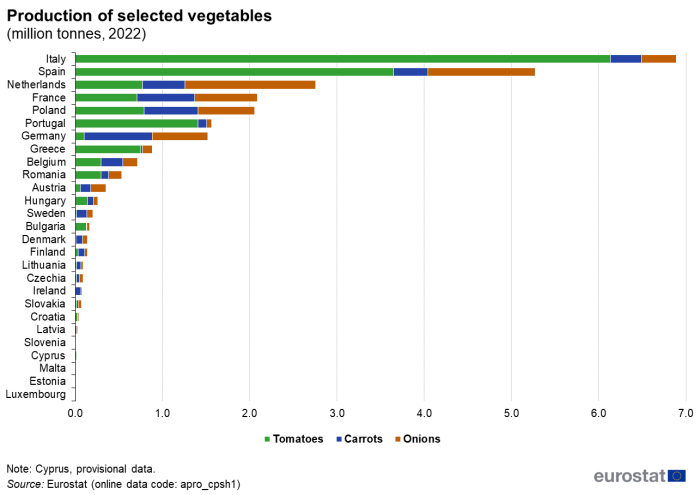
Italy and Spain produced about two thirds of the EU's tomatoes in 2022. The Netherlands and Spain produced a little more than two-fifths of the EU's onions
The EU's harvested production of fresh vegetables (including melons and strawberries) was 59.8 million tonnes in 2022, which was 7.4 million tonnes less than in 2021. Within the group of fresh vegetables, the harvested production of tomatoes declined to 15.4 million tonnes in 2022, that of onions to 6.2 million tonnes and that of carrots to 4.4 million tonnes.
Almost two thirds of EU tomato production in 2022 was together harvested in Italy (6.1 million tonnes) and Spain (3.7 million tonnes). In both countries, production levels in 2022 were sharply lower than in 2021 (-7.7 % and -23.2 % respectively).
Five Member States were responsible for two thirds of the EU's carrot production in 2022: Germany, France, Poland, the Netherlands and Spain. The harvested production of carrots in the EU in 2022 was down sharply (-15.9 %) on the level in 2021. There were declines in all five of the main carrot producing Member States, ranging from relatively moderate ones in Poland (-2.9 %) and France (-4.1 %) to more considerable ones in Germany (-18.9 %) and the Netherlands (-24.0 %).
About three-quarters of the EU's onion production in 2022 was harvested in the Netherlands (down 21.9 % to 1.5 million tonnes), Spain (down 15.7 % to 1.2 million tonnes), France (down 12.8 % to 0.7 million tonnes), Poland (up 5.2 % to 0.6 million tonnes) and Germany (down 13.6 % to 0.6 million tonnes).
Grapes for wine
The EU is big player on the world's wine market; in 2020, it accounted for 64 % of global production, 48 % of consumption and 45 % of the wine-growing areas in the world [4].
Harvested production in many of the main grape-producing countries rose in 2022
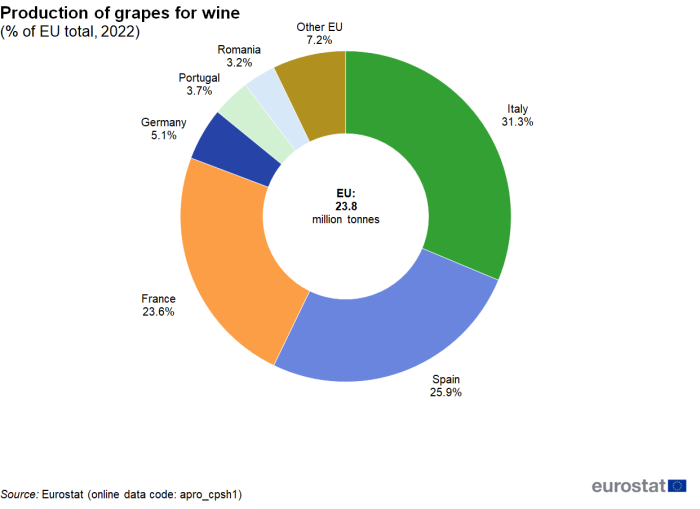
The total harvested production of grapes for wine in the EU was an estimated 23.8 million tonnes in 2022. This was 1.0 million tonnes more than in 2021 but still markedly less than the 25.7 million tonnes in 2018. Italy, Spain and France account for the vast majority of grape production for wine in the EU (see Figure 12). The overall increase in production at the level of the EU was driven by higher output in France (up 1.1 million tonnes, or +22.2 %) and in Italy (up 0.3 million tonnes, or +4.8 %). By contrast, production in Spain was slightly lower (-2.9 %).
Olives for oil
The EU is usually the largest producer of olive oil in the world, typically accounting for around two thirds of global production. Most of the world's production comes from southern Europe, northern Africa and the Near East, as 95 % of the olive trees in the world are cultivated in the Mediterranean region. With production concentrated in a relatively small area, the effects of a disease outbreak can have significant implications. For this reason, steps are being taken as a precautionary measure against the spread of the Xylella fastidiosa bacterium [5] which arrived in Italy in 2013.
Spain is by far the largest producer of olives for olive oil in the EU but its output halved in 2022
Olives often follow a two-year cycle, with a large crop followed by a smaller one. Sometimes the weather can make these cycles more pronounced. Individual countries can have cycles that run counter to one another.
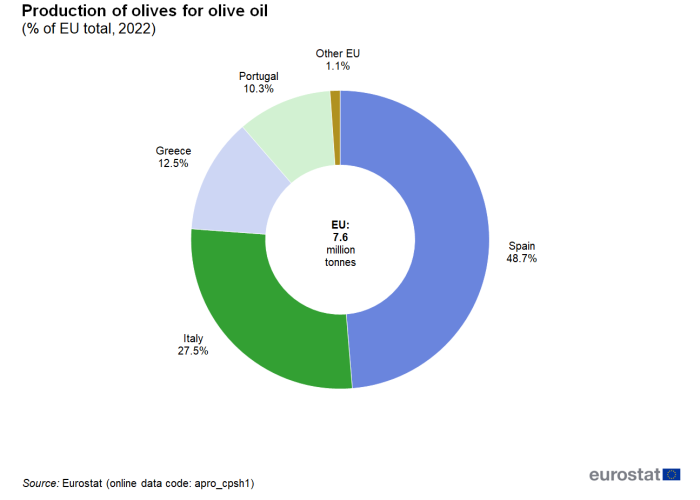
The total harvested production of olives for olive oil in the EU was 7.6 million tonnes in 2022. This was 4.6 million tonnes less than the production level in 2021 and the lowest harvest for at least the period since 2000. Adverse weather conditions impacted the harvested production in Spain, traditionally the largest EU producer country, which halved (down 52.1 %) to 3.7 million tonnes. After a bumper harvest in Portugal in 2021, there was also a considerable decline of 0.6 million tonnes in 2022 (the equivalent of a fall of 42.6 %). The decline in Italy to 2.1 million tonnes in 2022 was more moderate (-4.9 %) and there was a small increase (+3.8 %) in Greece to 0.9 million tonnes.
Source data for tables and graphs
Data sources
Crops statistics
Statistics on crop products are collected under Regulation (EC) No 543/2009 and obtained by sample surveys, supplemented by administrative data and estimates based on expert observations. The sources vary from one EU Member State to another because of national conditions and statistical practices. National statistical institutes or Ministries of Agriculture are responsible for data collection in accordance with EU regulations. The finalised data sent to Eurostat are as harmonised as possible. Eurostat is responsible for establishing EU aggregates.
The statistics that are collected on agricultural products relate to more than 100 individual crop products. Information is collected for the area under cultivation (expressed in 1 000 hectares), the quantity harvested (expressed in 1 000 tonnes) and the yield (expressed in tonnes per hectare). For some products, data at a national level may be supplemented by regional statistics at NUTS levels 1 or 2.
Agricultural price statistics
EU agricultural price statistics (APS) are based on voluntary agreements between Eurostat and the EU Member States.
National statistical institutes or Ministries of Agriculture are responsible for collecting absolute prices and calculating corresponding average prices for their country, as well as for calculating price indices and periodically updating the weights.
Price indices are reported quarterly and annually. Absolute prices are reported annually. The agricultural prices expressed in national currency are converted into euro by Eurostat using fixed exchange rates or financial market exchange rates, in order to allow comparisons between the EU Member States. Eurostat is responsible for calculating indices for the EU.
Context
There is a diverse range of natural environments, climates and farming practices across the EU, reflected in the broad array of food and drink products that are made available for human consumption and animal feed, as well as a range of inputs for non-food processes. Indeed, agricultural products form a major part of the cultural identity of the EU's people and its regions.
Statistics on agricultural products may be used to analyse developments within agricultural markets in order to help distinguish between cycles and changing production patterns; they can also be used to study how markets respond to policy actions. Agricultural product data also provide supply-side information, furthering understanding as regards price developments which are of particular interest to agricultural commodity traders and policy analysts.
Direct access to
- Agriculture (t_agri), see:
- Agricultural production (t_apro)
- Crops products (t_apro_cp)
- Agriculture (agri), see:
- Agricultural production (apro)
- Crops products (apro_cp)
- Crop statistics (area, production and yield) (apro_acs)
- Crop statistics (from 2000 onwards) (apro_acs_a)
- Crop statistics (area, production and yield) (apro_acs)
- Crops products (apro_cp)
- Key Figures on the European food chain — 2022 edition (statistical book)
- Agricultural production data: methodological notes
- Crop production (ESMS metadata file — apro_cp_esms)
- Crops products: supply balance sheets (ESMS metadata file — apro_cbs_esms)
- Regulation (EC) No 543/2009 of 18 June 2009 concerning crop statistics
- Summaries of EU Legislation: Agricultural production — crop statistics
- European Commission — Agriculture and rural development — food, farming, fisheries
- European Commission — Agriculture and rural development — cereals and oilseeds
- European Commission — Agriculture and rural development — fruits and vegetables
- European Commission — Agriculture and rural development — wine
- European Commission — Agriculture and rural development — olive oil
- European Commission — Agriculture and rural development — short- and medium term outlook and market reports for EU arable crops, dairy and meat markets
Notes
- ↑ The Joint Research Centre (JRC) of the European Commission produces a series of monthly bulletins concerning weather conditions in relation to crop performance and expected yields in Europe. The analysis is conducted at the EU and Member State level, and also comprises several neighbouring countries/regions (United Kingdom, North Africa, Turkey, Ukraine, Russia, Kazakhstan, Belarus).
- ↑ See the News Item, [1] 'EU agricultural prices continued to rise in Q2 2002' for more details. Although outside the period of analysis, [2] 'there has since been an acute slowdown in agricultural output prices'.
- ↑ European Commission's Directorate- General of Agriculture and Rural Development: http://ec.europa.eu/agriculture/sugar/index_en.htm.
- ↑ For further information, see the overview of the wine market from the European Commission's Directorate- General of Agriculture and Rural Development.
- ↑ For further information see the plant health and biosecurity products pages of the European Commission.
