Agri-environmental indicator - soil erosion
Data extracted in February 2020.
Planned update: March 2025.
Highlights
In 2016, over 80 % of all areas in the EU-27 estimated to be affected by moderate to severe soil erosion were agricultural areas and natural grassland.
The share of agricultural areas and natural grasslands estimated to be affected by moderate or severe soil erosion by water declined by 2.6 percentage points in the EU-27 between 2000 and 2016.
This article provides information on the European Union (EU) agri-environmental indicator soil erosion by water. It consists of an overview of data, complemented by information needed to interpret these data. This article on soil erosion in the EU is part of a set of similar fact sheets, providing a comprehensive picture of the integration of environmental concerns into the Common Agricultural Policy (CAP).
Soil erosion by water is one of the most widespread forms of soil degradation in Europe. The impact of soil erosion by water processes like rain splash, overland flow/sheetwash and rill formation is the removal of soil. The main consequences are a loss of cultivable, fertile land, soil structure degradation, destruction of infrastructures, pollution of surface water, flood risk, etc.
Agriculture is negatively affected by soil erosion, but also contributing to it, as land use and land management are among the main driving forces of soil erosion. Therefore, it is important to enhance management practices in agriculture (e.g. reduced tillage, management of plant residues and winter crops, stone walls, grass margins and contour farming) to prevent erosion processes.
Full article
Introduction
What is soil erosion?
Erosion can be defined as the wearing away of the land surface by physical forces such as rainfall, flowing water, wind, ice, temperature change, gravity or other natural or anthropogenic agents that abrade, detach and remove soil or geological material from one point on the earth's surface to be deposited elsewhere. When used in the context of pressures on soil, erosion refers to accelerated loss of soil as a result of anthropogenic activity, in excess of accepted rates of natural soil formation[1].
The loss of soil leads to a decline in organic matter and nutrient content, the breakdown of soil structure, a reduction of the available soil water stored, which can lead to an enhanced risk of flooding and landslides in adjacent areas. Nutrient and carbon cycling can be significantly altered by mobilisation and deposition of soil[2], as eroded soil may lose 75 % - 80 % of its carbon content, with consequent release of carbon to the atmosphere[3]. Soil erosion impacts strongly on the environment and has high economic costs; to mitigate these effects, soil and water conservation strategies are required.
Quick info on data methodology
This fact sheet describes the susceptibility of soil to erosion by water across Europe, including current estimated levels and historical trends. The trend information identifies those countries or regions for which an improvement and/or deterioration in soil erosion rate can be observed. It is important to note that the data are based on a modelling carried out by the Joint Research Centre (JRC) and are estimates rather than measured values.
The section "Data sources" provides an insight in the land cover types and erosion rates used.
Analysis at EU and country level
Agriculture is a main driver of soil erosion by water
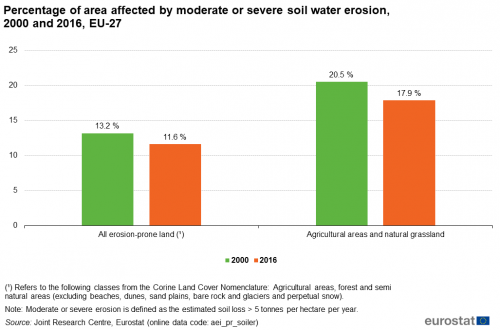
Soil erosion by water is one of the most widespread forms of soil degradation in Europe. Approximately 11.6 % of all erosion-prone land[4] is estimated to have been affected by moderate or severe soil erosion (more than 5 tonnes per hectare per year) in 2016 in the EU-27 (Figure 1). This concerned 43 million hectares. The share of land in this category declined by 1.6 pp (percentage points) for EU-27 since the year 2000.
Agricultural areas and natural grassland made up over 80 % of all erosion-prone land affected by moderate or severe soil erosion by water in the EU in 2016. This means that an estimated 17.9 % of agricultural areas and natural grassland were affected, a decrease of 2.6 percentage points since 2000 (Figure 1). It is mainly thanks to improved management practices that have been applied to prevent soil erosion, but still about 35 million hectares are affected.
Source: Eurostat (aei_pr_soiler)
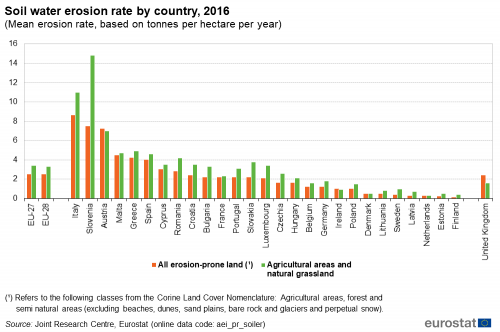
The mean rate of soil erosion by water was 2.5 tonnes per hectare per year on all erosion-prone land[5] in the EU in 2016 (Figure 2). On agricultural areas and natural grassland, the mean rate was even higher: 3.4 t/ha/year in the EU-27. In most countries, the mean rate is higher on agricultural areas and natural grassland compared to all erosion-prone land, except for Denmark, Ireland, the Netherlands, Austria, as well as in the United Kingdom. A positive factor can be agriculture which is influenced by livestock farming with larger areas of permanent grass cover, which is not as prone to erosion as arable land.
Several countries in the southern and south-eastern parts of Europe had significantly higher mean erosion rates than the mean value for the EU on all-erosion prone land: Italy, Slovenia, Austria, Malta, Greece, Spain, Cyprus and Romania. If considering only the land covered by agricultural areas and natural grassland, then also Croatia and Slovakia show a higher mean erosion rate than the EU. All these countries are characterised by mountain areas which implies a topography of steep slopes. The combined factors of slope steepness and slope length have the greatest influence on soil loss[6]. Member States that are dominated by a flatter topography were estimated to experience a lower mean erosion rate (<= 1 t/ha/year). This was the case for Ireland, Poland, Denmark, Lithuania, Latvia, the Netherlands, Estonia, Finland, but also Sweden which has both mountainous regions and plains (Figure 2).
(Mean erosion rate, based on tonnes per hectare per year)
Source: Eurostat Template:Stablelink
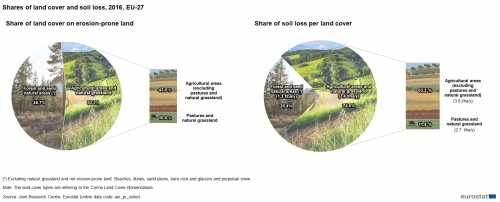
The land cover type 'agricultural areas and natural grassland' is more than half of the area of all erosion-prone land (53.3 % in 2016 in the EU-27) (Figure 3). But the share of total estimated soil eroded on this land cover type in 2016 is disproportionately high: 74.6 % for EU-27. In comparison with the mean soil loss on agricultural areas and natural grassland (3.4 tonnes per hectare per year), the mean soil loss on forest and semi-natural areas was only 1.3 t/ha/year in the EU-27. Thus, agriculture is a main driver of soil erosion by water.
Agricultural areas excluding pastures and natural grassland[7] are more prone to erosion (Figure 3) and accounted for 63.2 % of total soil loss in 2016, with a mean soil loss rate of 3.6 t/ha/year in the EU-27. Pastures and natural grassland, however, accounted for 11.4 %, or 2.7 t/ha/year in the EU-27.
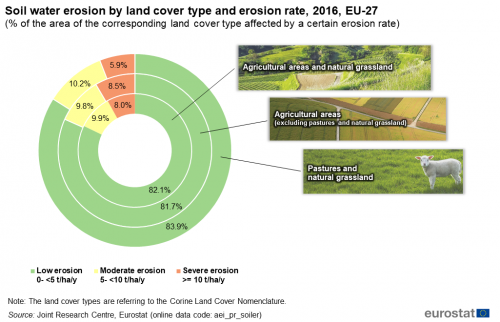
A comparison of the erosion rate on different combinations of agricultural land cover types (Figure 4) shows that, for all of them, more than 80 % were classified as low erosion (0 to <5 t/ha/year) in the EU in 2016. Pastures and natural grassland had the lowest rate of severe erosion; 5.9 % for EU-27, while 10.2 % falls under moderate erosion. For other agricultural areas (excluding pastures and natural grassland), 8.5 % was classified as under severe erosion and 9.8 % as moderate for the EU-27.
(% of the area of the corresponding land cover type affected by a certain erosion rate)
Source: Eurostat (aei_pr_soiler)
Analysis at regional level
Mountainous areas are more prone to soil erosion than flat areas
Map 1 shows the mean soil loss rate at NUTS 3 level in 2016, categorised in low, moderate and severe erosion, and supports the findings of Figure 2 on a regional level. Regions with a mountainous topography show moderate or severe erosion rates, like the Alps covering parts of Germany, France, Italy, Austria and Slovenia; the Pyrenees on the border between Spain and France; the Dinaric Alps covering parts of Croatia and Slovenia; the Tatra Mountains along the border between Poland and Slovakia; the Mediterranean islands Crete, Mallorca, Corsica, Sardinia and Sicily; the Balkan mountain range and the Rhodopes in Bulgaria; the Sauerland in Germany; the Pindos and Peloponnes in Greece; the Baetic Cordillera, the Iberian range and the Cantabrian and Gallician mountains in Spain; south parts of the Massif Central in France; the Apennines in Italy; the mountain areas in northern Portugal and the Carpathians in Romania; this was also the case in the Brecon Beacons and Cambrian Mountains in Wales and the Scottish Highlands.
Especially mountainous regions of Italy and Slovenia and Oberkärnten in Austria were estimated to have high amounts of soil erosion, >20 t/ha/year.
On the other hand, regions that are dominated by a rather flat topography had low erosion rates (<5 t/ha/year), like the Baltic countries; the Pannonian Plain covering large parts of Hungary, and also of north-eastern Croatia and western Romania; the Danubian and Wallachian Plain in Bulgaria and Romania; northern Belgium and France; Denmark; northern Germany; Ireland; the Po valley in Italy; Malta; the Netherlands; Poland; south Portugal; Finland; this was also the case in southern United Kingdom.
Regions with a hilly or mixed topography can also have low erosion rates, like Bulgaria, Czechia, southern Germany, north-eastern Greece, large parts of Spain, the centre of France, Cyprus, Luxembourg, northern Sweden, as well as in the north of the United Kingdom. Topography is not the only driver for soil erosion by water. Also precipitation, soil cover and human activities play a crucial rule (read more in the methodology part under "Data sources").
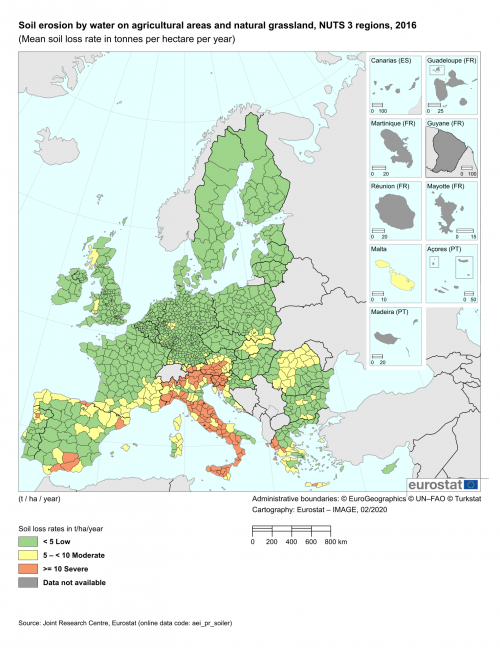
(Mean soil loss rate in tonnes per hectare per year)
Source: Eurostat (aei_pr_soiler)
There is a reduction of soil erosion by water especially on arable land and permanent crop areas
Generally, in most parts of Europe a decrease in soil erosion has been estimated. A comparison of the change in share of soil erosion by water between 2000 and 2016 on agricultural areas and natural grassland shows a significant decline of the mean soil loss for the following regions: northern Belgium; the Danubian Plain in Bulgaria; some parts of Czechia; Germany especially northern and eastern parts; western Estonia; Thessaly and some islands in Greece; some parts of central and east of Spain; the Balearic islands; northern France; Dalmatia in Croatia; the Po valley and southern Apulia in Italy; south of Sicily; Malta; Groningen and south-eastern Drenthe in the Netherlands; western and north-eastern Austria; northern Portugal; southern Finland and Sweden; this was also the case in the east of Scotland (Tayside) and large parts of the south-east of the United Kingdom (Map 2).
In most of these regions, agriculture is dominated by arable land or permanent crops. The efforts of the last two decades regarding an improvement of farming methods to prevent soil erosion are likely to have an influence on the reduction of soil erosion.
However, the estimated soil erosion in other parts of Europe decreased less or remained stable between 2000 and 2016. This refers to areas with a general low rate of soil erosion e.g. Ireland, most parts of the Netherlands, northern Finland and Sweden as well as several parts of eastern European Member States. On the other hand, this refers also to regions with a moderate or severe erosion rate e.g. western Greece and Crete, northern and southern Spain, southern France and most parts of Italy and Slovenia.
An increase is estimated for some regions, especially for some mountainous areas of Austria, as well as for Wales, south-west England and the highlands of Scotland (Map 2).
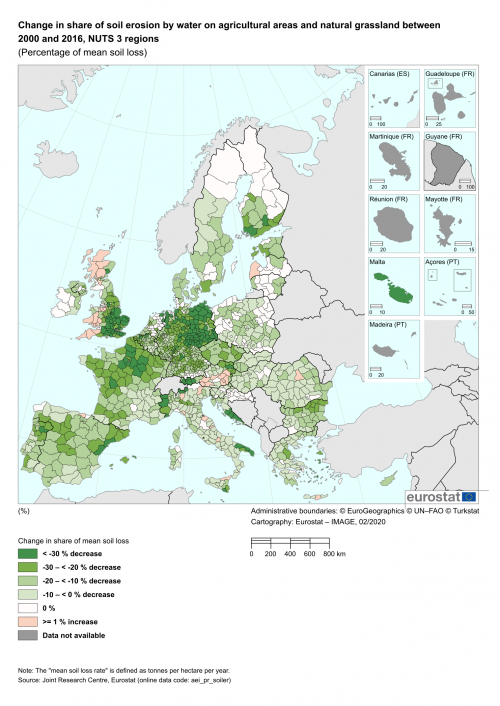
(Percentage of mean soil loss)
Source: Eurostat (aei_pr_soiler)
Source data for charts, graphs and maps
Data sources
Indicator definition
The indicator soil erosion estimates the agricultural areas and natural grassland affected by a certain rate of soil erosion by water.
Main indicator:
- Land cover types (referring to the CORINE Land Cover (CLC) Nomenclature):
- "All erosion-prone land" which is agricultural areas, forest and semi natural areas (excluding not erosion-prone land cover types like beaches, dunes, sand plains, bare rock and glaciers and perpetual snow)
- Agricultural areas and natural grassland, split in the following two categories:
- Agricultural areas (excluding pastures and natural grassland): Arable land, permanent crops and heterogeneous agricultural areas like agro-forestry areas
- Pastures and natural grassland
- Erosion rates:
- Total (> 0 tonnes per hectare per year)
- Moderate or severe (> 5 tonnes per hectare per year)
- Moderate (5-10 tonnes per hectare per year)
- Severe (> 10 tonnes per hectare per year)
- Spatial scale: Aggregated up to NUTS 3 regions
Supporting indicator:
- Estimated soil loss by water erosion in:
- tonnes per year
- hectares per year
- tonnes per hectare per year (mean)
- share of a land cover class with a certain soil erosion rate (in relation to the total area of the corresponding land cover class)
Links with other indicators
This indicator has links to a number of other agri-environmental indicators that describe developments in some of the main contributory factors.
Data used
The data are produced on the basis of an empirical computer model by the Joint Research Centre (JRC). Therefore, the data do not represent measurements, but estimated values on soil erosion for NUTS 3 administrative areas. This model considers only soil erosion from rainsplash, overland flow (also known as sheetwash) and rill formation.
The land cover classes of the coverage area refer to the Corine Land Cover (CLC) Nomenclature. Generally, artificial, sandy, rocky and icy surfaces as well as wetlands and water bodies are not included in the area on which the indicator is based.
The data set contains a differentiation in the following classification groups:
- CLC 2 and 3 excluding 331, 332 and 335: In this article, the simplified term "All erosion-prone land" was used. More concrete it comprises agricultural areas, forest and semi natural areas (excluding not erosion-prone land cover types like beaches, dunes, sand plains, bare rock and glaciers and perpetual snow).
- CLC 2 and 321: Agricultural areas (2) and natural grassland (321), split in the following two categories:
- CLC 2 excluding 23: Refers to cropland in simplified terms. More concrete it comprises agricultural areas (2) (excluding pastures (23) and natural grassland): arable land, permanent crops and heterogeneous agricultural areas like agro-forestry areas.
- CLC 23 and 321: Refers to grassland in simplified terms. More concrete it comprises pastures (23) and natural grassland (321).
Methodology
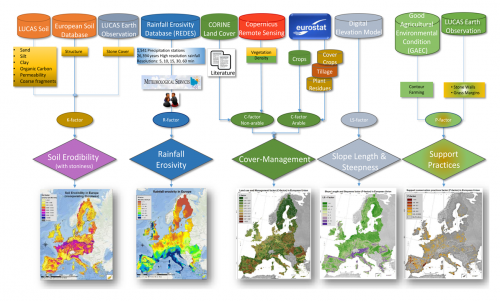
The indicators are predicted estimates and not actual values. They are derived from an enhanced version of the Revised Universal Soil Loss Equation (RUSLE) model [8] which was developed to evaluate soil erosion by water at a regional scale. This advanced version is named RUSLE2015 and is based on high quality and peer reviewed published input layers (soil erodibility, rainfall erosivity, topography, land cover, conservation practices)[9] (Figure 5). Moreover, the most recent and available pan-European datasets have been used to model the input layers. The model structure has been adapted in order to take into account conservation planning, inventory erosion rates and estimate sediment delivery on the basis of accepted scientific knowledge and technical judgment. In this assessment, the basic RUSLE model has been adapted through the improved quality of the input factors.
The RUSLE2015 model has been used due to its flexibility in relation to input data requirements. In addition, the best available pan-European databases have been introduced for all input layers.
Only soil erosion resulting from rainsplash, overland flow (also known as sheetwash) and rill formation are considered. These are some of the most effective processes to detach and remove soil by water. In most situations, erosion by concentrated flow (rills and gullies) is the main agent of erosion by water. The data availability of input layers is an important issue for modellers. Readers should be aware that due to the limitations in CORINE Land Cover classification and uncertainty of rainfall erosivity in certain areas, the results provide an estimation of the soil erosion rates. It should also be pointed out that the soil loss rates presented in this indicator are long-term averages and should not be compared with event-based observations, given the large seasonal variability of the rainfall erosivity and cover management (R and C-factors). Concluding, it is better not to take decisions at pixel level (100 meters resolution) where it is recommended to use local measurements.
Validation of modelled data is an issue at the European scale. Due to limited measurement data across Europe, the validation of modelled data is problematic. Measurement of actual soil loss by using long term experimental plots, Caesium-137 measurements and sampling of sediment loads in the runoff is relatively possible only for small catchments. For a continental scale this type of validation is not financially feasible. The RUSLE2015 data have been verified against the soil erosion estimates provided by the Member States in the EIONET data collection exercise (2009-2010)[10]. In the future, the modelled data can be validated with long-term plots depending on the availability of those datasets.
The main factors affecting the rates of soil erosion by water are precipitation, soil type, topography, land use and land management. The most commonly used erosion model is the Universal Soil Loss Equation (USLE) and its revised version (RUSLE)[11] [12] which estimates long-term average annual soil loss by sheet and rill erosion. It should be noted that soil loss caused by (ephemeral) gully erosion is not predicted by RUSLE[13]. RUSLE is still the most frequently used model at large scales[14][15] as it can process data input for large regions, and provides a basis for carrying out scenario analysis and taking measures against erosion[16]. In addition, a recent collection of soil loss data in Europe by the European Environmental Information and Observation Network (EIONET) found that all participating countries used USLE/RUSLE[17] to model soil loss.
The revised version of the RUSLE is an empirical model that calculates soil loss due to sheet and rill erosion. The model considers six main factors controlling soil erosion: the erosivity of the eroding agents (water), the erodibility of the soil (including stoniness), the slope steepness and the slope length of the land, the land cover and management, and the human practices designed to control erosion. The model estimates erosion by means of an empirical equation:
Er = R K L S C P
Where:
Er = (annual) soil loss (tonne per hectare per year)
R = rainfall erosivity factor (MJ mm ha-1 h-1 yr-1)
K = soil erodibility factor (t ha h ha-1 MJ-1 mm-1)
L = slope length factor (dimensionless)
S = slope steepness factor (dimensionless)
C = cover management factor (dimensionless)
P = human practices aimed at erosion control (dimensionless)
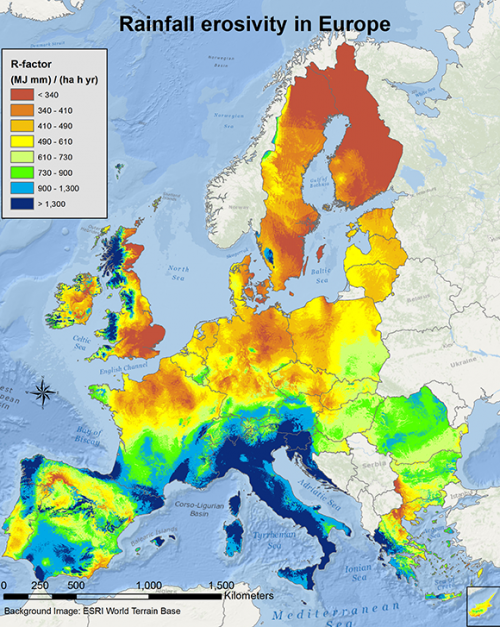
- Rainfall erosivity factor (R) (Map 3). The intensity of precipitations is one of the main factors affecting soil water erosion processes. R-factor is a measure of the precipitation’s erosivity and indicates the climatic influence on the erosion phenomenon through the mixed effect of rainfall action and superficial runoff, both laminar and rill. Wischmeier[18] identified a composite parameter EI, as the best indicator of rain erosivity. It is determined, for the ki-th rain event of the i-th year, by multiplying the kinetic energy of rain by the maximum rainfall intensity occurred within a temporal interval of 30 minutes. In RUSLE20015, the R-factor is calculated based on high-resolution temporal rainfall data (5, 10, 15, 30 and 60 minutes) collected from 1 541 well-distributed precipitation stations across Europe[19]. This first Rainfall Erosivity Database at the European Scale (REDES) was a major advancement in calculating rainfall erosivity in Europe. The precipitation time series used ranged from 7 to 56 years, with an average of 17.1 years. The time-series precipitation data of more than 75 % of EU countries cover the decade 2000-2010. Gaussian Process Regression (GPR)[20] has been used to interpolate the R-factor station values to a European rainfall erosivity map at 500 m resolution. The covariates used for the R-factor interpolation were climatic data (total precipitation, seasonal precipitation, precipitation of driest/wettest months, average temperature), elevation and latitude/longitude. The mean R-factor for the EU plus Switzerland is 722 MJ mm ha-1 h-1 yr-1, with the highest values (over 1 000 MJ mm ha-1 h-1 yr-1) in the Mediterranean and Alpine regions and the lowest (less than 500 MJ mm ha-1 h-1 yr-1) in the Nordic countries. The erosivity density (erosivity normalised to annual precipitation amounts) was also highest in Mediterranean regions which implies high risk for erosive events and floods. Data are available for download from the European Soil Data Centre (ESDAC).
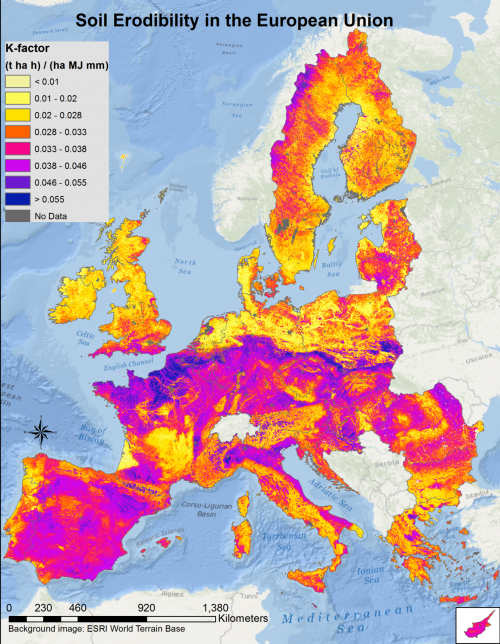
- Soil erodibility factor (K) (Map 4). The K-factor is a lumped parameter that accounts for the reaction of the integrated annual soil profile to the process of soil detachment, and transport by raindrops and surface flow[21]. In RUSLE2015, the K-factor is estimated for the 20 000 field sampling points including in the Land use/cover area frame statistical survey (LUCAS). Following the Wischmeier and Smith (1978) nomograph, the K-factor uses five soil parameters as inputs: texture (silt, clay, sand fraction), organic matter content, coarse fragments content, permeability, and soil structure. The mean K-factor for Europe was estimated at 0.032 t ha h ha-1 MJ-1 mm-1 with a standard deviation of 0.009 t ha h ha-1 MJ-1 mm-1. The yielded soil erodibility dataset compared well with the published local and regional soil erodibility data. However, the incorporation of the protective effect of surface stone cover, which is usually not considered for the soil erodibility calculations, resulted in an on average 15 % decrease of the K-factor. The exclusion of this effect in K-factor calculations is likely to result in an overestimation of soil erosion, particularly for the Mediterranean countries, where highest percentages of surface stone cover were observed[22]. Data are available for download from the European Soil Data Centre (ESDAC).
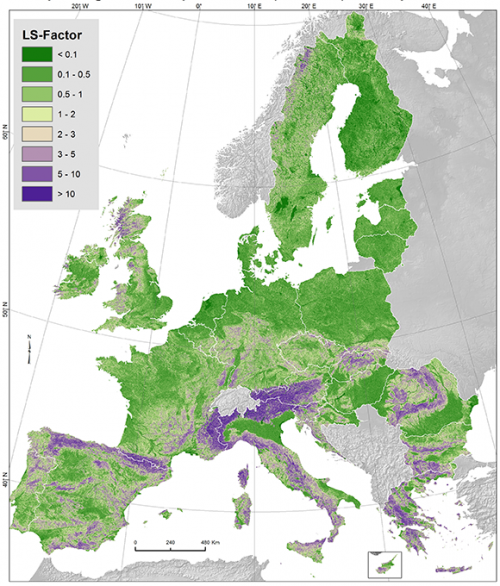
- Topographic factors - slope length (L) and slope steepness (S) (Map 5). The influence of topography on soil loss modelling is accounted for within the slope length and slope steepness factors. The L-factor represents the impact of slope length, and the S-factor the influence of slope angle. The combined LS-factor (dimensionless) describes the potential of surface runoff in accelerating soil loss, and in most cases determines the spatial resolution (cell size) of the modelled soil loss results. In RUSLE2015, the LS-factor is calculated using the equations proposed by Desmet and Govers (1996). The LS-factor dataset was calculated using a high-resolution (25 m) Digital Elevation Model (DEM) for the whole European Union, resulting in an improved delineation of areas at risk of soil erosion as compared to lower-resolution datasets[23]. The LS-factor data are available for download in 2 resolutions (25m and 100m) from the European Soil Data Centre (ESDAC).
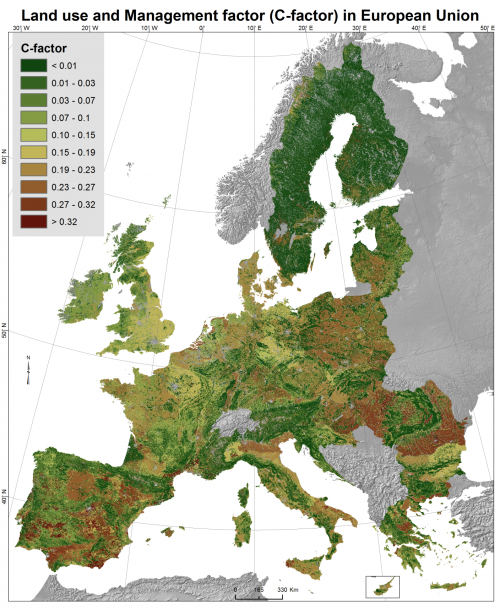
- Cover-Management factor (C) (Map 6). The C-factor accounts for the influence of land use (mainly vegetation type and cover) and management practices (mainly in arable land) in reducing the rate of soil erosion by water. The C-factor (dimensionless) is the ratio of soil loss from a specific land-cover type to the soil loss from a bare plot, and ranges between 0 and 1[24]. In RUSLE2015, the C-factor estimation is differentiated between arable and non-arable land. For all non-arable lands, the C-factor is determined mainly by vegetation. Non-arable land covers approximately 75 % of the EU. The CORINE Land Cover database (CLC 2012) was used to derive the different land-use classes of non-arable land in Europe, and to assign a range of C-values for each class. Using biophysical attributes such as vegetation-coverage density (derived from remote-sensing datasets of the Copernicus Programme), a C-value was assigned to each pixel based on the combination of land-use class and vegetation density. For arable land, the C-factor was estimated using Eurostat crop statistics and assigning the C-factor values per crop type based on an extensive literature review[25]. In addition, the effect of some management practices on soil loss rates was quantified at the European scale for the first time ever. The calculation of the C-factor of arable land included Eurostat data on soil-tillage practices, management of cover crops and plant residues. Land management practices (reduced/no tillage, management of cover crops and plant residues) decreased the C-factor for Europe by an average of 19.1 % in arable land, with reduced tillage having the largest impact on soil loss rates due to the large areas of application. Data are available for download from the European Soil Data Centre (ESDAC).
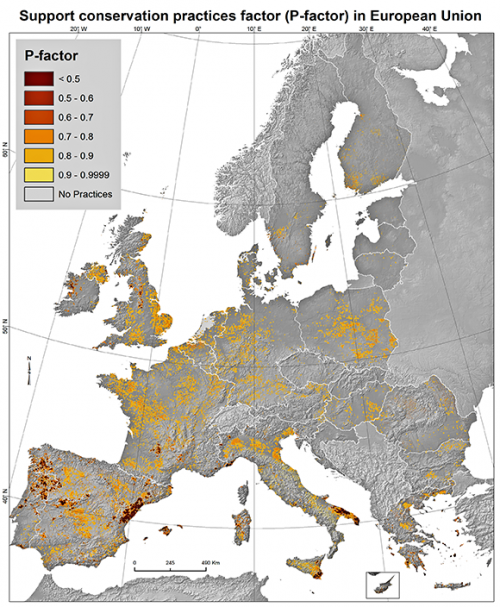
- Support Practices factor (P) (Map 7). The P-factor takes into account the support practices that reduce the erosion potential of runoff by influencing drainage patterns and the concentration and velocity of runoff[26]. The application of more efficient practices for controlling soil loss will result in a reduced P-value. Support practices are rarely taken into account in water-erosion modelling due to a lack of input data. The RUSLE2015 P-factor takes into account the contour farming implemented in EU agro-environmental policies and the protection against soil loss provided by stone walls and grass margins[27]. The P-factor was estimated using the latest developments in the EU’s Common Agricultural Policy (CAP) and applying the rules set for contour farming over a certain slope gradient derived from the Good Agricultural Environmental Condition (GAEC) requirements. The 270 000 field observations of the LUCAS 2012 were used to model the presence and density of stone walls and grass margins[28]. The mean P-value for the EU was estimated at 0.97, while in agricultural lands it was estimated at around 0.95. Data are available for download from the European Soil Data Centre (ESDAC).
A number of issues should be noted:
- The model estimates soil loss caused by raindrop impact, overland flow (or sheet wash) and rill erosion. It does not estimate gully or stream-channel erosion. As a consequence, the risk of soil degradation in areas affected by different erosion phenomena (gully erosion, wind erosion, etc.) are probably underestimated.
- As mentioned previously, the RUSLE2015 model is taking into account the best available high resolution input layers at European scale. The proposed rates are long-term averages. CORINE Land Cover classes (especially the sparse vegetation) ambiguity has increased the uncertainty of the presented model. As a consequence, quantitative assessments using the model should not be undertaken without the right awareness. Moreover, the rainfall erosivity prediction has high uncertainty in North Scandinavia, high Alps and parts of Spain, as well as in Scotland, due to lack of high temporal resolution data.
- There are also great difficulties in gathering enough information to drive an adequate validation of the model results, but this aspect applies to the output from any large area erosion-prediction model. The validation of erosion estimates at continental scale is not technically and financially feasible. One validation option is through the upscaling of local monitoring studies of large-scale modelling assessments.
- The selection of input datasets in the development of this indicator is a crucial process as they have to offer the most homogeneous and complete spatial coverage of the target area.
- The model must also allow the produced information to be harmonized and easily validated.
- In the case of this indicator, verification against the data provided by the Member States through EIONET data collection was applied. Modelled results were compared with the soil erosion maps provided by different countries through the EIONET-SOIL network (Map 10). Most of the maps in this exercise were also calculated using the RUSLE model, using higher resolution datasets or containing less uncertainty. Overall, the results show a high correlation in the pattern of the erosion. The modelled mean loss rates (with RUSLE2015) and spatial patterns are very close to the reported EIONET-SOIL data in Germany, the Netherlands, Bulgaria, Poland and Denmark. The RUSLE2015 soil loss results are slightly higher than those of EIONET-SOIL for Italy, and even higher for agricultural land areas of Austria. The EIONET-SOIL values reported for Belgium are much higher than those of RUSLE2015, especially in the Wallonian forests, while the EIONET-SOIL values reported for Slovakia are lower than those of RUSLE2015.
- The PESERA model tends to estimate generally lower erosion rates than all other approaches due to its sediment module[29], with the exception of overestimating soil erosion in flat areas (Denmark, Po Valley in Italy). On the other hand, rainfall intensity is not included in the soil erosion map of Europe produced by Cerdan et al.[30], which is based on a plot database, leading to lower estimates for soil loss rates in countries with high rainfall erosivity (Italy, Austria).
- The RUSLE2015 is of much improved quality compared to the e-RUSLE[31] as all the individual input layers are based on high resolution pan-European datasets. Moreover, each of the input layers has been reviewed by the scientific community and published in peer review journal and the datasets are publicly available in the European Soil Data Centre (ESDAC): Soil Erodibility[32][33], Rainfall Erosivity[34], Slope Length and Steepness[35], Support Practices[36] and Cover-Management[37]. In RUSLE2015, a participatory approach has been followed as data from national/regional studies have been used for the soil erodibility validation, a network of experts from national meteorological services has been collaborated for the rainfall erosivity and EUROSTAT datasets (employed for the cover-management and support practices) are based on national surveys.
Context
Soil is a valuable, non-renewable resource that offers a multitude of ecosystems goods and services. Soil erosion is the wearing away of the land surface through the action of water and wind, and is exacerbated by tillage and other disturbances (e.g. removal by crop harvesting, dissolution and river bank erosion). At geological time-scales there is a balance between erosion and soil formation[38]. However, in many areas of the world there is an imbalance with respect to soil loss and its subsequent creation, caused principally by anthropogenic activities (mainly as a result of land use change) and climate change.
The Thematic Strategy for Soil Protection recognises soil erosion as a major threat to the soil resources of Europe and is one of three priority areas for policy recommendations. Soil erosion requires immediate attention and irreversible degradation is to be avoided in certain landscapes of Europe. Climate, vegetation cover, land use, topography and soil characteristics as well as conservation practice have a strong impact on soil erosion rates. Soil erosion reduces the ecological functions of soil over time. The main on-site consequences affect the biomass production and crop yields (due to removal of nutrients and reduction in soil filtering capacity).
The Mediterranean area is particularly prone to soil water erosion because of long dry periods followed by heavy bursts of intense precipitations on steep slopes with fragile soils. In some areas, erosion has reached a state of irreversibility with the complete removal of all soil material. Soil erosion in Northern Europe is generally less pronounced because of the lower erosivity of the rain and the higher vegetation cover. However, arable lands in this part of Europe are also susceptible to erosion, especially loamy soils after ploughing[39], as are some areas under natural vegetation.
Given the increasing threat of erosion by the detachment of soil particles by water in Europe, and the implications this has on future food security and water quality, it is important that land managers are provided with accurate and appropriate information on the amount of soil that is actually being lost. It is impractical and technically difficult to measure soil loss across whole landscapes and thus research is urgently needed to improve methods of estimating soil erosion using modelling, upon which mitigation can be implemented.
The soil erosion indicator presented here has been obtained by applying a soil water erosion model. Only soil erosion resulting from rainsplash, overland flow (also known as sheetwash) and rill formation are considered. In most situations, erosion by concentrated flow (rills and gullies) is the main agent of erosion by water. The most effective processes to detach and remove soil by water are:
- Rainfall has the ability to move soil particles directly. This is known as rainsplash erosion. This action is only effective if the rain falls with sufficient intensity. When raindrops hit bare soil, their kinetic energy is able to detach and move soil particles a short distance. Because soil particles can only be moved short distances (few millimetres at the most), its effects are solely on-site. Although considerable quantities of soil may be moved by rainsplash, it is generally all redistributed back over the surface of the soil. On steep slopes, there can be a modest net downslope movement of splashed soil due to the effect of gravity and the gradient of the land. Rainsplash erosion requires high rainfall intensities such as those that accompany convective rainstorms. Rainsplash erosion also weakens the soil surface structure, making it more vulnerable for transport by overland flow.
- Overland flow occurs either when the soil is infiltrated to full capacity and excess water from rain, meltwater or other sources, flows over the land as a sheet. Alternatively, the rainfall rate may be higher than the infiltration rate of the soil. Sheetwash erosion occurs without any well defined channel and can manifest itself across entire slopes. As a consequence, the erosion can affect large areas and move significant amounts of soil.
- Rills occur when overland flow begins to develop preferential flow paths. In turn, these flow paths are eroded further which results in small, well-defined linear concentrations of overland water. In many cases, small rills may disappear over time due to sedimentation. However, persistent micro-rills can develop further to become rills, with a subset eventually becoming gullies.
- Gullies are deeper channels, often resulting from unchecked rill erosion. Due to their size, gullies are capable of moving large amounts of soil, into larger channels such as streams and rivers and thus out of the original site. Gully erosion is not considered in the RUSLE model.
Other forms of erosion (for example, gully erosion and wind erosion) are important and should be considered in the future. In 2014, the Joint Research Centre developed the first qualitative assessments of wind erosion at European level[40].
Policy relevance and context
Soil degradation is a serious challenge. There is no EU soil legislation despite proposals made by the Commission to this effect. However, there is a Thematic strategy for soil protection (Communication COM/2006/0231 final). The Soil Thematic Strategy considers a number of soil degradation processes, including erosion, that should be identified and for which appropriate measures should be put in place to preserve soil functions.
Provisions for soil protection are spread across many different areas, either under environmental protection or other policy areas such as agriculture and rural development. The state of soil influences other climate, environmental and food safety aspects governed at EU level giving an international dimension of the problem. The Common Agricultural Policy (CAP) contributes to preventing and mitigating soil degradation processes. In particular, agri-environment measures (which offer opportunities for favouring the build-up of soil organic matter, the enhancement of soil biodiversity, the reduction of soil erosion, contamination and compaction) and cross-compliance (which can play an important role for soil protection).
The Common Agricultural Policy is the main EU policy through which farmers are supported. In order to get farm support, farmers must comply with “best practice” land use management practices (named cross-compliance). The main component of cross-compliance is the farmer’s obligation to keep his land under Good Agricultural and Environmental Condition (GAEC). This regulation requests the farmers to prevent soil erosion, conserve soil organic carbon and maintain soil structure. An option to assess the effect of GAEC on soil erosion reduction is based on the use of soil erosion risk models.
Agri-environmental context
Soil erosion costs the economy a large amount of money. Soil erosion costs European countries €1.25 billion in annual agricultural productivity loss and €155 million in the gross domestic product (GDP) loss, according to a study by the Joint Research Center[41].
The main consequences of soil erosion are: loss of fertile land due to disrupted nutrient cycles, loss of organic carbon and biodiversity, destruction to infrastructures (roads, dams, water supply networks, railways, etc) due to excessive sediment load, diffuse pollution of surface water, negative effects on aquatic ecosystems and biodiversity, restrictions to land use impeding redevelopment and reducing the area for agricultural, forestry and recreation activities, depreciation of land value, flood risk and transfer of sediments to ports.
On-site effects of water soil erosion (loss of organic matter and nutrients, soil structure degradation, plant uprooting, reduction of available soil moisture, etc.) are particularly important on agricultural areas resulting in a reduction of cultivable soil depth and a decline in soil fertility. The loss of soil productivity following erosion may be significant. Topsoil, which is the most fertile layer of the soil, is the most exposed to erosion; also the mechanisms of soil erosion preferentially remove soil organic matter, clay, and fine silt material. Soil erosion also reduces the volume of soil available for plants roots and degrades soil physical properties (such as water holding capacity). In most cases extra fertilizer can compensate the impacts of soil erosion on soil fertility, but it represents an extra cost for farmers, and does little to offset the physical impacts of erosion on soil productivity. An additional on-site cost which cannot be easily quantified is the impact on tourism due to ecosystem degradation.
Off-site effects of soil water erosion arise from sedimentation, which causes infrastructure burial, changes in watercourses shape and obstruction of drainage networks enhancing the risk of flooding and shortening the life of reservoirs. Many irrigation or hydroelectricity projects have been damaged by soil water erosion. Additional effects of soil erosion can impact the water quality and the recreational activities.
Generally, high intensity agricultural land use leads to higher soil loss by water and wind erosion, especially in potentially high erosion risk areas. However, the reverse could equally be true. For example, an intensive farming system employing soil conservation measures such as terracing and cover crops may result in less soil erosion than a more extensive system that does not involve conservation techniques. Intensive land use can be combined with efficient soil conservation measures.
RUSLE2015 quantifies the impact of management and conservation practices (mainly introduced in GAEC) such as reduced tillage, management of cover crops, plant residues, maintenance of stone walls, contour farming and grass margins. The implementation of GAEC on the agricultural land in Member States reduced soil loss rates[42]. The relatively high frequency of grass margins and the high impact of stone walls in reducing soil loss have contributed with 3 % to overall soil erosion reduction[43]. Cover crops, plant residues and contouring have a limited contribution to soil erosion reduction due to their limited application.
The soil organic carbon (SOC) cycle is affected by erosion, since large quantities of sediments and SOC are moved and re-deposited downhill especially in agricultural areas. RUSLE2015 can potentially improve the scientific knowledge of one component of the global carbon fluxes, which has to date often been neglected in the past due to lack of data. For instance, it is now possible to combine the top soil organic carbon stock estimates in European agricultural land provided by Lugato et al.[44] and the soil erosion estimated by RUSLE2015.
Direct access to
- Agriculture (agr), see:
- Agriculture and environment (aei)
- Estimated soil erosion by water, by erosion level, land cover and NUTS 3 regions (source: JRC) (aei_pr_soiler)
- Agriculture and environment (aei)
- Agriculture, forestry and fishery statistics - 2017 edition
- Agriculture, forestry and fishery statistics - 2018 edition
- Agriculture, forestry and fishery statistics - 2019 edition
- Metadata of estimated soil erosion by water (aei_pr_soiler_esms)
- Commission Communication COM(2006)508 final - Development of agri-environmental indicators for monitoring the integration of environmental concerns into the common agricultural policy
- Commission Staff working document accompanying COM(2006)508 final
- European Commission - Common Agricultural Policy (CAP)
- Joint Research Centre (JRC) - Soil erosion by water (RUSLE2015)
- Joint Research Centre (JRC) - Research topic "Soil"
Notes
- ↑ Huber S., Prokop G., Arrouays D., Banko G., Bispo A., Jones R.J.A., Kibblewhite M.G., Lexer W., Möller A., Rickson R.J., Shishkov T., Stephens M., Toth G., Van den Akker J.J.H., Varallyay G., Verheijen F.G.A., Jones A.R. (eds.): Environmental Assessment of Soil for Monitoring: Volume I Indicators and Criteria. Office for the Official Publication of the European Communities, Luxembourg, 339 pp. EUR 23490 EN/1. (2008)
- ↑ Quinton J.N., Govers G., Van Oost K., Bardgett R.D.: The impact of agricultural soil erosion on biogeochemical cycling. Nature Geoscience, April 2010, 311-314. DOI 10.1038 (2010)
- ↑ Morgan R.P.C.: Soil Erosion and Conservation, 3rd edn. Blackwell Publ., Oxford. (2005)
- ↑ Refers to the following classes from the Corine Land Cover Nomenclature: Agricultural areas, forest and semi natural areas (excluding beaches, dunes, sand plains, bare rock and glaciers and perpetual snow).
- ↑ Refers to the following classes from the Corine Land Cover Nomenclature: Agricultural areas, forest and semi natural areas (excluding beaches, dunes, sand plains, bare rock and glaciers and perpetual snow).
- ↑ Panagos, P., Borrelli, P., Meusburger, K. 2015b. A New European Slope Length and Steepness Factor (LS-Factor) for Modeling Soil Erosion by Water. Geosciences, 5: 117-126
- ↑ I.e. arable land, permanent crops and heterogeneous agricultural areas like agro-forestry areas
- ↑ Renard K.G., Foster G.R., Weesies G.A., McCool D.K., Yoder D.C.: Predicting Soil Erosion by Water: A Guide to Conservation Planning with the Revised Universal Soil Loss Equation (RUSLE). US Dept Agric., Agr. Research Service. Agr. Handbook No. 703 (1997)
- ↑ Panagos, P., Borrelli, P., Poesen, J., Ballabio, C., Lugato, E., Meusburger, K., Montanarella, L., Alewell, .C. 2015. The new assessment of soil loss by water erosion in Europe. Environmental Science & Policy. 54: 438-447
- ↑ Panagos, P., Meusburger, K., Van Liedekerke, M., Alewell, C., Hiederer, R., Montanarella, L. 2014a. Assessing soil erosion in Europe based on data collected through a European Network. Soil Science and Plant Nutrition, 2014. 60 (1):15-29.
- ↑ Wischmeier, W., Smith, D. 1978. Predicting rainfall erosion losses: a Guide to conservation planning. Agricultural Handbook No. 537 U.S. Department of Agriculture, Washington DC, USA.
- ↑ Renard, K.G., et al., 1997. Predicting Soil Erosion by Water: A Guide to Conservation Planning with the Revised Universal Soil Loss Equation (RUSLE) (Agricultural Handbook 703). US Department of Agriculture, Washington, DC, pp. 404.
- ↑ Poesen, J., Nachtergaele, J., Verstraeten, G. and Valentin, C. 2003. Gully erosion and environmental change: importance and research needs. Catena 50(2-4):91-133.
- ↑ Renschler CS, Harbor J. Soil erosion assessment tools from point to regional scales — the role of geomorphologists in land management research and implementation. Geomorphology 2002; 47(2–4):189–209.
- ↑ Kinnell, P.I.A., 2010. Event soil loss, runoff and the Universal Soil Loss Equation family of models: a review. Journal of Hydrology 385: 384–397.
- ↑ Lu H., Prosser I.P., Moran C.J., Gallant J.C., Priestley G., Stevenson J.G. (2003). Predicting sheetwash and rill erosion over the Australian continent. Australian Journal of Soil Research, 41 (6): 1037-1062.
- ↑ Panagos, P., Meusburger, K., Van Liedekerke, M., Alewell, C., Hiederer, R., Montanarella, L. 2014a. Assessing soil erosion in Europe based on data collected through a European Network. Soil Science and Plant Nutrition, 2014. 60 (1):15-29.
- ↑ Wischmeier W.H.: A rainfall erosion index for a universal Soil-Loss Equation. Soil Sci. Soc. Amer. Proc. 23, 246–249. (1959)
- ↑ Panagos, P., Ballabio, C., Borrelli, P., Meusburger, K., Klik, A., Rousseva, S., Tadić, M.P., Michaelides, S., Hrabalíková, M., Olsen, P., Aalto, J., Lakatos, M., Rymszewicz, A., Dumitrescu, A., Beguería, S., Alewell, C., 2015a. Rainfall erosivity in Europe. Sci Total Environ, 2015. 511: 801-814.
- ↑ Rasmussen, C.E. and Williams, C.K.I., 2006. Gaussian Processes for Machine Learning. MIT Press.
- ↑ Renard, K.G., et al., 1997. Predicting Soil Erosion by Water: A Guide to Conservation Planning with the Revised Universal Soil Loss Equation (RUSLE) (Agricultural Handbook 703). US Department of Agriculture, Washington, DC, pp. 404.
- ↑ Poesen J., Torri D., Bunte K.: Effects of rock fragments on soil erosion by water at different spatial scales: a review. Catena 23:141–166. (1994)..
- ↑ Panagos, P., Borrelli, P., Meusburger, K. 2015b. A New European Slope Length and Steepness Factor (LS-Factor) for Modeling Soil Erosion by Water. Geosciences, 5: 117-126
- ↑ Renard, K.G., et al., 1997. Predicting Soil Erosion by Water: A Guide to Conservation Planning with the Revised Universal Soil Loss Equation (RUSLE) (Agricultural Handbook 703). US Department of Agriculture, Washington, DC, pp. 404.
- ↑ Panagos, P., Borrelli, P., Meusburger, C., Alewell, C., Lugato, E., Montanarella, L., 2015d. Estimating the soil erosion cover-management factor at European scale. Land Use policy journal. 48C, 38-50.
- ↑ Renard, K.G., et al., 1997. Predicting Soil Erosion by Water: A Guide to Conservation Planning with the Revised Universal Soil Loss Equation (RUSLE) (Agricultural Handbook 703). US Department of Agriculture, Washington, DC, pp. 404.
- ↑ Panagos, P., Borrelli, P., Meusburger, K., van der Zanden, E.H., Poesen, J., Alewell, C. 2015c. Modelling the effect of support practices (P-factor) on the reduction of soil erosion by water at European Scale. Environmental Science & Policy 51: 23-34.
- ↑ Van Der Zanden E.H., Verburg P.H., Mucher C.A. (2013). Modelling the spatial distribution of linear landscape elements in Europe. Ecological Indicators, 27: 125-136.
- ↑ Panagos, P., Meusburger, K., Van Liedekerke, M., Alewell, C., Hiederer, R., Montanarella, L. 2014a. Assessing soil erosion in Europe based on data collected through a European Network. Soil Science and Plant Nutrition, 2014. 60 (1):15-29.
- ↑ Cerdan O, Govers G, Le Bissonnais Y, et al. 2010: Rates and spatial variations of soil erosion in Europe: a study based on erosion plot data. Geomorphology, 122(1–2), 167–177.
- ↑ Bosco, C., de Rigo, D., Dewitte, O., Poesen, J., and Panagos, P. 2015. Modelling soil erosion at European scale: towards harmonization and reproducibility. Natural Hazards and Earth System Sciences, 15:225–245.
- ↑ Panagos, P., Meusburger, K., Van Liedekerke, M., Alewell, C., Hiederer, R., Montanarella, L. 2014a. Assessing soil erosion in Europe based on data collected through a European Network. Soil Science and Plant Nutrition, 2014. 60 (1):15-29.
- ↑ Panagos, P., Meusburger, K., Ballabio, C., Borrelli, P., Alewell, C. 2014b. Soil erodibility in Europe: A high-resolution dataset based on LUCAS. Science of Total Environment, 2014. 479–480:189–200.
- ↑ Panagos, P., Ballabio, C., Borrelli, P., Meusburger, K., Klik, A., Rousseva, S., Tadić, M.P., Michaelides, S., Hrabalíková, M., Olsen, P., Aalto, J., Lakatos, M., Rymszewicz, A., Dumitrescu, A., Beguería, S., Alewell, C., 2015a. Rainfall erosivity in Europe. Sci Total Environ, 2015. 511: 801-814.
- ↑ Panagos, P., Borrelli, P., Meusburger, K. 2015b. A New European Slope Length and Steepness Factor (LS-Factor) for Modeling Soil Erosion by Water. Geosciences, 5: 117-126
- ↑ Panagos, P., Borrelli, P., Meusburger, K., van der Zanden, E.H., Poesen, J., Alewell, C. 2015c. Modelling the effect of support practices (P-factor) on the reduction of soil erosion by water at European Scale. Environmental Science & Policy 51: 23-34.
- ↑ Panagos, P., Borrelli, P., Meusburger, C., Alewell, C., Lugato, E., Montanarella, L., 2015d. Estimating the soil erosion cover-management factor at European scale. Land Use policy journal. 48C, 38-50.
- ↑ Tricart J. and KiewietdeJonge C. Ecogeography and Rural Management – a Contribution to the International Geosphere-Biosphere Programme. Longman Group, Harlow, UK. 267 pp. (1992)
- ↑ Bielders C., Ramelot C., Persoons E.: Farmer perception of runoff and erosion and extent of flooding in the silt-loam belt of the Belgian Walloon Region'. Environmental Science and Policy 6: 85–83. (2003)
- ↑ Borrelli, P., Ballabio, C., Panagos, P., Montanarella, L. 2014 . Wind erosion susceptibility of European soils Geoderma, 232-234: 471-478.
- ↑ Panagos P. et al 2018. Cost of agricultural productivity loss due to soil erosion in the European Union: From direct cost evaluation approaches to the use of macroeconomic models. Land Degradation and Development Vol 29, pp 471-484.
- ↑ Panagos, P., Borrelli, P., Meusburger, C., Alewell, C., Lugato, E., Montanarella, L., 2015d. Estimating the soil erosion cover-management factor at European scale. Land Use policy journal. 48C, 38-50.
- ↑ Panagos, P., Borrelli, P., Meusburger, K., van der Zanden, E.H., Poesen, J., Alewell, C. 2015c. Modelling the effect of support practices (P-factor) on the reduction of soil erosion by water at European Scale. Environmental Science & Policy 51: 23-34.
- ↑ Lugato, E., Panagos, P., Bampa, F., Jones, A., Montanarella, L. (2014). A new baseline of organic carbon stock in European agricultural soils using a modelling approach. Global Change Biology, 20(1): 313-326.
