Agri-environmental indicator - cropping patterns
Data from January 2023.
Planned update: 26 January 2026 (with data from the FSS 2026).
Highlights
Of the 157.4 million hectares (ha) of land in the EU used for agricultural production in 2020, 98.1 million ha were used as arable land (the equivalent of 62 % of the utilised agricultural area), 48.0 million ha as permanent grassland, 11.1 million ha for permanent crops, with the remainder as kitchen gardens.
The amount of land used in the EU for agricultural production in 2020 was 1.5 million hectares less than in 2010, underpinned by 2.0 million fewer hectares of permanent grasslands and meadow.
This article provides a fact sheet of the European Union (EU) agri-environmental indicator cropping patterns. It consists of an overview of data, complemented by information needed to interpret these data. This article on cropping patterns in the EU is part of a set of similar fact sheets, providing a comprehensive picture of the integration of environmental concerns into the Common Agricultural Policy (CAP).
Full article
Analysis of cropping patterns at EU level
Cropping patterns in 2020: Arable land occupied the largest part of UAA
The area used for agricultural production, known as the total utilised agricultural area (UAA), was 157.4 million hectares in 2020 across the EU as a whole. This was 1.5 million hectares less than in 2010.
Among the main types of farming land cover, arable land accounted for a majority of utilised agricultural area (62.3 % in 2020 - see Figure 1), covering 98.1 million hectares. Permanent grassland and meadow covered a further 48.0 million hectares, permanent crops (from orchards, groves and vines for example) covered 11.1 million hectares, and kitchen gardens 0.2 million hectares.
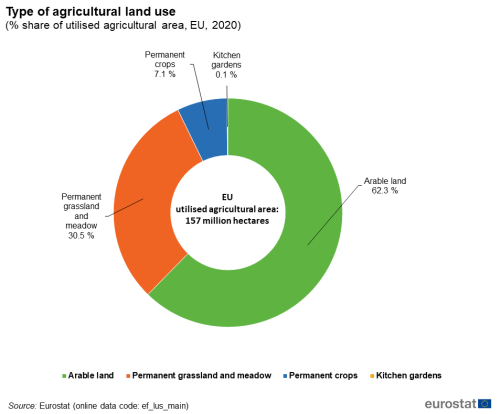
(% share of utilised agricultural area, EU, 2020)
Source: Eurostat (ef_lus_main)
Trend in cropping patterns towards less permanent grassland and more permanent crops
Between 2010 and 2020, the area of arable land in the EU remained steady (a small increase of 0.1 million hectares). The overall fall in utilised agricultural area was principally due to 2.0 million fewer hectares of permanent grassland, although there was also a fall of 0.1 million hectares in the area of kitchen gardens (which represented a sharp fall of 41.4 % in this type of land use). By contrast, there was a notable increase of 0.5 million in the land used for permanent crops.
Analysis of cropping patterns at country level
Largest shares of EU agricultural land are in France and Spain
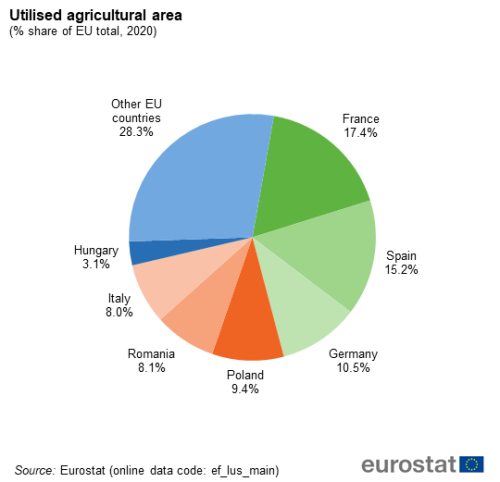
Two-thirds (68.6 %) of the EU's UAA in 2020 was farmed across six countries: France (27.4 million hectares, the equivalent of 17.4 % of the EU total), Spain (23.9 million hectares or 15.2 %), Germany (16.6 million hectares, or 10.5 %), Poland (14.8 million hectares, or 9.4 %), Romania (12.8 million hectares, or 8.1 %) and Italy (12.5 million hectares, or 8.0 %). No other EU country had more than 5.0 million hectares of UAA.
France had more hectares of arable land and permanent grassland than other EU countries, Spain more hectares of permanent crops
France had 17.0 million hectares of arable land in 2020, the equivalent of 17.4% of the EU's total arable land. Spain and Germany both had 11.7 million hectares of arable land and Poland 11.1 million hectares. These four EU countries accounted for just over one half (52.6%) of the EU's arable area.
France also had 9.3 million hectares of permanent grassland in 2020, the equivalent of 19.4% of the EU's total permanent grassland area. Spain had 7.5 million hectares of permanent grassland, Germany 4.7 million hectares, and Romania and Ireland both had 3.7 million hectares. These five EU countries accounted for about 60% of the EU total area of permanent grasslands.
Spain had 4.7 million hectares of permanent crops in 2020, the equivalent of 41.8% of the EU total. Italy had 2.2 million hectares of permanent crops and France 1.0 million hectares. Together, these three EU countries accounted for about 70% of the EU's permanent crops area.
UAA in Finland and Denmark dominated by arable land and in Ireland by permanent grasslands and meadow
How much land countries dedicate to arable land, permanent grassland and permanent crops varies considerably and can be influenced, among other things, by climatic, topographic and agronomic factors. In 2020, eight EU countries used three-quarters or more of their respective UAA as arable land, with the highest values recorded for Finland and Denmark (98.9 % and 90.2 % of the UAA respectively). The lowest share of arable land (24.6 % of the UAA) was observed in Ireland (see Figure 3).
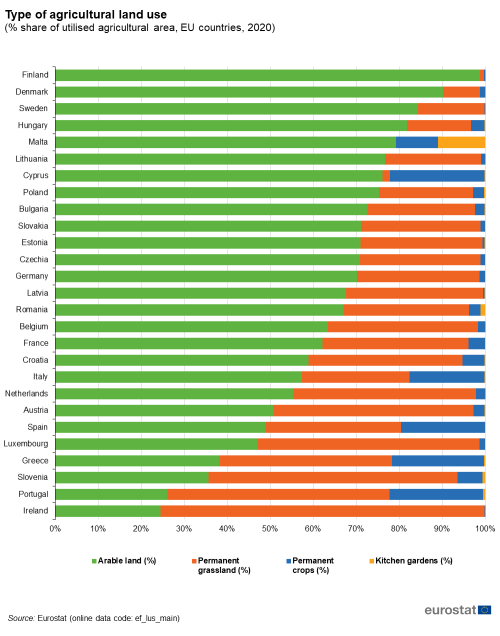
(% share of utilised agricultural area, EU countries, 2020)
Source: Eurostat (ef_lus_main)
By contrast, several Member States with low shares of arable land reported high shares of permanent grasslands and meadow. By far the highest share was observed in Ireland (75.4 %). Other countries where permanent grasslands and meadow covered more than half of the UAA included Slovenia (57.8 %), Portugal (51.7 %) and Luxembourg (51.6 %). In Ireland, Slovenia and Luxembourg, these high shares are reflected in the relatively high share of cattle in the livestock population; see AEI 10.2 - Livestock patterns for more on this. Less than 2 % of the UAA was occupied by permanent grassland and meadow in Malta, Finland and Cyprus.
Mediterranean countries tended to have higher proportions of UAA as permanent crops; at the top end, the shares ranged from 17.4 % of UAA in Italy, to 22.0 % in Cyprus, with Spain, Greece and Portugal in between. The share of permanent crops in UAA was less than 2 % in twelve EU countries.
Malta was the only country that reported a significant share of UAA devoted to kitchen gardens (10.9 %). No other EU country had a share above 1 % of UAA as kitchen gardens.
In focus: arable land and fodder areas
Arable land - the main plant-based food producing areas
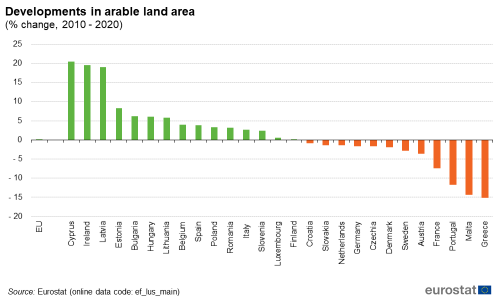
For the EU as a whole, the area covered by arable land was almost identical in 2020 to that in 2010 (+0.1 % to 98.1 million hectares). However, there were considerable changes at the level of individual EU countries (see Figure 4). There were three countries in which the area of arable land increased sharply; these were Cyprus (+20.5 %), Ireland (+19.6 % from a relatively low level) and Latvia (+19.0 %). In Lithuania, Hungary and Estonia the respective areas of arable land increased in a more moderate range of +5.8 % to +8.3 % respectively between 2010 and 2020. By contrast, the sharpest rates of decline in arable land were in France (-7.3 %, a reduction of 1.3 million hectares), Portugal (-11.6 %), Malta (-14.3 %) and Greece (-15.0 %).
Cereals occupied just over one half (53.7 %) of the arable land in the EU in 2020, with fodder crops about one fifth (20.5 %) and industrial crops and other crops together accounting for a further one quarter (see Figure 5).
Cereals also accounted for a majority of arable land in 16 EU countries in 2020, the highest shares being in Poland (67.0 %), Romania (62.6 ) and Lithuania (62.1 %), as well as the highest minority shares in a further four. Malta did not report any area cultivated with cereals and fodder crops dominated (67.5 % of its arable land). Fodder crops also accounted for a majority of arable land in Ireland (72.1 %), Cyprus (50.7 %) and Luxembourg (50.1 %), and also represented the highest share in Portugal (46.4 %) and Sweden (45.3 %). Only in the Netherlands did 'other crops' such as flowers and ornamental plants account for the highest share (41.3 %).
Industrial crops occupied just under one third (30.8 %) of the arable land in Bulgaria in 2020, the highest share among EU countries. The next highest share was in Hungary (24.3 %), with shares between 20-23% also being recorded for Romania, Croatia, Slovakia and Greece.
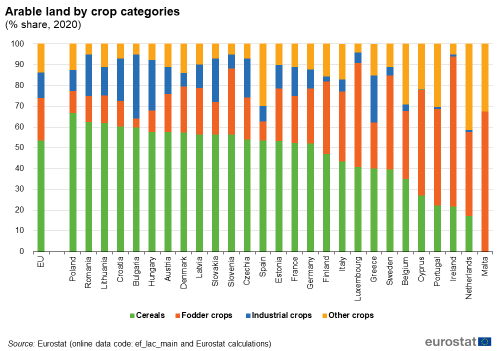
(% share, 2020)
Source: Eurostat (ef_lus_main) and Eurostat calculations
Fodder area - the basis for animal production
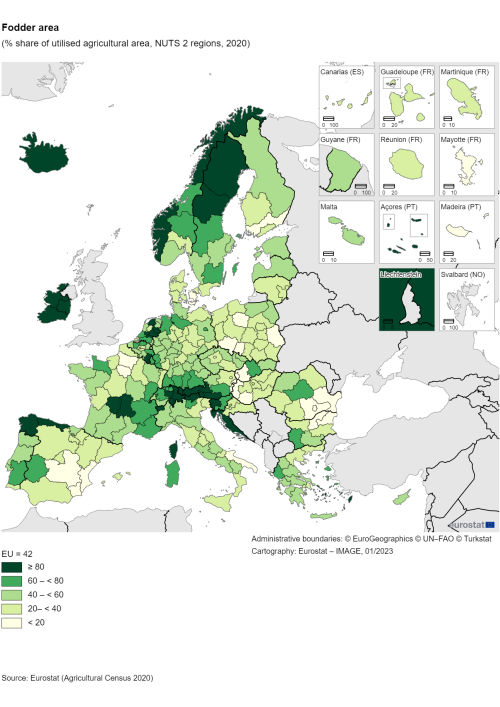
The share of fodder area (fodder crops, grass and permanent grassland and meadows) in UAA provides an indication of specialisation towards livestock farming. (For more specific information on this, see the agri-environmental indicators "Livestock patterns" and "Specialisation".) In 2020, the fodder area covered 42.2 % of the UAA in the EU.
Among EU countries, the highest shares of fodder area in UAA were found in Ireland (93.3 %), Luxembourg (75.2 %) and Slovenia (69.3 %). By contrast, the lowest shares of fodder area in UAA were in Hungary (22.0 %), Bulgaria (26.7 %), Poland and Denmark (both 27.3 %).
The NUTS 2 regions with particularly high shares of fodder area (more than 95 %) were mostly found in mountainous regions: Vorarlberg, Salzburg and Tirol in Austria; Valle d'Aosta in Italy; the Northern and Western region of Ireland; Cantabria in Spain; and the Região Autónoma dos Açores in Portugal. The exception was Utrecht in the Netherlands.
Several of the regions with low shares of fodder area were found around capital cities (e.g. Paris, Bucharest, Copenhagen, Prague and Vienna). The regions with the lowest shares were the Región de Murcia (2.4 %) in Spain, Bucuresti-Ilfov (6.1 %) in Romania and the French regions of Mayotte (6.5 %) and Île de France (6.6 %).
Source data for tables and graphs
Data sources
Indicator definition
Cropping patterns are defined as trends in the share of the utilised agricultural area (UAA) occupied by the main agricultural land cover types (arable land, permanent grassland and land under permanent crops), and they are measured by the following indicators:
Main indicator
- Share (%) of main agricultural land cover types (arable land, permanent grassland and land under permanent crops) in total UAA.
Supporting indicator
- Areas (in hectares) occupied by arable crops, permanent grassland and permanent crops.
Links with other indicators
This indicator has links to a number of other AEI indicators that describe developments in some of the main contributory factors.
Data used
Cropping patterns are described on the basis of data from the Farm Structure Survey (FSS). The FSS is carried out by all EU Member States; it is conducted consistently throughout the EU with a common methodology at a regular base and therefore provides comparable and representative statistics on livestock and land use across countries and time, at regional levels (down to NUTS 3 level). Every three or four years the FSS is carried out as a sample survey, and once in ten years as a census. The unit underlying the FSS is the agricultural holding, a technical-economic unit under single management engaged in agricultural production. Until 2007, the FSS covered all agricultural holdings with a UAA of at least one hectare (ha) and those holdings with a UAA of less than one hectare if their market production exceeded certain natural thresholds. From 2008 onwards, the thresholds for agricultural holdings changed to cover a range of physical thresholds. This has an impact on the comparability of data across time. More information about the thresholds can be found in the background article Farm structure survey – survey coverage.
Data on on agricultural land cover are also available from crop statistics. Crop statistics are collected annually, consistently throughout the EU with a common methodology. They provide comparable and representative statistics on land cover across countries and time, at national level. Data on land use from this data source might differ from data collected by FSS, due to differences in data collection methods and populations.
Methodology
The utilised agricultural area (UAA) is the total area taken up by arable land (including temporary grassland and fallow land), permanent grassland, permanent crops and kitchen gardens. It should be noted that common land is included in FSS in some countries. This has an impact on the comparability of data on land use. More information on this can be found in the background article on Farm Structure Survey – common land.
Arable land in agricultural statistics is land worked (ploughed or tilled) regularly, generally under a system of crop rotation.
Permanent grassland is land used permanently (for several consecutive years) to grow herbaceous forage crops and not included in the crop rotation scheme on the agricultural holding. Permanent grassland can be used for grazing by livestock or mown for hay, silage (stocking in a silo) or used for renewable energy production.
Permanent crops are ligneous crops, meaning trees or shrubs, not grown in rotation, but occupying the soil and yielding harvests for several (usually more than five) consecutive years. Permanent crops mainly consist of fruit and berry trees, bushes, vines and olive trees. Permanent crops are usually intended for human consumption and generally yield a higher added value per hectare than annual crops. They also play an important role in shaping the rural landscape (through orchards, vineyards and olive tree plantations) and helping to balance agriculture within the environment.
Fodder area includes arable fodder crops and grass: fodder roots and brassicas, forage plants (including temporary grass, green maize, leguminous plants) and permanent grassland and meadows. Grazing livestock mainly feed on fodder area.
Context
Cropping patterns provide insights into the relationship between the environment and farming systems and developments within a certain region/territory. In the EU, agricultural areas are mostly used for growing arable crops (such as cereals, fodder crops, industrial crops), permanent crops (like fruit and berry plantations, olive trees, vineyards), and permanent grasslands. The latter (when extensively managed) are generally considered as the most important agricultural area from a nature conservation perspective, providing habitats for many wild plants and animal species. From a climate change perspective, permanent grasslands are important to keep unploughed since they are significant carbon sinks.
Policy relevance
There are many non-agronomic drivers affecting cropping patterns such as sectoral policies, climate change, market prices, etc. The Common Agricultural Policy (CAP) is one of the main EU policies influencing cropping patterns, but regionally or nationally, energy and climate policies can have more influence on cropping patterns than the CAP.
The CAP consists of different policy instruments with different influences on the cropping patterns. Support is available for the maintenance or introduction of practices that are beneficial for the environment and climate; some are mandatory and some voluntary.
Some CAP instruments which directly target cropping patterns are voluntary agri-environmental climate measures[1], support to organic farming and to areas with natural constraints (ANC)[2].
Among EU policies that could influence cropping patterns, the legislation on water protection such as the Water Framework Directive and the Nitrates Directive should be noted, laying down obligations to e.g. grow catch crops in specific areas at particular times of the year. Legislation underpinning the Natura 2000 network of protected areas (the Birds Directive and the Habitats Directive) limit human activities to ensure that the sites are managed in a sustainable manner, both ecologically and economically. Therefore agriculture can continue on these sites but with restrictions that are likely influencing cropping patterns.
Changes in cropping patterns also have an impact on greenhouse gas (GHG) emissions. The EU is signatory to the Kyoto Protocol, setting targets for reducing GHG emissions.
In 2018 new legislation on the inclusion of GHG emissions and removals from land use, land use change and forestry (LULUCF) was adopted (Regulation (EU) 2018/841), in line with the Paris Agreement. This will lead to better estimates of the emissions.
Agri-environmental context
Cropping patterns are strongly linked to the way natural resources (soil, water, air, biodiversity) are managed and impacted by management practices. Many of the current land cover/use patterns have developed over centuries and still shape agricultural landscapes today. The agricultural practices and specialisations differ depending on the local conditions such as water availability, temperature and soil quality, but also policies, traditions and economic situation of the farmers are factors influencing the choices in farming. Cropping patterns can be related to land use intensity, although with the present level of data detail available, the intensity is not well captured. A certain land use (e.g. fodder) or crop can have very different impacts on the environment depending on local characteristics and management intensity. Cereal crops, for example, are often managed very intensively, e.g. in the Paris basin or parts of the United Kingdom and Germany. On the other hand, cereals are also the key crop in one of the most important arable farming systems of High Nature Value in Europe, those of the cereal steppes in the Iberian Peninsula[3] . Similarly, intensively managed pastures along the North Sea coast are very different in terms of habitat value from extensively grazed permanent grassland in the Scottish uplands or the alpine region. Therefore cropping patterns can give an indication of the changes in land use intensity, and therefore on the environmental impacts, when linked to farm management information.
In general, agriculture is more sustainable when dominance of one or a few crops (mono-cropping) is avoided, since this can be associated with a reduction of the supply of eco-system services.[4][5][6] Mosaic landscapes often have high landscape and biodiversity values. Crop diversification can increase resilience of agricultural systems[7] and support beneficial insects providing biological control, thus reducing the dependence on insecticides[8] .Adopting crop rotations leads to positive environmental impacts and at the same time global improvement of soil productivity in the long term, which increases yields[9].
Permanent grassland has high recognition, due to the substantial role it plays in landscape and nature conservation [10][11][12]. Semi-natural grasslands are among the areas with the richest biodiversity in the EU (e.g. wooded meadows of Estonia). However, in the most intensive permanent pastures farmers re-seed with selectively bred cultivars of grass and other fodder species, and may use mineral fertilisers and herbicides. This allows farmers to achieve high yields, but with little associated biodiversity value. There are negative impacts on climate change of this type of intensive grassland, when compared to more extensive permanent grassland. The CAP has introduced a definition of permanent grasslands that are environmentally sensitive; Member States designated these areas, including permanent grassland in carbon-rich soils and wetlands, and farmers shall not convert or plough them.
Direct access to
- Cross-cutting topics, see:
- Agri-environmental indicators
- Share of main land types in utilised agricultural area (UAA) by NUTS 2 regions (tai05)
- Agriculture (agr), see:
- Farm structure (ef)
- Farm land use by NUTS 2 regions (ef_landuse)
- Main farm land use by NUTS 2 regions (ef_lus_main)
- Arable crops farms by NUTS 2 regions (ef_lac)
- Main crops by NUTS 2 regions (ef_lac_main)
- Farm land use by NUTS 2 regions (ef_landuse)
- General and regional statistics
- Regional statistics by NUTS classification (reg)
- Regional agriculture statistics (reg_agr)
- Structure of agricultural holdings (reg_ef)
- Structure of agricultural holdings 2010 (reg_ef_2010)
- Farm land use - Permanent crops, other farmland, irrigation (reg_ef_po)
- Land use: number of farms and areas of different crops by agricultural size of farm (UAA) and NUTS 2 regions (ef_oluaareg)
- Farm land use - Permanent crops, other farmland, irrigation (reg_ef_po)
- Structure of agricultural holdings 2010 (reg_ef_2010)
- Structure of agricultural holdings (reg_ef)
- Regional agriculture statistics (reg_agr)
- Agriculture, forestry and fishery statistics - 2018 edition
- Structure of agricultural holdings (ef_esms)
- Data used: Agriculture (agr), see:
- Farm structure (ef)
- Farm land use by NUTS 2 regions (ef_landuse)
- Main farm land use by NUTS 2 regions (ef_lus_main)
- Arable crops farms by NUTS 2 regions (ef_lac)
- Main crops by NUTS 2 regions (ef_lac_main)
- Farm land use by NUTS 2 regions (ef_landuse)
- Commission Communication COM(2006)508 final - Development of agri-environmental indicators for monitoring the integration of environmental concerns into the common agricultural policy
- Commission Staff working document accompanying COM(2006)508 final
- European Commission
- DG Agriculture and Rural Development
Notes
- ↑ These are practices, undertaken voluntarily by farmers, over a set period. Support may be provided through Rural Development programmes. The practices bring environmental benefits and /or help to mitigate and adapt to climate change.
- ↑ These are areas where agricultural production is identified of facing natural constraints and challenges. These areas can be identified as "mountain areas", due to the presence of slopes or altitude, or areas where the so called "biophysical" constraints have been identified, or areas where agricultural production faces other types of specific constraints but the areas should be maintained for the reasons of environmental protection or improvement, maintenance of the countryside, preserving tourist potential or protection of the coastline.
- ↑ Beaufoy, G., D. Baldock and J. Clark, (1994). The Nature of Farming: Low intensity farming systems in nine European countries. London, Institute for European Environmental Policy. 66
- ↑ Grab, H., Danforth, B., Poveda, K., & Loeb, G. (2018). Landscape simplification reduces classical biological control and crop yield. Ecological Applications, 28(2), 348-355
- ↑ Connelly, H., Poveda, K., & Loeb, G. (2015). Landscape simplification decreases wild bee pollination services to strawberry. Agriculture, Ecosystems and Environment, 211, 51-56
- ↑ Dainese, M., Isaac, N. J. B., Powney, G. D., Bommarco, R., Öckinger, E., Kuussaari, M., Pöyry J., Tim G. Benton T. G., Gabriel D., Hodgson J. A., Kunin W. A., Lindborg R., Sait S. M., Marini, L. (2017). Landscape simplification weakens the association between terrestrial producer and consumer diversity in Europe. Global Change Biology, 23(8), 3040-3051
- ↑ Lin, B. B. (2011). Resilience in agriculture through crop diversification: Adaptive management for environmental change. Bioscience, 61(3), 183-193.
- ↑ Redlich, S., Martin, E. A., & Steffan-Dewenter, I. (2018). Landscape-level crop diversity benefits biological pest control. Journal of Applied Ecology, 55(5), 2419-2428.
- ↑ Mudgal S., Lavelle P., Cachia F., Somogyi D., Majewski E., Fontaine L., Bechini L., Debaeke P. (2010) Environmental impacts of different crop rotations in the European Union, Final Report for the European Commission (DG Environment)
- ↑ Osterman, O. P. (1998) The need for management of nature conservation sites under Natura 2000. Journal of Applied Ecology 35: 968-973
- ↑ Bignal, E.M., D.I. McCracken (2000). The nature conservation value of European traditional farming systems. Environmental Reviews 8: 149-171
- ↑ Beaufoy et al., 1994. Beaufoy, G., D. Baldock and J. Clark, (1994). The Nature of Farming: Low intensity farming systems in nine European countries. London, Institute for European Environmental Policy. 66
