Accidents at work statistics
Data extracted in October 2023.
Planned update: October 2024.
Highlights
There were 3 347 fatal accidents at work in the EU during 2021, a decrease of 11 deaths compared with the year before.
In 2021, more than a fifth (22.5 %) of all fatal accidents at work in the EU took place within the construction sector.
In 2021, almost three quarters of all accidents at work in the EU caused wounds and superficial injuries, dislocations, sprains and strains, or concussions and internal injuries.
Fatal accidents at work, 2021
This article presents a set of main statistical findings in relation to indicators concerning non-fatal and fatal accidents at work in the European Union (EU); the statistics presented have been collected as part of the European statistics on accidents at work (ESAW) administrative data collection exercise.
An accident at work is defined in ESAW methodology as a discrete occurrence during the course of work which leads to physical or mental harm. Fatal accidents at work are those that lead to the death of the victim within one year of the accident taking place. Non-fatal accidents at work are defined as those that cause at least four full calendar days of absence from work (they are sometimes also called ‘serious accidents at work’). Non-fatal accidents at work may result in a considerable number of working days being lost and often involve considerable harm for the workers concerned and their families. They have the potential to force people, for example, to live with a permanent disability, to leave the labour market, or to change job.
Full article
Number of accidents
In 2021, there were 2.88 million non-fatal accidents that resulted in at least four calendar days of absence from work and 3 347 fatal accidents in the EU (see Table 1), a ratio of approximately 860 non-fatal accidents for every fatal accident.
There was an increase between 2020 and 2021 in the total number of non-fatal accidents at work in the EU, some 150 941 more (equivalent to an increase of 5.5 %). This may, at least in part, be attributed to a return to the workplace as restrictions associated with the COVID-19 crisis were relaxed/removed. There were 11 fewer fatal accidents at work in the EU during 2021 when compared with the year before (equivalent to a decrease of 0.3 %).
Men were considerably more likely than women to have an accident at work. In 2021, more than two out of every three (68.3 %) non-fatal accidents at work in the EU involved men. Factors that influence these statistics are: the proportion of men and women who are in employment; the different types of work that men and women carry out; the activities in which they work. For example, there are far more accidents in the mining, and manufacturing or construction sectors, which tend to be male-dominated. It is generally the case that men tend to work on a full-time basis, whereas women are more likely to work on a part-time basis; as such, women spend a shorter period of time (on average) in the workplace and this may also decrease their likelihood of having an accident. Between 2020 and 2021, the number of non-fatal accidents at work in the EU that involved men increased 151 872, while there was a modest decrease (1 357) in the number of non-fatal accidents that involved women.
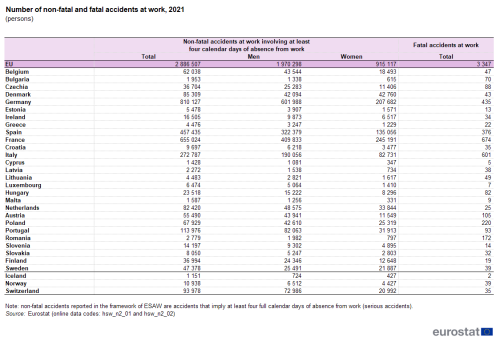
(persons)
Source: Eurostat (hsw_n2_01) and (hsw_n2_02)
Incidence rates
An alternative way to analyse the information on accidents at work is to express the number of accidents in relation to the number of persons employed; this produces a ratio referred to as the incidence rate. In Figures 1 and 2, simple incidence rates are shown relating the number of accidents to the overall number of persons employed. For any given country, these statistics give an indication of the likelihood that an employed person had an accident.
In 2021, the number of fatal accidents per 100 000 employed persons ranged from less than 1.00 in the Netherlands, Greece, Finland, Sweden and Germany to more than 3.00 fatal accidents per 100 000 persons employed in Romania, France, Malta, Lithuania and Latvia (see Figure 1). The highest incidence rates among the EU Member States were recorded in the Baltic Member States of Lithuania and Latvia, with 3.75 and 4.29 fatal accidents per 100 000 persons employed, respectively.
Across the whole of the EU, there were 1.76 fatal accidents per 100 000 persons employed in 2021. Fatal accidents at work were therefore relatively rare events and so the number of fatal accidents (and their incidence rates) can vary greatly from one year to the next.
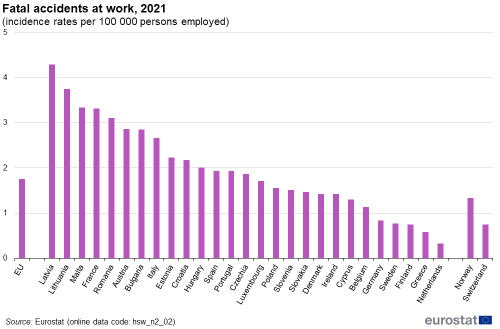
(incidence rates per 100 000 persons employed)
Source: Eurostat (hsw_n2_02)
Across the EU, there were 1 516 non-fatal accidents per 100 000 persons employed in 2021. The range for incidence rates among the EU Member States was from less than 100 non-fatal accidents per 100 000 persons employed in Romania and Bulgaria to more than 2 500 per 100 000 persons employed in Denmark and France (see Figure 2). Particularly low incidence rates for non-fatal accidents may reflect an under-reporting problem linked to: poorly-established reporting systems, little financial incentive for victims to report, non-binding legal obligations for the employers, and so on. In the same way, well-established reporting/recognition systems may often explain the high incidence rate in some countries. While the phenomenon of low non-fatal incidence rates can in part be considered to reflect under-reporting the situation for incidence rates of fatal accidents is different as it is much more difficult to avoid reporting a fatal accident.
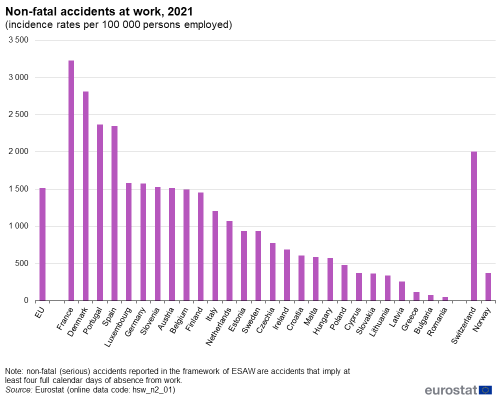
(incidence rates per 100 000 persons employed)
Source: Eurostat (hsw_n2_01)
Standardised incidence rates
When comparing data between countries, incidence rates can be difficult to interpret, for example, when comparing the effectiveness of measures to prevent accidents at work. This is because the likelihood of having an accident is, among other factors, related to the economic activity in which a person works and the relative importance (weight) of different activities varies between countries according to the structure of each domestic economy.
To account for this, standardised incidence rates are calculated and data for these are shown in Figures 3 and 4. Such rates assume that the relative sizes of economic activities within each national economy are the same as within the EU as a whole. As such, these standardised incidence rates give a more neutral comparison of the health and safety situation in different countries. Note that these standardised incidence rates have a slightly narrower activity coverage than the simple incidence rates, as they exclude the mining and quarrying sector as well as some service activities. Standardised incidence rates only cover NACE Sections A and C–N, thus excluding Sections B and O–U.
On this basis and across the EU, there were, on average, 2.23 fatal accidents per 100 000 persons employed in 2021 (see Figure 3), while there were 1 624 non-fatal accidents per 100 000 persons employed (see Figure 4). In 2021, the highest standardised incidence of fatal accidents at work was recorded in Lithuania (5.45 deaths per 100 000 persons employed), followed by Malta (4.98 deaths per 100 000 persons employed), Latvia (4.73 deaths per 100 000 persons employed) and France (4.45 deaths per 100 000 persons employed). At the other end of the range, Sweden, Greece, Germany, Finland and the Netherlands recorded the lowest standardised incidence rates among the EU Member States with fewer than 1.2 fatal accidents per 100 000 persons employed in 2021.
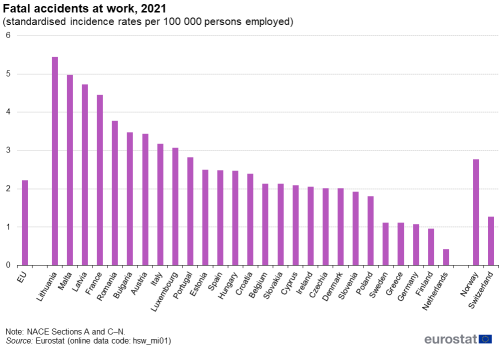
(standardised incidence rates per 100 000 persons employed)
Source: Eurostat (hsw_mi01)
Figure 4 shows that the standardised incidence rate of non-fatal accidents at work in 2021 was generally highest in some of the EU Member States with insurance-based accident reporting systems: France reported 3 364 non-fatal accidents per 100 000 persons employed, followed by Portugal and Spain with rates of 3 039 and 2 657 per 100 000 persons employed, respectively. Insurance-based accident reporting systems offer a significant financial compensation for the victim when an accident is reported, as opposed to legal obligation systems in which victims are covered by the general social security system. Among the eastern or Baltic EU Member States, which mostly have legal obligation systems, Slovenia and Estonia were the only Member States to report an incidence rate of more than 1 000 non-fatal accidents per 100 000 persons employed, with rates of 1 376 and 1 085 per 100 000 persons employed, respectively. By far the lowest standardised incidence rates were reported in Bulgaria and Romania, at 81 and 52 non-fatal work accidents per 100 000 persons employed, respectively; again, it should be noted that these values may reflect a relatively high degree of under-reporting.
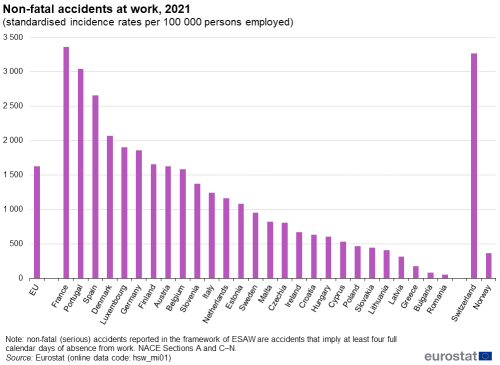
(standardised incidence rates per 100 000 persons employed)
Source: Eurostat (hsw_mi01)
Analysis by activity
As noted above, one of the main reasons why the incidence of accidents may be higher for men (than for women) is related to the economic activities where they are more likely to work. Indeed, the number of accidents at work varies greatly depending upon the economic activity in question (see Figure 5) and is positively skewed in relation to male-dominated activities.
Within the EU, the construction, transportation and storage, manufacturing, and agriculture, forestry and fishing sectors together accounted for around two thirds (65.5 %) of all fatal accidents at work in 2021 and close to half (45.7 %) of all non-fatal accidents at work. More than one fifth (22.5 %) of all fatal accidents at work in the EU took place within the construction sector, while transportation and storage (16.7 %) had the next highest share. Manufacturing (14.7 %) and agriculture, forestry and fishing (11.6 %) were the only other NACE sections for which double-digit shares of the total number of fatal accidents were recorded.
Non-fatal accidents were relatively common within manufacturing (19.2 % of the total in the EU in 2021), human health and social work activities (13.5 %), construction (12.9 %), and distributive trades (12.5 %); these four sections were the only NACE sections for which double-digit shares of the total number of non-fatal accidents were recorded.
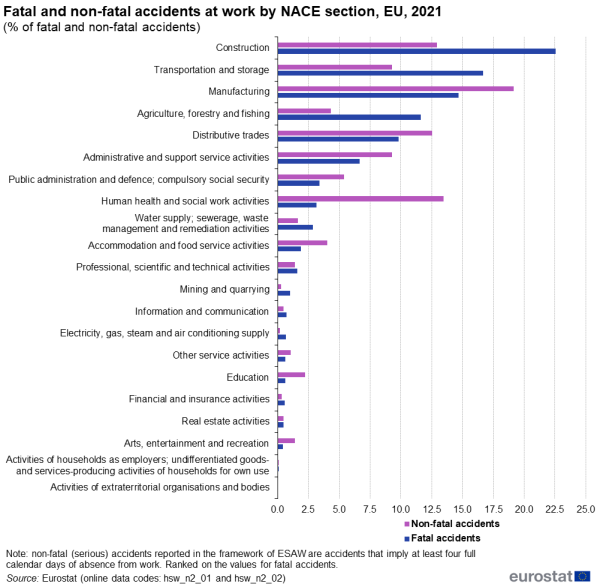
(% of fatal and non-fatal accidents)
Source: Eurostat (hsw_n2_01) and (hsw_n2_02)
Analysis by type of injury
Figure 6 presents an analysis of data according to the type of injury sustained when people were involved in accidents. In the EU, there were two types of particularly common injuries in 2021, namely, wounds and superficial injuries (28.0 % of the total) and dislocations, sprains and strains (26.0 %). These were followed by two other relatively common types, namely concussion and internal injuries (19.5 %) and bone fractures (11.0 %). None of the other types of injuries accounted for a double-digit share of the total number of accidents in the EU, with the next highest shares for shocks (3.8 %) and for poisonings and infections (3.6 %).
Note that the data collected in the context of ESAW also include an analysis of which body parts were injured in accidents (such as the head, neck, back, torso and organs, arms and hands, legs and feet) as well as information on the causes and circumstances of accidents.
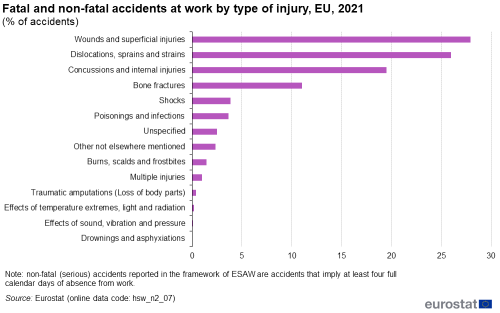
(% of accidents)
Source: Eurostat (hsw_n2_07)
Source data for tables and graphs
Data sources
In December 2008, the European Parliament and the Council adopted Regulation (EC) No 1338/2008 on Community statistics on public health and health and safety at work. The Regulation is designed to ensure that health statistics provide adequate information for all EU Member States to monitor Community actions in the field of public health and health and safety at work. In April 2011, a European Commission Regulation (EU) No 349/2011 on statistics on accidents at work was adopted specifying in detail the variables, breakdowns and metadata that EU Member States are required to deliver – this legislation is being implemented in a number of phases. Note also that a Commission Decision No 2011/231/EU from April 2011 granted derogations to certain EU Member States with respect to the transmission of statistics on accidents at work.
European statistics on accidents at work (ESAW) is the main data source for EU statistics relating to health and safety at work issues. ESAW includes data on occupational accidents that result in at least four calendar days of absence from work, including fatal accidents. The phrase ‘during the course of work’ means while engaged in an occupational activity or during the time spent at work. This generally includes cases of road traffic accidents in the course of work but excludes accidents during the journey between home and the workplace.
The statistics presented for accidents at work refer to declarations made either to public (social security administrations) or private insurance schemes, or to other relevant national authorities (for example, those controlling labour or workplace inspections). Indicators on accidents at work may be presented as absolute values, as percentage distributions, as incidence rates in relation to every 100 000 persons employed (the denominator being provided by the authorities in the EU Member States that are responsible for ESAW data collection or by the EU’s labour force survey (LFS)) or as standardised incidence rates.
The data generally relate to all economic activities, unless otherwise specified. For example, the analyses in Figures 3 and 4 cover NACE Sections A and C to N. Because the frequency of accidents at work varies between NACE activities – high risk activities include agriculture, forestry and fishing, manufacturing, construction, distributive trades, and transportation and storage – a standardisation procedure is performed to facilitate the comparison of national data. A direct standardisation method is used with weights calculated for the European reference population: the weights represent the proportion of the reference (working) population in each NACE activity. National incidence rates are calculated for each NACE activity and these are combined using the fixed set of EU weights to produce an overall standardised incidence rate for the Member State concerned. More details are available in a methodological note.
Statistics on accidents at work may reflect under-coverage or under-reporting. Under-coverage exists when the relevant population is not covered by the data source for accidents, for example when a certain economic sector or employment type is excluded. Under-reporting relates to the situation where an accident occurs but is not reported although the related economic sector is included. The extent of under-coverage of ESAW data can be analysed partially by comparing the reference population (of workers) in ESAW with data derived from the LFS. Under-reporting is more difficult to analyse and establish but some comparisons are available. One method is to compare results from the reporting systems used for the legal obligation to report an accident with systems based on insurance reports; this may indicate under-reporting in the system for the legal obligation of accidents or over-reporting in insurance systems. Another method is to compare (geographically or over time) the ratio of fatal to non-fatal accidents, as the reporting of fatal accidents is thought to be more likely to be accurate due to their severe nature. Comparisons can also be made with data from household surveys, for example from the LFS (which includes periodic modules on accidents at work and work-related health problems).
In addition, changes in the way data are collected and processed in the EU Member States may have an influence on the number and incidence of accidents at work in a particular year. For example, on 30 June 2016 a number of derogations from provisions in the EU regulation governing ESAW ended for several of the Member States. This had a significant effect on the data concerning accidents at work for reference year 2014. For example, for the first time French data included full coverage of all employees in economic sectors covered by NACE Sections A–S. This led to a substantial apparent increase in the number of accidents recorded in France (compared with 2013). In a similar vein, the 2014 data for Belgium included information pertaining to accidents in the public sector for the first time and this also resulted in an increase in the reported number of accidents. In 2016, some correction factors were removed from Greek data by the national statistical authority due to methodological issues which caused a very considerable decrease in the number of accidents reported for reference year 2014 (compared with 2013); it is expected that a more complete Greek dataset will be received in the coming years and that this is likely to lead to a higher number of reported accidents. Finally, Dutch and Norwegian data (the latter are not included in the EU total) for the 2014 reference year for non-fatal accidents displayed a significant decrease due to methodological issues.
Context
A safe, healthy working environment is a crucial factor in an individual’s quality of life and is also a collective concern. Governments in the EU Member States recognise the social and economic benefits of better health and safety at work. Reliable, comparable, up-to-date statistical information is vital for setting policy objectives and adopting suitable policy measures and preventative actions.
The Treaty on the Functioning of the European Union (Article 153) states that ‘[...] the Union shall support and complement the activities of the Member States in the following fields: (a) improvement in particular of the working environment to protect workers’ health and safety; [...]’.
The main principles governing the protection of workers’ health and safety are laid down in a 1989 framework Directive (89/391/EEC), the basic objective of which is to encourage improvements in occupational health and safety. All sectors of activity, both public and private, are covered by this legislation, which establishes the principle that the employer has a duty to ensure workers’ health and safety in all aspects relating to work, while the worker has an obligation to follow the employer’s health and safety instructions and report potential dangers.
Within this field, the European Commission’s policy agenda for the period 2021–2027 was set out in the Communication EU strategic framework on health and safety at work 2021–2027 (COM(2021) 323 final). This aims to ensure that the EU continues to play a leading role in the promotion of high standards for working conditions within the EU as well as further afield. The communication outlined three major challenges:
- anticipating and managing change in the new world of work brought about by the green, digital and demographic transitions;
- improving prevention of workplace accidents and illnesses;
- increasing preparedness for any potential future health crises.
The COVID-19 pandemic highlighted the crucial importance of health policy, including health and safety at work. The European Commission is working towards providing strategic policy orientations that aim to contribute to the improvement of the health and safety of workers across the EU. This is particularly important with respect to a new set of risks, such as those resulting from new ways of working, new technologies and digitalisation, or the impact of pandemics and associated containment measures, alongside more traditional risks of accidents at work, such as exposure to dangerous substances.
At the beginning of the COVID-19 pandemic, preventive measures were put in place with the aim of limiting the spread of the Coronavirus and to combat the pandemic. Among these, some economic activities were either completely stopped or restricted by many governments or employers. In some cases, working remotely or from home became more common. This had a direct impact on all economic sectors. For the economic sectors where activity was stopped or reduced, the number of accidents decreased. Inactivity or reduced activity in certain sectors resulted in a lower number of workers and/or hours worked, and therefore showed an unusually large decrease in reported accidents at work. In contrast, in some sectors the COVID-19 pandemic generated an increase in the activity. For example, this was the case for human health activities, residential care activities or social work activities without accommodation. These activities were generally characterised by higher numbers of reported accidents at work during the pandemic, especially when COVID-19 cases of occupational origin were included (following national practices and legislation).
Public services that deal with receipt of notifications as well as the reporting, investigation and recognition of accidents at work may have functioned with limited capacities during parts of the crisis.
The combined impact of the issues described above led to an overall decrease in the reported number of accidents at work for reference year 2020, while there was a partial rebound across most EU Member States and many economic activities during 2021.
Direct access to
- Health, see:
- Health and safety at work (hsw)
- Accidents at work (ESAW, 2008 onwards) (hsw_acc_work)
- Main indicators (hsw_mi)
- Details by NACE Rev. 2 activity (2008 onwards) (hsw_n2)
- Causes and circumstances of accidents at work (ESAW phase III) (hsw_ph3)
- Accidents at work (ESAW) - until 2007 (hsw_acc7_work)
- Accidents at work and other work-related health problems (source LFS) (hsw_apex)
- Work related health problems and accidental injuries - LFS 1999 (hsw_inj_pb)
- Occupational diseases (from 2013 onwards; source: EODS) (hsw_occ)
- Accidents at work (ESAW, 2008 onwards) (hsw_acc_work)
ESMS metadata files
- Accidents at work (ESAW, 2008 onwards) (ESMS metadata file – hsw_acc_work_esms)
Publication
- European Agency for Safety and Health at Work
- European Commission – Employment, Social Affairs and Inclusion – Health and safety at work
- European Commission – Employment, Social Affairs and Inclusion – Health and safety at work – EU strategic framework (2021–2027)
- European Foundation for the Improvement of Living and Working Conditions (EUROFOUND) – Health and well-being at work
- International Labour Organisation (ILO) – Safety and health at work