

CHAPTER 10
PRICE AND VOLUME MEASURES
10.01
In a system of economic accounts, all the flows and stocks are expressed in monetary units. The monetary unit is the only common
denominator which can be used to value the extremely diverse transactions recorded in the accounts and to derive meaningful balancing items.
The problem when using the monetary unit as a measuring unit is that this unit is neither a stable nor an international standard. A major
concern in economic analysis is to measure economic growth in volume terms between different periods. It is then necessary to distinguish, in the value
changes for certain economic aggregates, the changes arising solely from price changes from the remainder which is called the change in 'volume'.
Economic analysis is also concerned with comparisons in space, i.e. between different national economies. These focus on international
comparisons in volume terms of the level of
production
and income, but the level of prices is also of interest. It is therefore necessary to factor the differences in value of economic aggregates between pairs
or groups of countries into components, which reflect the differences in volume and the differences in price.
10.02
When time comparisons of flows and stocks are concerned, equal importance is to be attached to the accurate measurement of changes in
prices and in volumes. In the short term, observation of price changes is of no less interest than the measurement of the volume of supply and demand. On a
longer-term basis, the study of economic growth has to take account of movements in the relative prices of the different types of goods
and services.
The primary objective is not simply to provide comprehensive measures of changes in prices and volumes for the main aggregates of the
system but to assemble a set of interdependent measures which make it possible to carry out systematic and detailed analyses of inflation and economic
growth and fluctuations.
10.03
The general rule for comparisons in space is that accurate measures must be made for both the volume and the price components of the
economic aggregates. As the spread between the Laspeyres and Paasche formulae often is significant in spatial comparisons, the Fisher index formula is the
only acceptable one for this purpose.
10.04
Economic accounts have the advantage of providing a suitable framework for constructing a system of volume and price indices as well as
ensuring the consistency of the statistical data. The advantages of an accounting approach can be summarised as follows.
- On a conceptual level, the use of an accounting framework covering the entire economic system requires the prices and physical units for the different products and flows in the system to be specified consistently. In a framework of this type, the price and volume concepts for a given group of products are defined identically in both resources and uses.
- On a statistical level, the use of the economic accounts framework imposes accounting constraints which must be respected at both current prices and in volume terms and will normally require some adjustments to be made to ensure consistency of the price and volume data.
- Furthermore, the creation of an integrated system of price and volume indices in the context of a system of economic accounts provides the national accountant with extra checks. Assuming the existence of a balanced system of supply and use tables at current prices, the construction of such balanced tables in volume terms means that a system of implicit price indices can be automatically derived. Examination of the plausibility of these derived indices can lead to revision and correction of the data in volume terms and even, in some cases, of the values at current prices.
- The accounting approach permits the measurement of price and volume changes for certain balancing items in the accounts, the latter being derived by definition from the other elements in the accounts.
10.05
Despite the advantages of an integrated system based on the balance, both overall and by industry, of transactions in goods and
services, it has to be acknowledged that the price and volume indices thus obtained do not meet all needs or answer all possible questions on the subject of
change in prices or volume. Accounting constraints and the choice of price and volume index formulae, although essential for the construction of a coherent
system, can sometimes be a hindrance. There is also a need for information for shorter periods such as months or quarters. In such cases, other forms of
price and volume indices may prove useful.
SCOPE OF PRICE AND VOLUME INDICES IN THE NATIONAL ACCOUNTS
10.06
Amongst the flows, which appear in economic accounts at current prices, there are some, mainly concerning
products, where the distinction between changes in price and volume is similar to that made at microeconomic level. For many other flows in the system, the
distinction is far less obvious.
Where the flows in the accounts cover a group of elementary transactions in goods and services, the value of each being equivalent to the
product of a number of physical units and their respective unit price, it is sufficient to know the breakdown of the flow into its components in order to
determine changes in price and volume over time.
Where a flow comprises a number of transactions relating to distribution and financial intermediation as well as to balancing items such
as
value added, it is difficult or even impossible to separate directly current values into price and volume components, and special solutions have to be adopted.
There is also a need to measure the real purchasing power of a number of aggregates, such as
compensation of employees, disposable income of
households
or national income. This can be done, for example, by deflating them by means of an index of the prices of the goods and services which can be bought with
them.
10.07
The objective and the procedure followed when measuring the real purchasing power of income estimates are different from those followed
when deflating goods and services and balancing items. For flows of goods and services an integrated system of price and volume indices can be established,
which provides a consistent framework for measuring economic growth. The valuation in real terms of flows of income uses price indices which are not
strictly linked to the income flow. So the choice of price for income growth can differ according to the objectives of the analysis: there is no unique
price identified in the integrated system of price and volume indices.
The integrated system of price and volume indices
10.08
The systematic division of changes in current values into the components 'changes in price' and 'changes in volume' is restricted to
flows representing transactions, recorded in the goods and services accounts and in the supporting supply and use framework. It is carried out both for the
data relating to individual
industries
and
products, and for those relating to the total economy. Flows which are balancing items, such as current added, cannot be directly factored into price and volume
components; this can only be done indirectly using the relevant flows of transactions.
- the balance of the goods and services account must for any sequence of two years be obtained at both current prices and in volume terms;
- each flow at the level of the total economy must be equal to the sum of the corresponding flows for the various industries.
Table 1.1
|
Transactions in products |
|
|---|---|
| Output | P.1 |
| Market Output | P.11 |
| Output for own final use | P.12 |
| Non-market output | P.13 |
| Intermediate consumption | P.2 |
| Final consumption expenditure | P.3 |
| Individual final consumption expenditure | P.31 |
| Collective final consumption expenditure | P.32 |
| Actual final consumption | P.4 |
| Actual final individual consumption | P.41 |
| Actual final collective consumption | P.42 |
| Gross capital formation | P.5 |
| Gross fixed capital formation | P.51 |
| Changes in inventories | P.52 |
| Acquisition less disposals of valuables | P.53 |
| Export of goods and services | P.6 |
| Export of goods | P.61 |
| Export of services | P.62 |
| Import of goods and services | P.7 |
| Import of goods | P.71 |
| Import of services | P.72 |
| Taxes and subsidies on products | |
| Taxes on products, excluding VAT | D.212 and D.214 |
| Subsidies on products | D.31 |
| VAT on products | D.211 |
| Balancing items | |
| Value added | B.1 |
| Gross domestic product | B.1*g |
Other price and volume indices
10.10
In addition to the price and volume measures considered above, the following aggregates can also be subdivided into their own price and
volume components. The objectives for these measures vary.
Inventories at the beginning and at the end respectively of each period may have to be calculated in volume terms in order to have the
balance sheet aggregates. The stock of produced fixed
assets
has to be calculated in volume terms to estimate capital output ratios, as well as to obtain a basis for estimating
consumption of fixed capital
in volume terms.
Compensation of employees
can be calculated in volume terms for purposes of measuring productivity and in some instances also when
outputs
have been estimated by using data in volume terms on inputs. Consumption of fixed capital, other taxes on production and other subsidies on production must
also be estimated in volume terms when calculating costs in volume terms.
10.11
Compensation of employees
is an element of income. For the purpose of measuring purchasing power, it can be valued in real terms by deflating with an index reflecting the prices of
products purchased by employees. Other income elements too, such as disposable income of households and national income, can be measured in real terms in
the same general way.
General principles of measuring price and volume indices
[]
See P&V measures paragraph 1.3
See P&V measures paragraph 1.3
Definition of prices and volumes of market products
[]
See P&V measures paragraph 3.1.1
See P&V measures paragraph 3.1.1
10.12
Volume and price indices can only be derived for variables that have price and quantity elements. The notions of price and quantity are closely linked to
that of homogeneous products, i.e. products for which it is possible to define units which are all considered equivalent and which can thus be exchanged for
the same monetary value. It is thus possible to define the price of a homogeneous product as the amount of money for which each product unit can be
exchanged.
For each homogeneous product flow, e.g.
output, it is thus possible to define a price (p), a quantity (q) corresponding to the number of units and a value (v) defined by the equation:
v = p x q
Quality, price and homogeneous products
[]
See P&V measures paragraph 2.4.1
See P&V measures paragraph 2.4.1
10.13 Another way of defining a homogeneous product is to say that it consists of units of the same quality.
Homogeneous
products
play an essential role in national accounts. Indeed,
output
is valued at
basic prices
determined by the market at the time when it takes place, i.e. very often before sale. The units produced have therefore to be valued, not at the price at
which they will actually be sold, but at the price at which equivalent units are sold at the time of
production
of the units concerned. This is possible in a rigorous way only for homogeneous products.
10.14
In practice, however, two units of a product with identical physical characteristics may be sold at different prices for two types of
reasons.
- Two units with identical physical characteristics can be considered as not being equivalent if they are sold in different places, at different periods or according to different conditions. In this case, the units have to be regarded as corresponding to different homogeneous products.
- Two units with identical physical characteristics can be sold at different prices, either due to lack of information, or to restrictions brought to purchase freedom, or to the existence of parallel markets. In this case, the units have to be regarded as belonging to the same homogeneous product.
10.15
Lack of information means that purchasers may not always be properly informed about existing price differences and may therefore
inadvertently buy at higher prices. This, or the opposite, may occur also in situations where individual buyers and sellers negotiate or bargain over the
price. On the other hand, the difference between the average price of a good purchased in a market or a bazaar, where such bargaining often occurs, and the
price of the same good sold in a different type of retail outlet, such as a department store, should normally be treated as reflecting differences in
quality due to different sales conditions.
10.16
Price discrimination
[]
implies that sellers may be in a position to charge different prices to different categories of purchasers for identical goods and services sold under
exactly the same circumstances. In such cases, there is no or limited freedom of choice on the part of a purchaser belonging to a special category. The
principle adopted is that variations in price are to be regarded as price discrimination when different prices are charged for identical units sold under
exactly the same circumstances in a clearly separable market, i.e. when different prices are charged for the same homogeneous product. Price variations due
to such discrimination do not constitute differences in volume.
See P&V measures paragraph 2.1.4
The possibility of the retrading of goods in a given market implies that price discrimination for those types of
products
in most cases can be assumed to be insignificant. The price differences that may exist for goods can normally be interpreted as due to lack of information
or to the existence of parallel markets.
In service industries, e.g. in transportation, producers may charge lower prices to groups of individuals with typically lower incomes,
such as pensioners or students. If such individuals are free to travel at whatever time they choose, this must be treated as price discrimination. However,
if they are charged lower fares on condition that they travel only at certain times, typically off-peak times, they are being offered lower-quality
transportation since transportation with conditions and transportation without conditions can be considered as different homogeneous products.
10.17
Parallel markets may exist for several reasons. Buyers may be unable to buy as much as they would like at a lower price because there is
insufficient supply available at that price, and a secondary, parallel market, where higher prices are quoted, may exist. There is also the possibility that
a parallel market exists, where sellers can charge lower prices because they can avoid certain taxes.
10.18
Thus, if quality is defined by all the characteristics common to all units of a homogeneous product, differences in quality are
reflected by the following factors:
- physical characteristics;
- deliveries in different locations;
- deliveries at different times of the day or at different periods of the year;
- differences in conditions of sale or the circumstances or environment in which goods or services are supplied.
Prices and volume
[]
See P&V measures paragraph 2.2.2
See P&V measures paragraph 2.2.2
10.19
The introduction of the notion of volume in national accounts rests on the desire to eliminate the effect of price variation in the
pattern of values expressed in monetary units, and it thus appears as an extended use of the notion of quantity for groups of
products. In fact, for a given homogeneous product the equation v = p x q allows the change of a value over time to be broken down into change of price and change
of quantity. In practice, however, there are too many homogeneous products to be dealt with individually, with the result that national accountants have to
work at a more aggregated level. At this aggregated level, however, the equation v = p x q is no longer useful since, while it is possible to aggregate
values, it is not meaningful to aggregate quantities in order to derive prices.
10.20
There is however a simple way of breaking down the change in the value of a set of homogeneous products between two periods, one of which is considered the
base period and the other the current period. The effect of change in price can be offset by calculating what the value of the set of products would have
been if there had been no change in prices, i.e. by applying the prices of the base period to the quantities of the current period. This value at prices of
the base period defines the notion of volume.


In this way, the value of a set of products in the current period may be written as:
Where exponent 1 refers to the current period and index i to a specific homogeneous product. The volume of the set of products for the current period is
thus defined in relation to the base period by the formula:
Where exponent 0 refers to the base period. By comparing the volume of the set of products for the current period and their overall value for the base
period it is possible to measure a change which is not affected by any price variation. A volume index can thus be calculated by the formula:
The volume index which is thus defined is a Laspeyres index of quantities in which each basic index is weighted by the proportion of the basic product in
the overall value of the base period.
Once the notion of volume has been defined, it is possible to define by analogy with the equation v = p x q not a price but a price index. The price index
is thus defined by the ratio between the value for the current period and the volume, i.e. by the formula:
This index is a Paasche price index in which each base price index is weighted by the proportion of the base product in the overall value for the current
period.
The volume and price indices defined in this way prove the equation:
Value index = price index x volume index
This equation is a more general version of the equation v = p x q and it allows any change in the value of a set of products to be broken down into a change
in volume and a change in price.
In the calculation of the volume, quantities are weighted up by prices of the base period, so that the result depends on the price structure. Changes in
price structure are likely to be less important for short periods than for long periods. Therefore, the calculation of the volume is made only for two
successive years, i.e. the volume is calculated at the prices of the previous year.
For comparisons over longer periods of time, the Laspeyres volume indices and the Paasche price indices are calculated first in relation to the previous
year and then the chain indices are determined.
10.21
The main advantages of using Paasche price indices and Laspeyres volume indices are the interpretation and calculation simplicity and
the additivity property in the supply and use balances.
10.22
Chained indices present the drawback that they lead to volumes having no additivity so that they cannot be used in the balancing
procedures of
products
based on supply and use tables.
10.23
The non-additive volume data calculated with chain indices are to be published without any adjustment. This method is transparent and
indicates to users the extent of the problem. This does not preclude the possibility that there may be circumstances in which compilers may judge it
preferable to eliminate the discrepancies in order to improve the overall consistency of the data. When reference year values are extrapolated by chain
volume indices, an explanation has to be provided to users concerning the absence of additivity in the tables.
10.24
In practice, since it is impossible to measure prices and quantities for all the homogeneous products of an economy, volume or price
indices are calculated using samples of representative homogeneous products, the underlying idea being that the volumes or prices of products not included
in the sample change in the same way as the sample average. It is therefore necessary to use a product classification which is as detailed as practicable so
that each product identified has maximum homogeneity, regardless of the level of detail used in the presentation of results.
10.25
In view of the equation linking the value, price and volume indices, only two indices need to be calculated. Usually, the value index is
obtained directly by simply comparing the overall values for the current and base periods. It is then a matter of choosing between a price index and a
volume index to be calculated. In most cases the assumption of parallel change which underlies the method is proven more by prices than by volumes because
the prices of different products are often significantly influenced by certain common factors such as the cost of raw materials and wages. In this case, the
price index is to be calculated using a sample of products of constant quality over time, with quality being determined not only by the physical
characteristics of the product but also by the conditions of sale, as explained above. In this way all the variations in the overall value caused by
structural changes among the various products will appear as variations in volume and not in price.
New products
[]
See P&V measures paragraph 2.4.1
See P&V measures paragraph 2.4.1
10.26
The method of calculating price and volume indices outlined above assumes that the products exist in both successive years. In actual
fact, however, many products appear and disappear from one year to the next and the price and volume indices need to reflect this. Where volume is defined
using the prices of the previous year, there is no particular difficulty in the case of products which existed in the previous year but which no longer
exist in the current year, since they are simply linked to a zero quantity for the current year. The problem is more complicated in the case of new
products, since for the previous year it is not possible to measure the price of a product which does not exist.
There are two types of approaches in such a case for estimating the price for the previous year: the first supposes that the price of the
new product changes like the price of similar products, while the second attempts to calculate directly what the price of the new product would have been if
it had existed in the base period. The first approach amounts simply to using a price index calculated on the basis of a sample of homogeneous products
existing in both successive years, and in practice this is the method used for most new products since new products are generally too numerous to be
explicitly specified, especially when the definition of homogeneous products is strictly applied. With the second approach, the methods which are most
commonly used are the hedonic method which consists of determining the price of a product on the basis of its main characteristics and the input method
which uses the cost of a product to calculate its price.
10.27
For transactions in services it is frequently more difficult to specify the characteristics which determine the physical units, and
differences of opinion may arise concerning the criteria to be used. This difficulty may concern important industries such as financial intermediation
services, wholesale and retail trade, services to enterprises, education, research and development, health or recreation. The choice of physical units for
such activities is presented in
Handbook on price and volume measures in national accounts
[1]
.
Principles for non-market services
[]
See P&V measures paragraph 3.1.2
See P&V measures paragraph 3.1.2
10.28
The establishment of a comprehensive system of price and volume indices covering all supply and uses of goods and services involves a
particular difficulty when measuring the
output
of non-market services. Such services differ from market services in that they are not sold at a market price and their value at current prices is
calculated as the sum of the costs incurred. Those costs are:
intermediate consumption,
compensation of employees, other taxes less subsidies on production and
consumption of fixed capital.
10.29
In the absence of a unit market price, the unit cost of a non-market service can be considered as the equivalent to the price. In fact,
the price of a market product corresponds to the expenditure which the purchaser must incur in order to take possession of it, while the unit cost of a
non-market service corresponds to the expenditure which society must incur in order to make use of it. Thus, where it is possible to define units of
quantity for non-market services, it is also possible to apply the general principles for calculating volume and price indices which are outlined
above.
10.30 It is difficult, however, to define units of quantity for collective non-market services, such as services in connection with
general government, justice or defence. In this case, therefore, other methods need to be used by analogy with the general method. This method defines volume on the basis of
prices of the previous year, i.e. it defines volume as the expenditure which purchasers would have incurred if prices had not changed. This latter definition
may be used when it is not possible to define a unit of quantity provided that it is applied, not to a unit of product, but to the expenditure as a whole.
Since the value of a non-market service is determined by the costs involved, it is thus possible to calculate the volume by the value of the costs at base
period prices, i.e. by the value at base period prices of
intermediate consumption,
compensation of employees, other taxes net of production subsidies and
consumption of fixed capital. This method is known as the input method. The calculation in volume terms of the compensation of employees, consumption of fixed capital, taxes and
subsidies on production is covered in the paragraphs which follow.
Even in the most favourable case of non-market services consumed on an individual basis, such as those of education and health, it is not
always easy to distinguish homogeneous
products. Indeed, the characteristics of such services are seldom defined in a sufficiently precise way for it to be possible to determine with certainty whether
two different service units can be considered as being equivalent, i.e. if they have to be regarded as correspondent with one same homogeneous product or
with two separate products. Two equivalence criteria can be retained by the national accountants.
- The unit cost criterion: two units of non-market services being considered equivalent if they have the same unit cost. This criterion is based on the idea that, collectively, those who benefit from public services are also those who decide and pay for them. For example, citizens decide on public services via their representatives and pay for them by their taxes. Under such conditions, citizens cannot be expected to pay different prices for service units that they consider equivalent. Thus, according to this criterion, two service units of different cost have to be regarded as corresponding to different products, and a non-market homogeneous product is characterised by the unicity of its unit cost.
- The outcome criterion: two units of non-market services being considered equivalent if they give the same outcome. This criterion is based on the idea that two service units considered by citizens to be equivalent can however be produced at different costs because citizens do not check completely the production process of the services. The unit cost criterion is no longer then relevant and has to be replaced by a criterion corresponding to the usefulness of the non-market services for society.
The principal difficulty of implementation of such methods is related to the definition and the measurement of outcome. Indeed, measuring
outcome presupposes having defined objectives, which is not so simple in the field of non-market services. For example, what are the objectives of the
public health service: improving the state of public health or extending lifetime? Certainly the two, but then how are various objectives weighed up when
they are not equivalent? For example, what is the best treatment, that which makes it possible to live an additional year in good health or that which makes
it possible to live two additional years in bad health? In addition, outcome estimates are often controversial, hence, in numerous countries, the
controversies on improvement or deterioration of pupils' school performance are recurrent.
In the European Union, given the conceptual difficulties and the absence of consensus on
output
methods adjusted for quality (based on outcome), such methods are excluded from the central framework in order to preserve the comparability of the results.
Such methods are reserved on an optional basis for supplementary tables, while continuing research. Thus, in the field of non-market health and education,
the estimates of
production
and of consumption in volume terms have to be calculated on the basis of direct output measures - not adjusted for quality - by weighing up the
quantities produced by the previous year unit costs of those services, without applying any correction to them in order to take account of quality. Such
methods have to be applied to a sufficient level of detail, the minimum level being defined by Eurostat's
Handbook on price and volume measures in national accounts.
Although the use of input-based methods is generally to be avoided, it is possible, in the field of health, to apply the input method
when the variety of the services is such that it is practically impossible to determine homogeneous products. In addition, explanatory information has to
accompany the national accounts estimates that draw users' attention to the methods of measurement.
Principles for value added and GDP
[]
See P&V measures paragraph 3.4
See P&V measures paragraph 3.4
10.31
Value added, the balancing item in the production account, is the only balancing item to form part of the integrated system of price and volume indices. The very
special characteristics of this item must, however, be emphasised, as must the significance of its related volume and price indices.
10.32
Definition: value added in volume terms is defined as the difference between output in volume terms and intermediate consumption in volume terms.
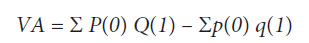
where P and Q are prices and quantities for output and p and q are prices and quantities for
intermediate consumption. The theoretically correct method to calculate value added in volume terms is by double deflation, i.e. deflating separately the two flows of the
production account (output and intermediate consumption) and calculating the balance of those two revalued flows.
10.33
In some cases, where the statistical data remain incomplete or insufficiently reliable, it may be necessary to use a single indicator.
If there are good data on current added at current prices, one alternative to double deflation is to deflate current
value added
directly by a price index for
output. This implies the assumption that prices for
intermediate consumption
change at the same rate as for output. Another possible procedure is to extrapolate current added in the base year by a volume index for output. This volume
index can be calculated either directly from quantity data or by deflating the current value of output by an appropriate price index. This method in fact
assumes that the volume changes are the same for intermediate consumption.
For certain market and non-market service industries, such as finance, business services or defence, it may not be possible to obtain
satisfactory estimates of price or volume changes for output. In such cases the movements of current added in volume terms can be estimated by means of
changes in
compensation of employees
at wage rates of the previous year and
consumption of fixed capital
in volume terms. Compilers of data may be forced to adopt such expedients, even when there is no good reason to assume that labour productivity remains
unchanged in the short or long term.
10.34
By their very nature, therefore, the indices of volume and price for
value added
are different from the corresponding indices for the flows of goods and services.
The same applies to price and volume indices of aggregate balancing items such as gross domestic product. The value of the latter is
equivalent to the sum of all the values added of all
industries, i.e. to an addition of balancing items, plus taxes less
subsidies on products
and from another point of view can be seen to represent the balancing item between total final uses and imports.
SPECIFIC PROBLEMS IN THE APPLICATION OF THE PRINCIPLES
10.35
Although essentially limited to transactions involving goods and services, the integrated system of price and volume indices does not
exclude the possibility of calculating measures of changes in price and volume for certain other transactions.
Taxes and subsidies on products and imports
[]
See P&V measures paragraph 3.10
See P&V measures paragraph 3.10
10.36
The possibility mentioned above exists, in particular, in the case of taxes and subsidies directly linked to the quantity or value of
the goods and services which are the subject of certain transactions. In the supply and use tables, the values of those taxes and subsidies are shown
explicitly. By applying the rules described below, it is possible to obtain price and volume measures for the categories of taxes and subsidies which are
recorded in the goods and services accounts, namely:
- taxes on products, excluding VAT (D.212 and D.214);
- subsidies on products (D.31);
- VAT on products (D.211).
10.37
The simplest case is that of taxes which represent a fixed amount per unit of quantity of the product which is the subject of the
transaction. The value of the revenue from such a tax depends upon:
- the quantity of products involved in the transaction;
- the amount levied per unit, i.e. the taxation price.
10.38
A more frequent case is that in which the tax represents a certain percentage of the value of the transaction. The value of the revenue
from such a tax then depends upon:
- the quantity of products involved in the transaction;
- the price of the products involved in the transaction;
- the tax rate (as a percentage).
10.39
The amount of taxes on products, excluding VAT (D.212 and D.214) is measured in terms of volume by applying to the quantities of
products produced or imported the taxation prices of the base year or by applying to the value of
output
or imports, revalued at the prices of the base year, the tax rates of the base year. Attention has to be paid to the fact that taxation prices may differ
among different uses. This is taken into account in the supply and use tables.
10.40
Similarly, the amount of
subsidies on products (D.31) is measured in terms of volume by applying to the quantities of products produced or imported the subsidy prices of the base-year or by applying to
the value of
output
or imports, revalued at the prices of the base-year, the rates of subsidy of the base-year, taking into account different subsidy prices for different
uses.
10.41
VAT on products (D.211) is, both for the whole economy and for individual industries and other users, calculated on a net basis and
refers only to non-deductible VAT. This is defined as the difference between VAT invoiced on the products and VAT deductible by the users of these products.
Alternatively, it is also possible to define VAT on products as the sum of all non-deductible amounts which have to be paid by users.
Non-deductible VAT in volume terms can be calculated by applying the VAT rates in force in the previous year to the flows expressed in
the prices of the previous year. Any change in the rate of VAT for the current year will therefore be reflected in the price index and not in the volume
index of non-deductible VAT.
- either because of a change in the right to deduct VAT, resulting from a change in tax laws or regulations, taking effect with or without a time lag;
- or because of changes in the pattern of uses of the product (e.g. increase in the proportion of uses on which VAT may be deducted).
Other taxes and subsidies on production
[]
See P&V measures paragraph 3.11.1
See P&V measures paragraph 3.11.1
10.42
The treatment of other taxes (D.29) and subsidies (D.39) on production raises a particular difficulty, to the extent that, by
definition, it is not possible to assign them directly to units which are produced. In the case of non-market services, this difficulty is compounded by the
fact that they are used only when it is not possible to define units of quantity. However, it is generally possible to get around this difficulty by
defining other taxes and subsidies on production in volume terms, by the amount to which they would have risen if there had been no change in the tax rules
and prices as a whole in relation to the previous year. For example, taxes on property or the use of an
asset
can be evaluated in volume terms by applying to the current period the rules and the price of assets of the previous year.
Consumption of fixed capital
[]
See P&V measures paragraph 3.11.3
See P&V measures paragraph 3.11.3
10.43
The calculation of volume measures of the
consumption of fixed capital
poses few problems when good data on the composition of the stock of fixed capital goods are available. The perpetual inventory method, used by most
countries, already implies, for the estimation of the consumption of fixed capital at current prices, the need to firstly carry out a calculation of the
stock of fixed capital goods in volume terms. To go from a valuation at historic cost to one at replacement cost, it is necessary firstly to value capital
goods acquired over a number of different periods on a homogeneous basis, i.e. base-year prices. The price and volume indices derived in the process can
therefore be used to calculate the value of the consumption of fixed capital in volume terms and the associated price index.
Where there is no perpetual inventory of the stock of fixed capital goods, the change in the consumption of fixed capital in volume terms
can be obtained by deflating the current price data by price indices derived from data on
gross fixed capital formation
by product. Account has then to be taken of the age structure of the capital goods acquired.
Compensation of employees
[]
See P&V measures paragraph 3.11.2
See P&V measures paragraph 3.11.2
10.44
For the purpose of measuring the volume of input from employee labour, the quantity unit for
compensation of employees
may be considered to be an hour's work of a given type and level of skill. As with goods and services, different qualities of work must be recognised and
quantity relatives calculated for each separate type of work. The price associated with each type of work is the compensation paid per hour, which may vary,
of course, between different types of work. A volume measure of work done may be calculated as a weighted average of the quantity relatives for different
kinds of work, weighted by the values of compensation of employees in the previous year or fixed base year. Alternatively, a wage rate index may be
calculated for work by calculating a weighted average of the proportionate changes in hourly rates of compensation for different types of work, again using
compensation of employees as weights. If a Laspeyres type of volume index is calculated indirectly by deflating the changes in compensation of employees at
current values by an index of the average change in hourly compensation, the latter should be a Paasche-type index.
Stocks of produced fixed assets and inventories
[]
See P&V measures paragraph 3.7
See P&V measures paragraph 3.7
10.45
Volumes at the prices of the previous year are needed both for stocks of produced fixed
assets
and for inventories. For the former, such data as are necessary for the calculation of capital
output
ratios are available if use is made of the perpetual inventory method. In other cases information on the values of stocks of assets may be collected from
producers and deflation made by the price indices used for fixed capital formation, taking into account the age structure of stocks.
Changes in inventories
are measured by the value of entries to inventories less the value of withdrawals from inventories, and the value of any recurrent losses of goods held in
inventories during a given period. Volumes at the prices of the previous year can be derived by the deflation of these components. In practice, however, it
is rare for entries and withdrawals of stocks to be actually known, and often the only available information is the value of the stocks at the start and at
the end of the period. In such cases, it will often be necessary to assume regular entries and withdrawals during the current period, so that the average
price for the period can be considered relevant for both entries and withdrawals. In such circumstances, calculating the variation in stocks by the
difference between the values of the entries and withdrawals amounts to the same as calculating the difference between the values of the initial and final
stocks. The variation in stocks in volume terms can then be calculated by deflating the initial and final stocks to bring them in line with the average
price of the base period. When the variations in stocks are known in quantity terms, it is possible, again assuming regular entries and withdrawals, to
calculate the volume of the variation in stocks by applying the average price of the base period to the variation in stocks in quantity terms.
MEASURES OF REAL INCOME FOR THE TOTAL ECONOMY
10.46
It is generally not possible to divide income flows into a price and a quantity component and for this reason price and volume measures
cannot be defined in the same way as for the flows and stocks of
products. Income flows can be measured in real terms only if one chooses some selected basket of goods and services on which the income is typically spent and uses
the price index for this basket as a deflator of current incomes. The choice is always arbitrary in the sense that income is seldom spent specifically for
purchases during the period in question. Some of it may be saved for purchases in later periods or, alternatively, the purchases during the period may be
partly financed from savings made earlier.
10.47 Gross domestic product at previous year prices measures the total
production
(less the
intermediate consumption) in volume terms for the total economy. The total real income of residents is influenced not only by this volume of production but also by the rate at which
exports can be traded against imports from the
rest of the world. If the terms of trade improve, fewer exports are needed to pay for a given volume of imports, so that at a given level of domestic production goods and
services can be reallocated from exports to consumption or capital formation.

Real gross domestic income can be derived by adding the so-called trading gain to volume figures on gross domestic product. The trading
gain or, as the case may be, loss is defined as:
i.e. the current balance of exports less imports, deflated by a price index P, less the difference between the deflated value of exports
and the deflated value of imports. The choice of an appropriate deflator P for the current trade balances should be left to the statistical authorities in a
country, taking account of the particular circumstances of that country. In circumstances in which there is uncertainty about the choice of deflator an
average of the import and the export price indices is likely to provide a suitable deflator.
To be able to express the various national income aggregates in real terms, it is recommended that receivables and payables of primary
incomes and transfers to and from abroad should be deflated with an index of gross domestic final expenditure. Real national disposable income is to be
expressed on a net basis by deducting from its gross value the consumption of fixed capital in volume terms.
INTERSPATIAL PRICE AND VOLUME INDICES
10.48
The fact that countries have different price levels and currencies poses a challenge to interspatial comparisons of prices and volumes.
Nominal exchange rates are not suitable conversion factors in such comparisons, because they do not adequately reflect price level differences, and because
they are not sufficiently stable over time.
10.49
Instead, purchasing power parities (PPPs) are applied. A PPP is defined as the number of units of country B's currency that is needed in
country B in order to purchase the same quantity of goods and services that one unit of country A's currency will purchase in country A. PPPs can thus be
interpreted as the exchange rate of an artificial currency commonly referred to as the purchasing power standard (PPS). If the expenditures of countries A
and B expressed in national currencies are converted into PPS, the resulting figures are expressed in the same price level and the same currency, allowing a
meaningful comparison of volumes.
10.50
PPPs for market goods and services are based on international price surveys. Such price surveys are carried out simultaneously in all
participating countries, based on a common product sample. The sample items are clearly specified in terms of their technical characteristics, as well as
other variables that are assumed to influence the price, like installation costs and the terms of sale. While priority is given to the comparability of the
sample items, this must nevertheless be weighted against their representativity in national markets. The product sample should ideally be equally
representative in all participating countries.
10.51
For non-market services, interspatial comparisons face the same problem as intertemporal ones, since no market prices exist in either
dimension. Traditionally, an input approach (or an input cost approach) has been applied, under the assumption that
output
equals the sum of inputs. This approach, which implies direct or indirect volume comparisons of inputs, fails to take differences in productivity into
account. For this reason, as for intertemporal comparisons, methods are preferred which focus either on the direct measurement of output or on output prices
which are subsequently used to deflate expenditure, at least for individual services such as education and health.
10.52
In the calculation of PPPs, the same index number formulae are applied as in the calculation of temporal indices. In a bilateral context
involving two countries, A and B, either country can be used to give the weights. Viewed from the angle of country A, a Laspeyres-type index with weights
from country A can be calculated as well as a Paasche-type index using weights from country B. However, if the two economies are structurally different, the
spread between these two indices may be quite large, and the end result would be heavily influenced by the choice of index. In binary comparisons, it is
thus preferable to apply the average of the two, that is, a Fisher index.
10.53
Explicit numerical weights are usually not available at the level of individual sample items. Therefore, a form of implicit weighting is
applied, based on whether countries regard a particular item as representative of the domestic consumption pattern or not. The lowest level of aggregation
for which numerical weights are available, is referred to as the basic heading (BH) level.
10.54
Transitivity implies that the direct PPP between countries A and C is equal to the indirect PPP derived by multiplying the direct PPP
between countries A and B (or any other third country) and the direct PPP between countries B and C. The Fisher PPPs at BH level are not transitive, but it
is possible to derive from them a set of transitive PPPs that resemble the original Fisher indices, using the criterion of least squares for this purpose.
Applying the so-called Éltetö-Köves-Szulc (EKS) formula minimises the deviations between the original Fisher indices and produces a complete set of
transitive PPPs at BH level.
10.55
The resulting set of transitive PPPs for all countries and all BHs are aggregated up to the level of total GDP using expenditures from
national accounts as weights. The aggregate PPPs at the level of GDP or any other category can be applied in, for instance, the calculation of real
expenditures and spatial volume indices. A PPP divided by the nominal exchange rate between two countries produces a price level index (PLI), that can be
used in analyses of countries' comparative price levels.
10.56
The European Commission (Eurostat) is responsible for calculating PPPs for the Member States in accordance with Regulation (EC) No
1445/2007
[2]
. In practice, these PPP calculations are embedded in a wider PPP program coordinated jointly by Eurostat and OECD. The detailed methods used in the program
are described in the
Eurostat-OECD Methodological manual on purchasing power parities
[3]
.
Regulation (EC) No 1445/2007 of the European Parliament and of
the Council of 11 December 2007 establishing common rules for the provision of basic information on Purchasing Power Parities and for their
calculation and dissemination
List of abbreviations and acronyms
ABO
accrued benefit obligation
ABS
asset-backed security
BPM6
Balance of payments manual, sixth edition
CCP
central counterparty clearing house
CDS
credit default swap
CIF
cost, insurance and freight
COFOG
Classification of the Functions of Government
COICOP
Classification of Individual Consumption by Purpose
COPNI
Classification of the Purposes of Non-Profit Institutions Serving Households
COPP
Classification of Outlays of Producers by Purpose
CPA
Classification of Products by Activity
EAA
economic accounts for agriculture
EAFRD
European Agricultural Fund for Rural Development
EAGF
European Agricultural Guarantee Fund
EC
European Commission
ECB
European Central Bank
EMU
economic and monetary union
ESA
European System of Accounts
ESO
employee stock option
ESSPROS
European System of Integrated Social Protection Statistics
EU
European Union
EURIBOR
European interbank offered rate
EUROSTAT
the statistical office of the European Union
FDI
foreign direct investment
FISIM
financial intermediation services indirectly measured
FOB
free on board
FRA
forward rate agreement
FVC
financial vehicle corporation
GAB
general arrangements to borrow
GDP
gross domestic product
GFS
government finance statistics
GNI
gross national income
GVA
gross value added
IAS
international accounting standards
IASB
International Accounting Standards Board
IASC
International Accounting Standards Committee
IC
insurance corporations
ICLS
International Conference of Labour Statisticians
ICPF
insurance corporations and pension funds
ICT
information, communications and telecommunications
IFRS
International Financial Reporting Standards
IIP
international investment position
ILO
International Labour Organisation
IMF
International Monetary Fund
IMTS
international merchandise trade statistics
IMTS
international merchandise trade statistics
INTRASTAT
statistical collection system
I-O
input-output
IPO
initial public offering
IPSASB
International Public Sector Accounting Standards Board
ISIC
International Standard Industrial Classification of all Economic Activities
ISIN
international securities identification number
KAU
kind-of-activity unit
KLEMS
capital, labour, energy, materials and services
LIBOR
London interbank offered rate
MFI
monetary financial institution
MMF
money market fund
MSITS
Manual on statistics of international trade in services
N.E.C.
not elsewhere classified
NAB
new arrangements to borrow
NACE
general industrial classification of economic activities within the European Union
NDP
net domestic product
NOS
net operating surplus
NPI
non-profit institution
NPISH
non-profit institution serving households
NUTS
nomenclature of territorial units for statistics
OECD
Organisation for Economic Cooperation and Development
OMFI
other monetary financial institution
OTC
over the counter
PAYE
pay as you earn
PBO
projected benefit obligation
PF
pension funds
PIM
perpetual inventory method
PPP
purchasing power parity
PPP
public-private partnership
PPS
purchasing power standard
PRGF
Poverty Reduction and Growth Facility
R&D
research and development
ROW
rest of the world
SAM
social accounting matrix
SDR
special drawing right
SEEA
System of Environmental-Economic Accounts
SNA
System of National Accounts
SOCX
Social Expenditure Database
SPE
special-purpose entity
SPV
special-purpose vehicle
STRIPS
Separate Trading of Registered Interest and Principal Securities
UCITS
undertakings for collective investment in transferable securities
UN
United Nations
VAT
value added tax