|
 |
| For any question on data and metadata, please contact: Eurostat user support |
|
|||
| 1.1. Contact organisation | Ministry of Labour, Solidarity and Social Security |
||
| 1.2. Contact organisation unit | Office for Strategy and Planning |
||
| 1.5. Contact mail address | Praça de Londres, nº 2 3º 1049-056 LISBOA PORTUGAL |
||
|
|||
| 2.1. Metadata last certified | 27/02/2023 | ||
| 2.2. Metadata last posted | 27/02/2023 | ||
| 2.3. Metadata last update | 27/02/2023 | ||
|
|||
| 3.1. Data description | |||
The Continuing Vocational Training Survey (CVTS) collects information on enterprises’ investment in the continuing vocational training of their staff. Continuing vocational training (CVT) refers to education or training measures or activities which are financed in total or at least partly by the enterprise (directly or indirectly). Part financing could include the use of work-time for the training activity as well as financing of training equipment. Information available from the CVTS is grouped around the following topics: - Provision of CVT courses and other forms of CVT (training/non-training enterprises) - CVT strategies - Participants in CVT courses - Costs of CVT courses - Time spent in CVT courses - Characteristics of CVT courses - Assessment of CVT activities The CVTS also collects some information on initial vocational training (IVT). For further information see the CVTS 6 legislation (http://ec.europa.eu/eurostat/web/education-and-training/legislation) and the CVTS 6 implementation manual (http://ec.europa.eu/eurostat/web/education-and-training/methodology). |
|||
| 3.2. Classification system | |||
The main groupings for enterprises are by economic activity (NACE), size group and training/non-training enterprises. |
|||
| 3.3. Coverage - sector | |||
Sections B to S (excluding O, P, Q, T, U). The group 949 - Activities of other membership organisations and the subclass 6832 - Co-property Administration were excluded from the target population. |
|||
| 3.4. Statistical concepts and definitions | |||
Definitions as well as the list of variables covered are available in the CVTS 6 implementation manual (http://ec.europa.eu/eurostat/web/education-and-training/methodology). |
|||
| 3.5. Statistical unit | |||
Enterprise. Enterprise definition is compliant with Council Regulation (EEC) No 696/93. |
|||
| 3.6. Statistical population | |||
Enterprises with at least 10 persons employed, belonging to Sections B to S (excluding O, P, Q, T, U). The group 949 and the subclass 6832 were excluded from the target population. The number of enterprises in the target population was 41 566. Variable A2tot (persons employed) refers to 31 December 2020. |
|||
| 3.7. Reference area | |||
Portugal. |
|||
| 3.8. Coverage - Time | |||
1999, 2005, 2010, 2015, 2020. |
|||
| 3.9. Base period | |||
Not applicable. |
|||
|
|||
Number, EUR. |
|||
|
|||
The reference year for CVTS 6 is the calendar year 2020. |
|||
|
|||
| 6.1. Institutional Mandate - legal acts and other agreements | |||
At European level Basic legal act: Regulation (EC) No 1552/2005 of the European Parliament and the Council Implementing act: Commission Regulation (EU) No 1153/2014, amending Commission Regulation (EC) No 198/2006 At national level Not applicable |
|||
| 6.2. Institutional Mandate - data sharing | |||
Not applicable. |
|||
|
|||
| 7.1. Confidentiality - policy | |||
PT follows the The European Statistics Code of Practice |
|||
| 7.2. Confidentiality - data treatment | |||
PT follows the The European Statistics Code of Practice |
|||
|
|||
| 8.1. Release calendar | |||
The release calendar is publicly available on the GEP´s website. |
|||
| 8.2. Release calendar access | |||
http://www.gep.mtsss.gov.pt/calendario |
|||
| 8.3. Release policy - user access | |||
The statistical information is disseminated simultaneously to all users. There is no privileged access to the information. |
|||
|
|||
Every 5 years. |
|||
|
|||
| 10.1. Dissemination format - News release | |||
Not applicable. |
|||
| 10.2. Dissemination format - Publications | |||
The results of CVTS 6 will be disseminated by a Summary Report and a more detailed publication (available at http://www.gep.msess.gov.pt/Statistics/Vocational Training Statistics). The publication for CVTS 2020 is available from March 3 (in Portuguese only). |
|||
| 10.3. Dissemination format - online database | |||
Online database available at www.ine.pt. |
|||
| 10.3.1. Data tables - consultations | |||
Not applicable. |
|||
| 10.4. Dissemination format - microdata access | |||
Only allowed to scientific purposes and in the GEP safe center. STATA software is used. |
|||
| 10.5. Dissemination format - other | |||
By request, additional information can be provided in table format. |
|||
| 10.5.1. Metadata - consultations | |||
Available in GEP and Statistics Portugal websites. |
|||
| 10.6. Documentation on methodology | |||
Available in GEP and Statistics Portugal websites: https://smi.ine.pt/DocumentacaoMetodologica/Detalhes/1685 |
|||
| 10.6.1. Metadata completeness - rate | |||
Available in GEP and Statistics Portugal websites. |
|||
| 10.7. Quality management - documentation | |||
Available in GEP and Statistics Portugal websites: https://smi.ine.pt/DocumentacaoMetodologica/Detalhes/1685 |
|||
|
|||
| 11.1. Quality assurance | |||
Due to the use of different sources (survey and administrative data), some inconsistencies were detected. In these cases, enterprises were contacted to clarify (e.g. high CVT costs and a low number of CVT hours). |
|||
| 11.2. Quality management - assessment | |||
The qualitative questions raise some problems because we cannot assure that the person who answers has the suited level of responsibility needed to have reliable information. In our opinion, qualitative questions are more suitable for face to face surveys. |
|||
|
|||
| 12.1. Relevance - User Needs | |||
The main users are the Ministry of Labour and Social Security (to evaluate the law enforcement concerning vocational training), Statistics Portugal, Ministry of Education and researchers from Universities (specific studies and modelling). Employer's associations and unions also use this information for labour negotiations. |
|||
| 12.2. Relevance - User Satisfaction | |||
No survey on users satisfaction was done. However we have some feedback from the users and they would like to have more disaggregation concerning economic activity and regional level. |
|||
| 12.3. Completeness | |||
No deviation except NACE group 949 (see 3.3). |
|||
| 12.3.1. Data completeness - rate | |||
Not applicable. |
|||
|
|||
| 13.1. Accuracy - overall | |||
The accuracy of statistical outputs indicates the degree of closeness of estimates to the true values. Several types of error contribute to the error of the statistics. Statistics can be different from the true values because of random variability (the statistics change from one to another implementation of the survey due to random effects) and bias (the average of possible values of the statistics is different from the true value due to systematic effects). The sampling errors that are due to the fact that only a sample is surveyed. In CVTS 6 to measure the accuracy of the estimates, the sampling errors were used. The estimated coefficients of variation for the key variables for all enterprises are lower than 2.5%, except for the variables cost (3.96%), direct costs (3.9%), labour costs of participants in CVT courses (4.58%), the total number of enterprises providing IVT (5.15%) and for the ratio of the total number of enterprises that provided any form of CVT to the total number of enterprises (5.15%). See table 13.2.1 "Sampling errors - indicators" in annex "PT - QR tables CVTS 2020 (excel)". The overall unit response rate is 60.1%. |
|||
| 13.2. Sampling error | |||
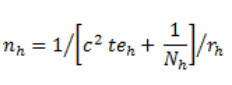
Sampling Method For this survey a sample of enterprises has been taken according to a sampling design that means stratification with random sampling within strata. The samples within strata were taken without replacement. The sampling frame was stratified by: region (NUTS at level I - Mainland, Autonomous Regions of Madeira and of Azores), Economic activity of enterprise, 20 NACE Rev. 2 categories (B, C10-C12, C13-C15, C17-C18, C19-C23, C24-C25, C26-C28 and C33, C29-C30, C16+C31-32, D-E, F, G(45), G(46), G(47), I, H, J, K(64,65), K(66), L+M+N+R+S) and 3 size categories. The size classification of enterprises was: 10 - 49, 50 - 249, 250 and more persons employed. For the Mainland, the sample size and the allocation were calculated with the maximum length of half confidence interval equal to 0.2 and assuming a response rate of 60%. The following formula was used for calculating the sample size in each stratum:
where: n h = the number of sampling units in the stratum cell, h rh = the anticipated response rate in the stratum cell, h c = maximum length of half the confidence interval teh = the anticipated proportion of training enterprises in stratum cell, h Nh = the number of enterprises (training and non-training) in stratum cell, h The minimum number of enterprises sampled in each stratum was 10. The survey is exhaustive for the regions of Madeira and Azores: all enterprises in these regions are completely enumerated. The survey gross sample was 6583 enterprises. For each sample stratum, systematic sampling was used to take the pre-defined number of sampling units from the sampling frame. Estimation / grossing-up procedures The estimation and grossing-up procedures are described in Annex 1. Annexes: Annex 1 - Estimation and grossing-up procedures |
|||
| 13.2.1. Sampling error - indicators | |||
The coefficients of variation for the key statistics are presented in table 13.2.1 "Sampling errors - indicators" in annex "PT - QR tables CVTS 2020 (excel)" broken down by NACE or size classes. |
|||
| 13.3. Non-sampling error | |||
See the following sections. |
|||
| 13.3.1. Coverage error | |||
The information on activity, region and number of persons employed in the sample frame is comprehensibly updated annually, with reference to the month of October. Due to the timely updating of the sample frame, coverage errors are negligible. See table 13.3.1 "Coverage error" in annex "PT - QR tables CVTS 2020 (excel)". |
|||
| 13.3.1.1. Over-coverage - rate | |||
See table 13.3.1.1 "Over-coverage - rate" in annex "PT - QR tables CVTS 2020 (excel)". |
|||
| 13.3.1.2. Common units - proportion | |||
Not applicable. |
|||
| 13.3.2. Measurement error | |||
The electronic questionnaire doesn't allow item non-response. The major part of the questionnaire was related to qualitative questions (quantitative data was obtained by an administrative source). |
|||
| 13.3.3. Non response error | |||
In order to reduce the non-response rate, enterprises received a letter informing on the survey and its purposes. Because the enterprises have already provided information on training carried out during 2020 (through an administrative source), they were informed that a light version of the European questionnaire would be applied. After the data collection a first reminder was sent out by email. The second reminder was sent 2 weeks after. Besides this, specialized staff were available to support enterprises by phone or by internet. |
|||
| 13.3.3.1. Unit non-response - rate | |||
The overall unit non-response rate was 39.9%. The unit non-response rates by NACE categories and size categories are presented in table 13.3.3.1 "Unit non-response - rate" in annex "PT - QR tables CVTS 2020 (excel)". Unit non-response is treated by re-weighting. The survey weights were adjusted to compensate for non-response. The set of responding units within each stratum is considered as the sample. For strata with only non-responses, no imputation was done. |
|||
| 13.3.3.2. Item non-response - rate | |||
Item non-response were not allowed by the electronic questionnaire. See table 13.3.3.2 "Item non-response - rate" in annex "PT - QR tables CVTS 2020 (excel)". |
|||
| 13.3.4. Processing error | |||
It was used a web survey to collect the qualitative data and data on training costs, training contributions and training receipts. For this reason, the validations embedded in the electronic questionnaire were relatively simple and were executed before transmitting the questionnaire. Upon arrival to the statistical office, warning checks were again performed and corrected, if it was the case. Coherence checks were applied when linking the data from the survey with the data from the administrative source. The main errors result from the inconsistency between the answers given in the survey and the information from the administrative source (e.g. number of persons employed, existence of courses internal/external). Other errors are mainly related to hours worked and labour costs. The number of errors were not accounted. |
|||
| 13.3.5. Model assumption error | |||
Not applicable. |
|||
|
|||
| 14.1. Timeliness | |||
18 months. |
|||
| 14.1.1. Time lag - first result | |||
22 months. |
|||
| 14.1.2. Time lag - final result | |||
22 months |
|||
| 14.2. Punctuality | |||
In accordance with the Regulation. See table 14.2 "Project phases - dates" in annex "PT - QR tables CVTS 2020 (excel)". |
|||
| 14.2.1. Punctuality - delivery and publication | |||
Not applicable. |
|||
|
|||
| 15.1. Comparability - geographical | |||
No remarks. No additional variables related to COVID-19 were collected. See table 15.1 "Comparability - geographical" in annex "PT - QR tables CVTS 2020 (excel)". |
|||
| 15.1.1. Asymmetry for mirror flow statistics - coefficient | |||
Not applicable. |
|||
| 15.2. Comparability - over time | |||
See table 15.2 "Comparability - over time" in annex "PT - QR tables CVTS 2020 (excel)". |
|||
| 15.2.1. Length of comparable time series | |||
Not applicable. |
|||
| 15.3. Coherence - cross domain | |||
See table 15.3 "Coherence - cross-domain" in annex "PT - QR tables CVTS 2020 (excel)". |
|||
| 15.3.1. Coherence - sub annual and annual statistics | |||
Not applicable. |
|||
| 15.3.2. Coherence - National Accounts | |||
Not applicable. |
|||
| 15.4. Coherence - internal | |||
CVTS results for a given reference year are based on the same microdata and results are calculated using the same estimation methods, therefore the data are internally coherent. |
|||
|
|||
No studies were carried out on this issue. |
|||
|
|||
| 17.1. Data revision - policy | |||
Not applicable. |
|||
| 17.2. Data revision - practice | |||
Not applicable. |
|||
| 17.2.1. Data revision - average size | |||
Not applicable. |
|||
|
|||
| 18.1. Source data | |||
See table 18.1 "Source data and data collection" in annex "PT - QR tables CVTS 2020 (excel)". |
|||
| 18.2. Frequency of data collection | |||
Every 5 years. |
|||
| 18.3. Data collection | |||
See also table 18.1 "Source data and data collection" in annex "PT - QR tables CVTS 2020 (excel)". |
|||
| 18.4. Data validation | |||
It was used a web survey. The validations are embedded in the electronic questionnaire. Warnings and fatal errors are created when data is outside the predefined parameters. Fatal errors prevent data sending and cannot be overruled, except by the statistical staff with a specific password. After data transmission, warning checks are again performed and if it was the case, some corrections are made. |
|||
| 18.5. Data compilation | |||
Data are processed by IBM SPSS Statistics - version 25. |
|||
| 18.5.1. Imputation - rate | |||
See table 18.5.1 "Imputation - rate" in annex "PT - QR tables CVTS 2020 (excel)". |
|||
| 18.6. Adjustment | |||
Not applicable. |
|||
| 18.6.1. Seasonal adjustment | |||
Not applicable. |
|||
|
|||
No remarks. |
|||
|
|||
|
|||
| PT - QR tables CVTS 2020 (excel) |
|||