|
 |
| For any question on data and metadata, please contact: Eurostat user support |
|
|||
| 1.1. Contact organisation | NATIONAL STATISTICS INSTITUTE - INE Spain |
||
| 1.2. Contact organisation unit | Deputy Directorate for Short-term Statistics |
||
| 1.5. Contact mail address | Retal Trade and Services Avenida de Manoteras, 50-52 28050 Madrid (Spain) |
||
|
|||
| 2.1. Metadata last certified | 07/08/2023 | ||
| 2.2. Metadata last posted | 07/08/2023 | ||
| 2.3. Metadata last update | 07/08/2023 | ||
|
|||
| 3.1. Data description | |||
Retail Trade The main purpose of Retail Trade Indices (RTI) is to provide information about the fundamental characteristics of enterprises dedicated to retail trade in Spain. This allows measuring the evolution of the activity in the sector in the short term. This statistical operation fulfils Council Regulation (EC) No 1165/98 of 19 May 1998 concerning short-term statistics amended by Regulation (EC) No 1158/2005 of the European Parliament and of the Council of 6 July 2005. These Regulations aim to establish a common framework for the production of short-term Community statistics on the business cycle necessary for the analysis of the short-term evolution of supply and demand, production factors and prices. Regulation (EC) No 1165/98 will be repealed with effect from January 1, 2024. European Parliament and Council Regulation (EU) 2019/2152 on European business statistics and Commission Implementing Regulation 2020/1197 laying down technical specifications and arrangements pursuant to Regulation (EU) 2019/2152 will be applicable from January 1, 2021. It is a statistic with direct data collection. Results are presented as indices to measure variations taking as reference the base year 2015. This operation began to be carried out in the year 1995, however some series began in the year 2000. In January 2013, coinciding with the base change from 2005 to 2010, the formulation used was modified from direct Laspeyres-type indices with fixed base year 2005 to chainlinked Laspeyres indices with base year 2010 (monthly chain-linking during the last month of December).
45 and 46 of NACE Rev.2 The main purpose of the statistical operation of Services Sector Activity Indicators (SSAI) is to provide short-term performance indicators of the economic activity of enterprises operating in the non-financial market services in Spain via two variables: turnover and persons employed. The objective of this operation is to fulfil Regulation (EU) 2019/2152 of the European Parliament and of the Council on European business statistics, repealing 10 legal acts in the field of business statistics (EBS-Regulation) and Commission Implementing Regulation 2020/1197 laying down technical specifications and arrangements pursuant to Regulation (EU) 2019/2152 of the European Parliament and of the Council on European business statistics repealing 10 legal acts in the field of business statistic (General Implementing Act). Before the EBS, the STS legal base was Council Regulation No 1165/98 of 19 May 1998 concerning short-term statistics, amended by Regulation No 1158/2005 of 6 July 2005 concerning short-term statistics. The Article 25.3 of Regulation (EU) 2019/2152 mentions that Regulation (EC) No 1165/98 is repealed with effect from 1 January 2024. These Regulations aim to create a common framework for the production of Community statistics on the short-term evolution of supply, demand, production factors and prices. This operation began to be carried out in the year 2002, although we have data from year 2000. In the year 2005, the sample was increased in order to disseminate regional data, and as of January 2009 SSAI provides information in NACE Rev.2. In January 2013, coinciding with the base change from 2005 to 2010, the formulation used is modified, from direct Laspeyres-type indices with fixed base year 2005, to chain-linked Laspeyres indices, with base year 2010 (monthly chain-linking during last December). |
|||
| 3.2. Classification system | |||
Retail Trade Indices of Retail Trade in base 2015 are published following the Statistical Classification of Economic Activities in the European Community (NACE Rev.2). 45 and 46 of NACE Rev.2 Statistical Classification of Economic Activities in the European Communities (NACE Rev.2). |
|||
| 3.3. Coverage - sector | |||
Retail Trade The current index covers Division 47 of NACE Rev.2. 45 and 46 of NACE Rev.2 The current index covers Divisions 45 and 46 of NACE Rev.2. |
|||
| 3.4. Statistical concepts and definitions | |||
Retail Trade Enterprise classification variables Economic activity The economic activity carried out by a enterprise is defined as the creation of added value by means of the production of goods and services. Each one of the statistical units studied (enterprises) frequently carries out several activities that should be classified in separate categories of the National Classification of the Statistical Classification of Economic Activities in the European Community (NACE Rev.2). In general, the activities carried out by an economic unit may be of three types: main, secondary and auxiliary activities. The main activity differs from secondary activities because it generates the greatest added value and auxiliary activities are those that generate services that are not sold on the market and only serve the unit they depend on (administration departments, transport or storage services). Due to the difficulties faced by enterprises in calculating added value when various activities are carried out, the activity which generates the greatest volume of business is considered the main activity or, failing that, that which employs the greatest number of persons. Although statistical units are classified according to their main activity, the information that is requested from the informant units refers not only to the main activity under consideration, but also to all the secondary and auxiliary activities which are carried out. Enterprise size The size of enterprises is one of the most important variables when it comes to classifying enterpises. This size may be established in terms of the magnitude of turnover or production value, or by considering the number of persons on the enterprise staff. In RTI, this latter option is chosen to determine the size of the enterprises. Variables studied Turnover Turnover is defined in Commisssion Regulation (EC) No 1503/2006. Turnover comprises the totals invoiced by the observation unit during the reference period, and this corresponds to market sales of goods or services supplied to third parties. Turnover also includes all other charges (transport, packaging, etc.) passed on to the customer, even if these charges are listed separately in the invoice. Turnover excludes VAT and other similar deductible taxes directly linked to turnover as well as all duties and taxes on the goods or services invoiced by the unit. Reduction in prices, rebates and discounts as well as the value of returned packing must be deducted. Price reductions, rebates and bonuses conceded later to clients, for example at the end of the year, are not taken into account. Income classified as other operating income, financial income and extraordinary income in enterprise accounts is excluded from turnover.
45 and 46 of NACE Rev.2 Enterprise classification variables Economic activity The economic activity carried out by a enterprise is defined as the creation of added value by means of the production of goods and services. Each one of the statistical units studied (enterprises) frequently carries out several activities that should be classified in separate categories of the National Classification of the Statistical Classification of Economic Activities in the European Community (NACE Rev.2). In general, the activities carried out by an economic unit may be of three types: main, secondary and auxiliary activities. The main activity differs from secondary activities because it generates the greatest added value and auxiliary activities are those that generate services that are not sold on the market and only serve the unit they depend on (administration departments, transport or storage services). Due to the difficulties faced by enterprises in calculating added value when various activities are carried out, the activity which generates the greatest volume of business is considered the main activity or, failing that, that which employs the greatest number of persons. Although statistical units are classified according to their main activity, the information that is requested from the informant units refers not only to the main activity under consideration, but also to all the secondary and auxiliary activities which are carried out. Enterprise size The size of enterprises is one of the most important variables when it comes to classifying enterprises. This size may be established in terms of the magnitude of turnover or production value, or by considering the number of persons on the enterprise staff. In SSAI, this latter option is chosen to determine the size of the enterprises. Definition of variables Income or turnover Income or turnover is the total invoicing for the enterprise. Its definition is deduced from accountancy definitions used by enterprises. This includes those amounts invoiced by the enterprise due to the provision of services and the sale of goods that are the traffic objective, including those carried out through subcontracting. Expenses invoiced for packaging and transport are included; the sale of purchased goods for resale in the same conditions in which they were received, and sales of subproducts. As well as hours worked invoiced to third parties solely for subcontracted work. It does not cover subsidies received from public authorities or from the European Union, financial profit or other operating profit such as subsidies, sales of shares and fixed assets, income from interest, dividends and patents, leasing of enterprise and production unit property and machinery. Neither does it include income from staff amenities (canteens etc.) and the supply of goods or services within the observation unit.
Variable 140101 Production (volume) Spain has accepted transitional arrangements for this variable, so we are not sending the data yet. In year 2024 we will begin to provide the first BCS_PVSES_A metadata. |
|||
| 3.5. Statistical unit | |||
Retail Trade The Council Regulation No 1165/98 of 19 May 1998 concerning short-term statistics, amended by the Regulation No 1158/2005 of 6 July 2005 concerning short-term statistics requires the use of enterprises as observation units for indicators in retail trade. In RTI survey, enterprises which carry out any of the activities included within Division 47 of NACE Rev. 2 as their main economic activity, are used as statistical units. Regulation (EC) No 1165/98 will be repealed with effect from January 1, 2024. European Parliament and Council Regulation (EU) 2019/2152 on European business statistics and Commission Implementing Regulation 2020/1197 laying down technical specifications and arrangements pursuant to Regulation (EU) 2019/2152 will be applicable from January 1, 2021.
45 and 46 of NACE Rev.2 The statistical unit of the legal unit carrying out as its main economic activity some of the services included in the population scope has been used. It's also the informant unit, because as it is perfectly defined and located, and since it has the accounting and employment data available, the response is provided and homogeneous information is obtained. |
|||
| 3.6. Statistical population | |||
Retail Trade The statistical population comprises the observation units (enterprises) whose main activity is registered in Division 47 of Section G of the National Classification of Economic Activities (CNAE-2009): 47. Retail trade, except of motor vehicles and motorcycles. The frame used to identify the units is the Central Business Register (CBR). According to the CBR in year 2022 there were about 429,000 enterprises in the Spanish territory whose main activity belongs to division 47.
45 and 46 of NACE Rev.2 TRADE (G) |
|||
| 3.7. Reference area | |||
Retail Trade The geographical coverage of RTI is the whole Spanish territory so the Autonomous Cities of Ceuta and Melilla are included. Turnover of the units located outside the Spanish territory are not included in the aggregates.
45 and 46 of NACE Rev.2 The geographical coverage of Services is the whole Spanish territory excluding the Autonomous Cities of Ceuta and Melilla. Turnover of the units located outside the Spanish territory are not included in the aggregates. The sampled units located in Spain provide their total turnover. |
|||
| 3.8. Coverage - Time | |||
Retail Trade The base year of the index is 2015. The index previously had 1994, 2001, 2005 and 2010 as base years. The index corresponding to reference month January 2018 was the first to be published in base 2015. For the indexes G47_FOOD, G47_NFOOD, G47_NFOOD_X_G473, G47_NF_CLTH, G47_NF_OTH, G47_NF_OTH1, G47_NF_OTH2 and G47_X_G473 series begin in 1995. For the indexes G47, G47_NF_HLTH, G471, G4711, G4719, G472, G473 and G4791 series begin in 2000.
45 and 46 of NACE Rev.2 This operation began to be carried out in the year 2002, although we have data from year 2000. In the year 2005, the sample was increased in order to disseminate regional data, and as of January 2009 SSAI provides information in NACE Rev.2. |
|||
| 3.9. Base period | |||
Retail Trade Council Regulation No 1165/98 of 19 May 1998 concerning short-term statistics, amended by Regulation No 1158/2005 of 6 July 2005 which concerns short-term statistics, establishes that, every five years, Member States shall rebase the indices using as base years the years ending with a 0 or a 5 and that all indices must be rebased on the new base year within three years after the end of each new base year. For this reason in 2022 the data will be disseminated in base 2015. For this base we have:
The base and reference year are the same at national level and for the data transmitted to Eurostat. Regulation (EC) No 1165/98 will be repealed with effect from January 1, 2024. European Parliament and Council Regulation (EU) 2019/2152 on European business statistics and Commission Implementing Regulation 2020/1197 laying down technical specifications and arrangements pursuant to Regulation (EU) 2019/2152 will be applicable from January 1, 2021.
45 and 46 of NACE Rev.2 In year 2018, we begin to publish our data in new base year. We choose this year to meet the requirements established in the Regulation of Parliament and EU Council which requires that the base years are those ending in zero or five. This facilitates the construction of European aggregates. Services Sector Activity Indicators (SSAI) use chain linking indexes: - The Base year: Year 2015 (the year when the index equals 100) - The reference period: December t-1 (our chain linking is based on a period shorter than a year) - The reference year: December t-1 (the year on which the weights are based) Our base and reference periods released national are equal than data transmitted to Eurostat. In year 2024 we will begin to publish our data in new base year (2021). |
|||
|
|||
Retail Trade Indices and percentage changes (on previous period or compared to the same period in previous year). 45 and 46 of NACE Rev.2 Indices and percentage changes (on previous period or compared to the same period in previous year). |
|||
|
|||
Retail Trade The reference period is the month. 45 and 46 of NACE Rev.2 The reference period is the month. |
|||
|
|||
| 6.1. Institutional Mandate - legal acts and other agreements | |||
Retail Trade The legal basis for the STS indicators is Council Regulation No 1165/98 of 19 May 1998 concerning short-term statistics, amended by Regulation No 1158/2005 of 6 July 2005 concerning short-term statistics and by Regulation (EC) No 1893/2006 of 20 December 2006 establishing the statistical classification of economic activities NACE Revision 2. The definitions of short-term statistics variables are laid down in Commission Regulation No 1503/2006 of 28 September 2006 which implements and amends Council Regulation No 1165/98 of 19 May 1998 that concerns short-term statistics as regards the definition of variables. Regulation (EC) No 1165/98 will be repealed with effect from January 1, 2024. European Parliament and Council Regulation (EU) 2019/2152 on European business statistics and Commission Implementing Regulation 2020/1197 laying down technical specifications and arrangements pursuant to Regulation (EU) 2019/2152 will be applicable from January 1, 2021.
According to the Spanish legislation, 'Retail Trade Indices' is a compulsory statistic. The compilation and dissemination of data are governed by the Statistical Law No 12/1989 "Public Statistical Function" of May 9, 1989, and Law No 4/1990 of June 29 on "National Budget of State for the year 1990" amended by Law No 13/1996 "Fiscal, administrative and social measures" of December 30, 1996, makes compulsory all statistics included in the National Statistics Plan. The Plan contains the statistics that must be developed in the four year period by the State General Administration's services or any other entity dependent on it. All statistics included in the National Statistics Plan are statistics for state purposes and are obligatory. The National Statistics Plan 2021-2024, approved by Royal Decree 1110/2020, of December 15th, is the Plan currently implemented. This statistical operation has governmental purposes, and it is included in the National Statistics Plan 2021-2024, which is available in the following link.
45 and 46 of NACE Rev.2 Legal basis The legal basis for the STS indicators are Regulation (EU) 2019/2152 of the European Parliament and of the Council on European business statistics, repealing 10 legal acts in the field of business statistics (EBS-Regulation) and Commission Implementing Regulation 2020/1197 laying down technical specifications and arrangements pursuant to Regulation (EU) 2019/2152 of the European Parliament and of the Council on European business statistics repealing 10 legal acts in the field of business statistic (General Implementing Act). Before the EBS, the STS legal base was Council Regulation No 1165/98 of 19 May 1998 concerning short-term statistics, amended by Regulation No 1158/2005 of 6 July 2005 concerning short-term statistics. The Article 25.3 of Regulation (EU) 2019/2152 mentions that Regulation (EC) No 1165/98 is repealed with effect from 1 January 2024. According to the Spanish legislation, SSAI is a compulsory statistic. The compilation and dissemination of data are governed by the Statistical Law No 12/1989 "Public Statistical Function" of May 9, 1989, and Law No 4/1990 of June 29 on "National Budget of State for the year 1990" amended by Law No 13/1996 "Fiscal, administrative and social measures" of December 30, 1996, makes compulsory all statistics included in the National Statistics Plan. The Plan contains the statistics that must be developed in the four year period by the State General Administration's services or any other entity dependent on it. All statistics included in the National Statistics Plan are statistics for state purposes and are obligatory. The National Statistics Plan 2021-2024, approved by Royal Decree 1110/2020, of December 15th, is the Plan currently implemented. This statistical operation has governmental purposes, and it is included in the National Statistics Plan 2021-2024, which is available in the following link. |
|||
| 6.2. Institutional Mandate - data sharing | |||
Retail Trade The exchanges of information between the INE and the rest of the State statistical offices (Ministerial Departments, independent bodies and administrative bodies depending on the State General Administration), or between these offices and the Autonomous Communities Statistical Offices, are regulated in the Statistical Law No 12/1989 "Public Statistical Function". This law also regulates the mechanisms of statistical coordination, and concludes cooperation agreements between the different offices when necessary. Through the collaboration agreements signed with regional statistical institutes, monthly information exchange is done meeting the requirements established to preserve statistical confidentiality.
45 and 46 of NACE Rev.2 The exchanges of information between the INE and the rest of the State statistical offices (Ministerial Departments, independent bodies and administrative bodies depending on the State General Administration), or between these offices and the Autonomous Communities Statistical Offices, are regulated in the Statistical Law No 12/1989 "Public Statistical Function". This law also regulates the mechanisms of statistical coordination, and concludes cooperation agreements between the different offices when necessary. Through the collaboration agreements signed with regional statistical institutes, monthly information exchange is done meeting the requirements established to preserve statistical confidentiality. |
|||
|
|||
| 7.1. Confidentiality - policy | |||
Retail Trade RTI is a statistical operation included in the National Statistics Plan 2021-2024, therefore, it is subject to Statistics Law No 12/1989 "Public Statistical Function" and, consequently, data is protected by the principle of statistical confidentiality in all the storages of production. Regulation (EC) No 223/2009 of the European Parliament and of the Council on European statistics stipulates the need to establish a guideline and common principles to ensure confidentiality of data used during the production of European statistics and also when accessing the confidential data. INE Spain Confidentiality Policy can be found in the following link.
45 and 46 of NACE Rev.2 SSAI is a statistical operation included in the National Statistics Plan 2021-2024, therefore, it is subject to Statistics Law No 12/1989 "Public Statistical Function" and, consequently, data is protected by the principle of statistical confidentiality in all the storages of production. Regulation (EC) No 223/2009 of the European Parliament and of the Council on European statistics stipulates the need to establish a guideline and common principles to ensure confidentiality of data used during the production of European statistics and also when accessing the confidential data. INE Spain Confidentiality Policy can be found in the following link. |
|||
| 7.2. Confidentiality - data treatment | |||
Retail Trade INE Spain takes the necessary logical, physical and administrative provisions to protect confidential data, from data collection to dissemination. Questionnaires of the survey include a legal clause related to protection and preservation of data collected. In the case of this survey, only aggregate information is disseminated. Besides data are only published down to an activity level at which they are not confidential and no confidential data can be obtained.
45 and 46 of NACE Rev.2 INE Spain takes the necessary logical, physical and administrative provisions to protect confidential data, from data collection to dissemination. Questionnaires of the survey include a legal clause related to protection and preservation of data collected. In the case of this survey, only aggregate information is disseminated. Besides data are only published down to an activity level at which they are not confidential and no confidential data can be obtained. |
|||
|
|||
| 8.1. Release calendar | |||
Retail Trade The advanced calendar is published in the last quarter of each year and shows the exact dates of the publication of the short-term statistics. 45 and 46 of NACE Rev.2 The publication advances of the calendar it is made in the last quarter of every year and shows the exact dates of the publications. |
|||
| 8.2. Release calendar access | |||
Retail Trade The release calendar is disseminated on the INE website. 45 and 46 of NACE Rev.2 This release calendar is available on the web site. |
|||
| 8.3. Release policy - user access | |||
Retail Trade All users have access to the data since 9 am on the press release day. The data are disseminated at INE Spain website. Users are informed that the data are being released via Twitter and also at INE Spain website "News flash" section. In accordance with the European Statistics Code of Practice, all users have access to the same statistical information at the same time, and any privileged pre-release access to any outside user must be limited, controlled and made public. In this sense, a few hours before its official publication, some statistical information of the INE is transmitted, under embargo, to the appointed body, the Secretariat of State for Economic Affairs and Business Support of the Ministry of Economic Affairs and Digital Transformation, for the purpose of providing sufficient time for their responsible parties to prepare answers to any possible questions that journalists might ask them. The release policy doesn't determine the time at which data are disseminated. The dissemination policy is available in the following link. The same release policy is applied to national releases and to transmissions to Eurostat. Main aggregates are transmitted to EUROSTAT several days before the national release and all indexes at the moment of the national release. Data are transmitted in SDMX-ML format.
45 and 46 of NACE Rev.2 All users have access to the data since 9 am on the press release day. The data are disseminated at INE Spain website. Users are informed that the data are being released via Twitter and also at INE Spain website "News flash" section. In accordance with the European Statistics Code of Practice, all users have access to the same statistical information at the same time, and any privileged pre-release access to any outside user must be limited, controlled and made public. In this sense, a few hours before its official publication, some statistical information of the INE is transmitted, under embargo, to the appointed body, the Secretariat of State for Economic Affairs and Business Support of the Ministry of Economic Affairs and Digital Transformation, for the purpose of providing sufficient time for their responsible parties to prepare answers to any possible questions that journalists might ask them. The release policy doesn't determine the time at which data are disseminated. The dissemination policy is available in the following link. The same release policy is applied to national releases and to transmissions to Eurostat. Data are transmitted in SDMX-ML format to Eurostat at the moment of the national release. |
|||
|
|||
Retail Trade Monthly. The publication is released around 30 days after the end of the reference period. 45 and 46 of NACE Rev.2 Monthly. The publication is released around 50 days after the end of the reference period. |
|||
|
|||
| 10.1. Dissemination format - News release | |||
Retail Trade The press releases are available online. 45 and 46 of NACE Rev.2 The press releases can be consulted on-line. |
|||
| 10.2. Dissemination format - Publications | |||
Retail Trade All information related to this indicator is posted on the INE website. Here you can find the following publications: - Press Release, highlighting the components that influence the evolution of the indicator in the reference month, both with regard to sales and occupation. - Table Annex containing the tables attached to the Press Release. - Methodology where it can be consulted the Standardised Methodological Report of INE Spain, the file of the Inventory Statistical Operation and the methodology of Retail Trade Indices which highlight in greater detail the methodological characteristics of the indicator. - Related links where information about previous bases can be consulted. All these publications are available at the following link.
45 and 46 of NACE Rev.2 There are no publications in paper, the information related to this indicator is published in the web page of the INE. In it is possible to find the following information:
Also results of the indicators are attached in previous bases. EUROSTAT, the statistical office of the European Union, provide the European Union with statistics at European level that enable comparisons between countries and regions. This information is available in the Database- Short term business statistics- Eurostat. |
|||
| 10.3. Dissemination format - online database | |||
Retail Trade INEbase is the system used to store and disseminate through the INE Web all statistical information. It contains all the information produced by the INE in electronic format. It is organized basically following the thematic classification of the Inventory of Statistical Operations of the General State Administration. The basic unit is the statistical operation, defined as the set of activities that lead to the collection of statistics for a particular sector or theme, from data collected individually. The results of the survey are available from 1995 to the present. National dissemination shows indices as well as the different rates of change in sales for different levels of disaggregation by product, by region and by distribution class. Index series distinguish sales at current prices, deflated, adjusted for calendar effect and adjusted for seasonal and calendar effects that can be consulted on the following link. The weighting structure used in the index calculation is available on the following link. In 2022 the total number of accesses to Retail Trade Indices website was AC1= 984,230 and the total number of accesses to Retail Trade Indices metadata was AC2= 1,996.
45 and 46 of NACE Rev.2 INEbase is the system that the INE uses to store and to disseminate in the Web all the statistical information. It contains all the information that the INE produces in electronic format. It is organized basically following the thematic classification of the Inventory of Statistical Operations of the General Administration of the State. The basic unit is the statistical operation defined as the set of activities that lead to the obtaining of statistical results for a certain sector or topic, from information gathered individually. The users can accede to the information in INEbase-Services Sector Activity Indicators (SSAI). In 2022 the total number of accesses to Services Sector Activity Indicators website was AC2=1339. |
|||
| 10.4. Dissemination format - microdata access | |||
Retail Trade Microdata are not published, but they are given only to Regional Statistical Institutes with which there is a signed collaboration agreement for the transfer of such information under the Framework Agreement for cooperation between the INE and the Headquarters Statistics of the Autonomous Communities (OCECAS).
45 and 46 of NACE Rev.2 The microdata of the Services Sector Activity Indicators (SSAI) are not accessible to the general public. A file of microdata does not disseminated anonymous, only these are facilitated to the Oficinas Centrales de Estadística de las Comunidades Autónomas (OCECAS) with which an agreement of collaboration has been signed for the reference of the above mentioned information, by virtue of the Framework agreement of Collaboration between the INE and the OCECAS. |
|||
| 10.5. Dissemination format - other | |||
Retail Trade It is possible to request information to the user service area of the INE, which takes into account, when processing such requests, limitations on confidentiality or precision. Our data are sent to Eurostat, either to be used in european aggregates or to be released also as national data.
45 and 46 of NACE Rev.2 It is possible to request information as to the user service area INE. It takes into account when processing such requests limitations on confidentiality or precision. Our data are sent to Eurostat, either to be used in European aggregates or to be released also as national data. |
|||
| 10.6. Documentation on methodology | |||
Retail Trade The documentation on the methodology is available here. The metadata completeness rate is AC3=100%
45 and 46 of NACE Rev.2 The documentation on the methodology is available at the link: methodology report |
|||
| 10.7. Quality management - documentation | |||
Retail Trade The statistics are prepared in accordance with EU guidelines in order to meet the Code of Practice implemented by Eurostat following the quality criteria on relevance, accuracy, timeliness and punctuality, accessibility and clarity, comparability, consistency and completeness. Fields from 11 to 18 of this document are the user-oriented quality report of this statistical operation.
45 and 46 of NACE Rev.2 The statistics are prepared in accordance with EU guidelines in order to meet the Code of Practice implemented by Eurostat following the quality criteria on relevance, accuracy, timeliness and punctuality, accessibility and clarity, comparability, consistency and completeness. To ensure the quality of statistics, every three years the Commission shall submit to the European Parliament and the Council a report on the statistics compiled pursuant to Regulation (EC) No 1165/1998 of the Council and in particular on their relevance and quality and the revision of indicators. This report addresses the relevance, quality and review of the indicators as well as the cost of the statistical system and the burden for businesses in relation to its benefits. There aren't additional national quality reports. REPORT FROM THE COMMISSION TO THE EUROPEAN PARLIAMENT AND THE COUNCIL concerning short term statistics as required by Article 14(2) of Council Regulation (EC) No 1165/1998. |
|||
|
|||
| 11.1. Quality assurance | |||
Retail Trade The quality assurance framework for INE statistics is based on the ESCOP, the Code of Good Practice of the European Statistics Eurostat. The ESCOP consists on 15 principles, grouped into three areas: Institutional Environment, Statistical Processes and Statistical Output. Each principle is associated with a number of indicators to measure. To value quality different tools provided by Eurostat are used: the indicators mentioned above, the autoevaluation (DESAP), the review for counterparts (Peer Review), the audits of quality and user satisfaction surveys. The RTI production process is designed to ensure the quality of the information used as well as the results obtained from the same. To do this, at all stages of the process various quality controls are designed and detection of invalid values, non-response estimation, supervision and inspection of field work, and other permanent controls on the flow of information are carried out. This statistical operation is carried out under Regulation 1165/98 of the Council of 19 May 1998 concerning short-term statistics and follow the community guidelines, meeting the Code of Practice and taking the necessary measures so that the indicator meets all requirements published in required quality. Regulation (EC) No 1165/98 will be repealed with effect from January 1, 2024. European Parliament and Council Regulation (EU) 2019/2152 on European business statistics and Commission Implementing Regulation 2020/1197 laying down technical specifications and arrangements pursuant to Regulation (EU) 2019/2152 will be applicable from January 1, 2021.
45 and 46 of NACE Rev.2 The frame of quality guarantee for the statistics of the INE is based on the ESCOP, the Code of Good practices of EUROSTAT'S European Statistics. The ESCOP consists of 15 principles grouped in three areas: Institutional Environment, Processes and Products. Every principle has associate a series of indicators that allow his measure. To value the quality different tools provided by EUROSTAT are in use: the already mentioned indicators, the self-evaluation (DESAP), the Review for counterparts (Peer Review), the Audits of quality and the Surveys of users' satisfaction. The statistical operation Services Sector Activity Indicators (SSAI) is realized in conformity with the community directives, fulfilling the Code of Good Practices implanted by Eurostat and taking the necessary measurements in order that the published indicators fulfill all the requirements of quality needed. |
|||
| 11.2. Quality management - assessment | |||
Retail Trade The RTI is a high quality product. Its sample size allows to offer information up to regional level within reasonable sampling errors, the harmonized methodology used allows to offer international comparisons with a high level of solvency and gives a valuable measure of the retail sector than no other statistical source provides with the same level of detail with monthly frequency. As for the limitations of the survey should be noted the inherent sampling statistical operations such as no response and the sampling errors or variation coefficients of the estimates. In both cases are kept within reasonable limits.
Regulation (EC) No 1165/98 will be repealed with effect from January 1, 2024. European Parliament and Council Regulation (EU) 2019/2152 on European business statistics and Commission Implementing Regulation 2020/1197 laying down technical specifications and arrangements pursuant to Regulation (EU) 2019/2152 will be applicable from January 1, 2021.
Also, met the quality criteria listed in Article 12, paragraph 1 of Regulation (EC) No 223/2009 of the European Parliament and of the Council, namely: relevance, accuracy, timeliness, punctuality, accessibility, clarity, comparability and consistency.
45 and 46 of NACE Rev.2 The statistical operation of the Services Sector Activity Indicators (SSAI) constitutes a product of high quality. His sample size allows to offer information up to the autonomous level inside a few reasonable sampling error, the harmonized used methodology allows to offer comparisons in the international area with a high level of solvency and an extremely valuable measure gives on the sector services, which no other statistical source provides with the same level of detail with monthly frequency. As for the limitations of the survey it is necessary to indicate the inherent ones in the statistical operations for sampling, such as not response and the already mentioned sampling errors or coefficients of variation of the estimations. In both cases, they are kept inside reasonable limits. The Regulation n º 1158/2005 of the European Parliament and of the Advice of July 6, 2005 establishes that the quality of the variables will verify from time to time comparing them with another statistical information. The above mentioned comparison will be effected by each of the members states and by the Commission (Eurostat). In addition, the internal coherence will happen. Likewise, it fulfills the quality criteria enumerated in the article 12, paragraph 1, of the Regulation (CE) n º 223/2009 of the European Parliament and of the Advice, namely: relevancy, precision, current importance, punctuality, accessibility, clarity, comparability and coherence. |
|||
|
|||
| 12.1. Relevance - User Needs | |||
Retail Trade The RTI covers statistical information needs of different user groups: Likewise the survey responds to needs of foreign users, both institutional and private. Among the first Eurostat, OECD, UN, IMF, among others. Some specific examples of the uses to which our information is intended are:
45 and 46 of NACE Rev.2 The statistical operation of the Services Sector Activity Indicators (SSAI) covers the needs of statistical information of different user groups: The INE itself, which to compile the national accounts uses this statistics of base. Departments and other public organisms that use the results of this statistical operation to made economic analysis or predictions, to elaborate synthetic indicators of activity, etc. Territorial administrations like the autonomous communities. To all the Institutes of statistics of the autonomous communities, by virtue of the agreements established between the INE and these institutions, they receive monthly the information (microdata or regional already compiled indexes) correspondent to enterprises of the sample who belong its region. With this information there can disseminate the Services Sector Activity Indicators (SSAI) to a major level of detail for his Community, it's useful for the measurement of the economic cycle and as instrument of economic regional analysis. Investigators and academic world, enterprises and institutions without ends of profit (services of study of enterprises, foundations, associations, etc.), unions and employer organizations, press and specialized media, as well as of foreign users, so much institutional as individuals. Between the first ones of the latter they stand out, Eurostat, the European Central Bank and the OECD. |
|||
| 12.2. Relevance - User Satisfaction | |||
Retail Trade To provide guidance about the opinion that users have on Retail Trade Indices (RTI), surveys of user satisfaction carried out by INE Spain can be used. These user satisfaction surveys value, among others, the services sector. These surveys are carried out every three years since 2007. The general rate achieved by the services sector in 2019 satisfaction survey was 3.80 out of 5. The national user surveys' results is available in the following link. Moreover, people in charge of the survey stay in contact with the main users and respondents in order to attend any specific needs of information.
45 and 46 of NACE Rev.2 The INE has made general surveys of users' satisfaction the year 2007, 2010, 2013, 2016 and 2019 and plans to continue making them every 3 years. Their purpose is to know the perception of the users of the statistics regarding to the quality of the information that they use, and in what degree they find his needs covered. In addition, other special surveys are realized to know certain themes: diffusion of the information, quality of certain publications, etc. Besides the surveys experts are in constant contact with main users, in order to meet any specific information need. In the last survey of users satisfaction realized in the year 2019, the sector " Short-term of the sectorial and labor activity " in which this operation is fitted, obtained a valuation for the users of 3.80 on 5. The national user surveys' results is available in the link. |
|||
| 12.3. Completeness | |||
Retail Trade Retail Trade Indices provide all the information required by national and international regulations related to this statistical operation, so the rate of available statistics is R1=100%. 45 and 46 of NACE Rev.2 The survey responds to all requests for information, both national and international regulations. Available statistical results rate is R1= 100%. |
|||
|
||||||||||||||||||||||||||||||||||||||||||||||||||||
| 13.1. Accuracy - overall | ||||||||||||||||||||||||||||||||||||||||||||||||||||
Retail Trade The sample design attempts to minimize sampling errors. Also, errors are reduced as far as possible during the process survey: in data collection (monitoring and control response rate of editing) and later in non response imputation phase and calculation of aggregate indices. This allows a high degree of reliability of the statistical operation. Random stratified sampling has been used. In order to set out a measurement of the quality from the indices, an approximate relative sampling error is calculated for the interannual variation rates. CV for 47 annual error average 2022: 0.68% Non sampling errors are small too, over-coverage, multiple listings, non-response, imputation can be considerated minor. Our data are final after three periods from first release and the different between first and last release is small.
45 and 46 of NACE Rev.2 The sample design attempts to minimize sampling errors. Also, errors are reduced as far as possible during the process survey: in data collection (monitoring and control response rate of editing) and later in non response imputation phase and calculation of aggregate indices. This allows a high degree of reliability of the statistical operation. Random stratified sampling has been used. In order to set out a measurement of the quality from the indices, an approximate relative sampling error is calculated for the interannual variation rates. CV Annual Average 2022: 3.25% Non sampling errors are small too: over-coverage, multiple listings, non-response, imputation… can be considered as minor. Our data are final after five periods from first release and the different between first and last release is small. |
||||||||||||||||||||||||||||||||||||||||||||||||||||
| 13.2. Sampling error | ||||||||||||||||||||||||||||||||||||||||||||||||||||
Retail Trade
Coefficient of variation for turnover in G47 (%)
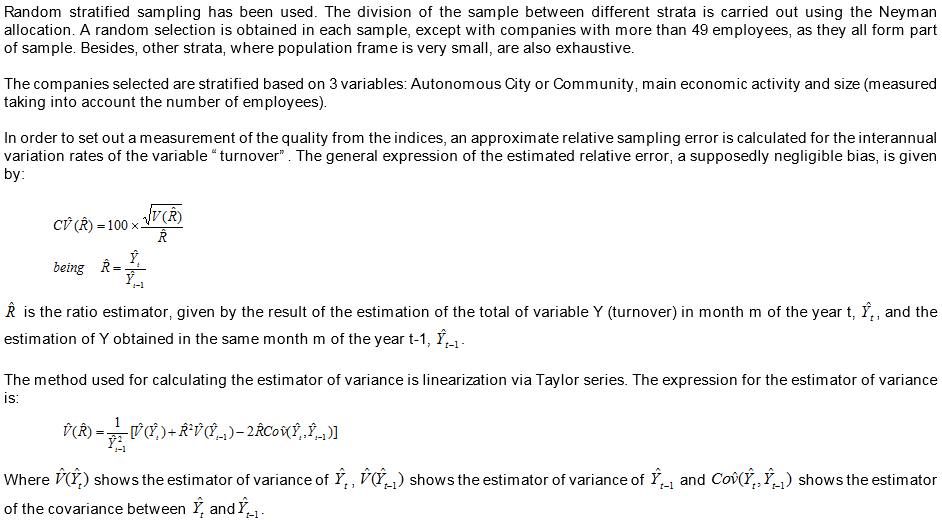
45 and 46 of NACE Rev.2 Random stratified sampling has been used. The distribution of the sample among the different strata is carried out by Neyman allocation. A random sample is obtained in each strata except in enterprises with 200 or more employees, in which all are part of the sample. In certain branches and communities the strata is smaller due to a small population. In these cases, the strata are also exhaustive. The enterprise framework is stratified taking the following variables into account: branch of activity, Autonomous Community and size, measured by number of employees. In order to set out a measurement of the quality from the indices, an approximate relative sampling error is calculated for the interannual variation rates of the variable “number of employees and self_employed persons”. The general expression of the estimated relative error, a supposedly negligible bias, is given by: CV*(R*)=100×(V(R*))1/2/R* , being R*=Y*t/Y*t-1 R* is the ratio estimator, given by the result of the estimation of the total of variable Y (number of employees and self_employed persons) in month m of the year t. Y*t , and the estimation of Y obtained in the same month m of the year t-1, Y*t-1. The method used for calculating the estimator of variance is linearization via Taylor series. The expression for the estimator of variance is: V*(R*)=(1/Y*2t-1) × [(V*(Y*t) + R*2 × V*(Y*t-1) - 2R*Cov*(Y*t,Y*t-1) ] Where V*(Y*t) shows the estimator of variance of Y*t, V*(Y*t-1) shows the estimator of variance of Y*t-1 and Cov*(Y*t,Y*t-1) shows the estimator of the covariance between Y*t and Y*t-1.
|
||||||||||||||||||||||||||||||||||||||||||||||||||||
| 13.3. Non-sampling error | ||||||||||||||||||||||||||||||||||||||||||||||||||||
Retail Trade Impact of over-coverage and multiple listings of the frame We have studied impact of over-coverage and multiple listings of the frame through new units are selected to enter our sample. Every year, in September we select units for annual renovations, 20-25% of sampling units are rotated in non-exhaustive strata, and we select enterprises which belong to exhaustive strata. In the month of January each year, part of the sample is renovated These results have been calculated with new units selected in September 2022: Over-coverage
Multiple listings
% Impact of multiple listings: 0.03%. Under-coverage We don’t have information about it.
Impact of survey instrument, respondent and interviewer Our survey use simple questionnaires where it appears a contact person who could resolve any doubts about it. These contact persons work in INE during a long time and they are prepared to answer any questions. Besides, most of the questionnaires are collected via web. We use selective editing in web questionnaires, for it most of them have passed several editing controls and respondents should correct them or give us an explanation about their data. When we received all data, these are revised using selective editing too. If an important error is detected we recontact with respondent again and we correct it.
Impact of unit and non-response item In 2022, we have 11,511 units in our sample. In it, we have an average rate of non-response small. First release: Average rate, A4. Year 2022 (January-December): 12.16% Last release: Average rate, A4. Year 2022 (January-October): 6.39% First release: Weighted average rate, A4. Year 2022 (January-December): 6.89% Last release: Weighted average rate, A4. Year 2022 (January-October): 2.18%
Impact of data editing, coding and imputation Data editing: a first editing phase, at micro-data level takes place when the respondent fills in the e-questionnaire, we use selective editing in them. Data from others respondent way (paper, telephone, fax) are editing by selective editing too when they are recorded. During the data collection another micro-data level editing phase occurs including all data collection methods questionnaires. After that the selective editing is carried out. Finally the macro-data editing phase takes place. Imputation: monthly and annual rates of units filling in the questionnaire in each elementary aggregates are imputed to those units of the same elementary aggregate that did not answer in the reference period. Elementary aggregates are the most detailed levels for which indices are calculated. % data editing, coding and imputation (October 2022):
Impact of specific models used in estimation In order to ensure the quality of the data adjusted, INE validates the data using the INE Standard quality measures (chapter 4): absence of auto-correlation, verify the appropriateness of the decomposition (specification) through the diagnoses provided by the SEATS program, verify the absence of residual seasonality in the deseasonalised series, verify the absence of residual calendar effects of the deseasonalised series. Our questionnaire could be found in Annex of this document.
45 and 46 of NACE Rev.2 Impact of over-coverage and multiple listings of the frame We have studied impact of over-coverage and multiple listings of the frame through new units are selected to enter our sample. In September of each year, we select units for an annual renovation: 20-25% of sampling units are rotated in non-exhaustive strata and we select new big enterprises who belong exhaustive strata. In January of each year, part of the sample is renovated. These results have been calculated with new units selected in September 2022: Over-coverage - Units don’t belong target population: 2.65% - Units are closed: 9.07% - Units without any data: 13.81% Multiple listings - Units are present more than once in the frame % Impact of multiple listings: 0% Under-coverage We don’t have information about it.
Impact of survey instrument, respondent and interviewer Our survey use simple questionnaires where it appears a contact person who could solve any doubts respondents could have. These contact persons have been working in INE during a long time and they are prepared to answer any question. Besides, most of the questionnaires are collected via web. We use selective editing in web questionnaires, for it most of them have passed several editing controls and respondents should correct them or give us an explanation about their data. When we receive all data, these are revised using selective editing too. If an important error is detected we recontact with respondent again and we correct it.
Impact of unit and non-response item In 2022, we have 27385 units in our sample. We have an small average rate of non_response in it. First release: Average rate, A4. Year 2022 (January-December): 7.36% Last release: Average rate, A4. Year 2022 (January-October): 4.53%
Weighted average rate, A4. Year 2022: 4.29% in first release. Weighted average rate, A4. Year 2022(January-October): 1.46% in last release.
Impact of data editing, coding and imputation Data editing: a first editing phase, at micro-data level takes place when the respondent fills in the e-questionnaire, we use selective editing in them. Data collected by others channels (paper, telephone, fax) are editing by selective editing too when they are recorded. During the data collection another micro-data level editing phase occurs including all data collection methods questionnaires. After that the selective editing is carried out. Finally the macro-data editing phase takes place. Imputation: monthly and annual rates of units filling in the questionnaire in each elementary aggregates are imputed to those units of the same elementary aggregate that did not answer in the reference period. Elementary aggregates are the most detailed levels for which indices are calculated.
% data editing, coding and imputation (October 2022): - editing: 0.97% - imputation: 8.95%
Impact of specific models used in estimation In order to ensure the quality of the data adjusted, INE validates the data using the INE Standard quality measures (chapter 4): verification of the appropriateness of the decomposition (specification) through the diagnoses provided by the SEATS program and verification of the absence of auto-correlation, absence of residual seasonality in the de-seasonalised series and absence of residual calendar effects of the de-seasonalised series. Our questionnaire could be found in Annex of this document. |
||||||||||||||||||||||||||||||||||||||||||||||||||||
|
|||
| 14.1. Timeliness | |||
Retail Trade The RTI is disseminated the last week of the month following the reference, which meets the deadlines set by Eurostat. Indicator Media T1. Year 2022: 30 days. Main aggregates are sent to EU in t+27.
45 and 46 of NACE Rev.2 The publication is disseminated around 50 days after the end of the reference period. |
|||
| 14.2. Punctuality | |||
Retail Trade The RTI is published in accordance with the calendar set by INE at the end of each year..
45 and 46 of NACE Rev.2 The results are published punctually in agreement by the calendar of availability of statistical relating to the moment publications elaborated and spread by the INE. The above mentioned calendar is fulfilled by total punctuality. |
|||
|
|||
| 15.1. Comparability - geographical | |||
Retail Trade The survey is designed homogeneously throughout the geographic area in terms of its methodology, design, the process of collecting information and data editing. Moreover, the European cross-country comparability is ensured by Regulation 1165/98 of the Council of 19 May 1998 concerning short-term statistics, which provides statistical homogeneity with other European Union countries that broadcast this same information. Regulation (EC) No 1165/98 will be repealed with effect from January 1, 2024. European Parliament and Council Regulation (EU) 2019/2152 on European business statistics and Commission Implementing Regulation 2020/1197 laying down technical specifications and arrangements pursuant to Regulation (EU) 2019/2152 will be applicable from January 1, 2021.
45 and 46 of NACE Rev.2 The survey is designed of homogeneous form in the whole geographical area, regarding his methodology, design, the process of collecting information, and data editing. Comparability among EU countries is ensured by the EBS-Regulation (Regulation (EU) 2019/2152 of the European Parliament and of the Council on European business statistics, repealing 10 legal acts in the field of business statistics) and its General Implementing Act (Commission Implementing Regulation 2020/1197 laying down technical specifications and arrangements pursuant to Regulation (EU) 2019/2152 of the European Parliament and of the Council on European business statistics repealing 10 legal acts in the field of business statistic). They provide these statistics with homogeneity regarding the rest of European Union countries, which disseminate the same information. |
|||
| 15.2. Comparability - over time | |||
Retail Trade The RTI was first published in 1995. Due to the base changes made since then (base 2001, base 2005, base 2010 and base 2015) some methodological aspects of the survey have been modified, which has led to breaks in the series, which have been suitably treated to provide a linked series from the first year of publication of the survey to date. The comparability over time, CC1, is the number of elements comparable time series since the last break of it. The number of comparable data, CC1, From January 2000 to December 2022 is: 276. Comparable data for the TOVV:G47
45 and 46 of NACE Rev.2 All the historical series published of the Services Sector Activity Indicators (SSAI) are homogeneous and, therefore, comparable in the time. Since the implantation of the survey there have been base changes of the indexes and changes of the economic activities classification, but to guarantee the comparability of the information over time the INE always has published the retrospective series of the Services Sector Activity Indicators (SSAI) in the new base and in the new classification. The number of comparable data, CC2, from January 2000 to December 2022 is: 276. |
|||
| 15.3. Coherence - cross domain | |||
Retail Trade In the data validation we take into account data of other statistics to ensure consistency among them, we can mention the following: - Structural Business Statistics: Services Sector (SBS) of INE SBS and STS use the same population framework. Our sampling frame is the Statistical Business Register. The sampling design is also quite similar. Both apply stratified sampling with optimum sample allocation. Strata are formed using the following variables: Main economic activity, number of employees and region (NUTS2). In SBS, businesses with 50 or more employees belong to take-all stratum. In STS, for retail trade, the take-all stratum is similar to SBS and for the rest of services, businesses with 200 or more employees belong to take-all stratum. Both uses Horvitz-Thompson estimators but there are some differences in the estimation process. SBS estimators are adjusted by stratum changes and the total population, N, is estimated using their own data. In STS, N comes from updated sampling frame. Besides, SBS is designed to obtain level turnover and STS is designed to study increasing or decreasing of turnover. - Quarterly Spanish National Accounts of INE STS RTD is used as input of Quarterly Spanish National Accounts (QSNA). STS RTD index is used in Aggregates: - Household final consumption expenditure - Gross Value Added on Services activities (Wholesale and Retail trade, Transports and Hotels) Although in these aggregates there are more indicators. We should have into account that QSNA uses more than 250 short term indicators from different institutions. - Sales of the Big Enterprises of the Tax Authority Monthly Tax Authority elaborate a publication about turnover of Large Enterprises from VAT data. Large enterprises are natural or legal persons whose volume of operations exceeded the figure of 6.01 million euros during the immediately preceding calendar year, this definition is different that European legislation use. Large enterprises operate in all branches of activity, in some the representation is practically exhaustive while in others dominated by small enterprises don’t weight so much. Number of large enterprises change every year. They use a Unit Value Index STS include all units, large and small, our sample has a rotation around 20-25%, we use a Laspeyres Chain Index.
45 and 46 of NACE Rev.2 In the data validation we take into account data of other statistics to ensure consistency between them, such as: Structural Business Statistics: Services Sector (SBS) of INE SBS and STS use the same Population framework. Our sampling frame is the Statistical Business Register. The sampling design is also quite similar. Both apply stratified sampling with optimum sample allocation. Strata are formed using the following variables: Main economic activity, number of employee and region (NUTS2). In SBS, businesses with 50 or more employees belong to take-all stratum. In STS, for retail trade, the take-all stratum is similar to SBS and for the rest of services, businesses with 200 or more employees belong to take-all stratum. Both use Horvitz-Thompson estimators but there are some differences in the estimation process. SBS estimators are adjusted by stratum changes and the total population, N, is estimated using their own data. In STS, N comes from updated sampling frame. Besides, SBS is designed to obtain level turnover and STS is designed to study increasing or decreasing of turnover. Quarterly Spanish National Accounts of INE STS Services is used as input of Quarterly Spanish National Accounts (QSNA). Nowadays, both of them are in base year 2015. STS Services index is use in Aggregates: Household final consumption expenditure Gross Value Added on Services activities: - Wholesale and Retail trade, Transports and Hotels; - Information and communication; - Professional activities. Gross Fixed Capital Formation Intellectual Property Products Although in these aggregates there are more indicators. We should have into account that QSNA uses more than 250 short term indicators from different institutions. Sales of the Big enterprises of the Tax Authority Monthly Tax Authority elaborate a publication about turnover of Large enterprises from VAT data. Large enterprises are natural or legal persons whose volume of operations exceeded the figure of 6.01 million euros during the immediately preceding calendar year, this definition is different that European legislation use. Large enterprises operate in all branches of activity, in some the representation is practically exhaustive while in others dominated by small enterprises don’t weight so much. Number of large enterprises change every year. They use a Unit Value Index STS include all units, large and small, our sample has a rotation around 20-25%, we use a Laspeyres Chain Index. |
|||
| 15.4. Coherence - internal | |||
Retail Trade The coherence between variables is contrasted in all phases of the statistical process.
45 and 46 of NACE Rev.2 The coherence is a fundamental question both in the exposition of the methodology of the survey and in all his process of production. The coherence between the variables is confirmed in all the phases of the statistical process and they do not find incoherences. |
|||
|
|||
Retail Trade Efforts have been made so that the questionnaire contains all the necessary information while its design is as simplified as possible to be easily completed by the enterprises in the sample, in order to reduce as far as possible the overhead of certain reporting units that would result from the completion of multiple surveys in one year.
Burden (respondents) hours per year: 1,656 h. Cost (NSI) hours per year: 21,417 h.
45 and 46 of NACE Rev.2 With the intention of reducing significantly the burden of the units informants, there has been tried that the questionnaire contains all the necessary information and at the same time his design is as simplified as possible to facilitate the answer of respondents, in order to reduce as far as possible the burden of certain reporting units informants that have to fill in of multiple surveys in the same year. To avoid the fatigue of the informants and the aging of the sample, allowing the selection of enterprises of new creation, there is realized an annual rotation of 25%. With regard to the cost associated with the collection and production of the statistical products, in case of the SSAI the budgetary Forecasts in the annual Program 2022 reach an amount of 3,770.34 (thousands of Euros). This budget includes turnover and employment. Burden (respondents) hours per year: 9,797 h Cost (NSI) hours per year: 51,650 h |
|||
|
|||
| 17.1. Data revision - policy | |||
Retail Trade Revised data are used both for the National dissemination and to obtain the STS data transmitted to Eurostat, so the same policy is applied to the STS data released nationally and sent to Eurostat. The revision policy adopted for the Retail Trade raw data at INE Spain encompasses several types of revisions:
The revision policy regarding seasonally adjusted data comprises two types of revisions: - Concurrent adjustment: partially concurrent adjustment is carried out monthly. With the new data received:
- Current adjustment: annually the model (including the intervention variables of the outliers and the regressors for the correction of calendar effects) is identified, the parameters of ARIMA, of the regressors for the correction of calendar effects and of the intervention variables of the outliers) are estimated and the filters are calculated and set. The link to the revision policy for raw data adopted at INE Spain is the following. Regarding the revision for seasonally adjusted data is available in the following link. There is no official revision calendar, each indicator has its own revision calendar.
45 and 46 of NACE Rev.2 Revised data are used both for the National dissemination and to obtain the STS data transmitted to Eurostat, so the same policy is applied to the STS data released nationally and sent to Eurostat. The revision policy adopted for the raw data at INE Spain encompasses several types of revisions: - Regular revisions are carried out on a monthly basis. These revisions consist on checking the new available information for the data of the reference month plus the late data of previous months that have already been released. Annually, an overhaul of the seasonal adjustment models takes place in order to update the models. - Major revisions are performed on the occasion of rebasing our methodological changes like changes in definitions and classifications as well as legal changes like those due to new Regulations or updates in the already existing. - Non-scheduled revisions take place rarely in the case of detecting an error in the statistical process. The revision policy regarding seasonally adjusted data comprises two types of revisions: - Concurrent adjustment: partially concurrent adjustment is carried out monthly. With the new data received:
- Current adjustment: annually the model (including the intervention variables of the outliers and the regressors for the correction of calendar effects) is identified, the parameters of ARIMA, of the regressors for the correction of calendar effects and of the intervention variables of the outliers) are estimated and the filters are calculated and set. The link to the revision policy for raw data adopted at INE Spain is the following: Regarding the revision for seasonally adjusted data is available in the following link: INE Standard for the Adjustment of Seasonal Effects and Calendar Effects in Short-term Series There in no official revision calendar, each indicator has its own revision calendar. |
|||
| 17.2. Data revision - practice | |||
Retail Trade The first time the index of a given month is published, it provides provisional data, which are not final until two months later. Meanwhile the index is revised using the same data modifications that have occurred since the date of the first publication, due for instance to the replacement of the estimated data (for management issues) by the updated data completed by the enterprise. However, the series corrected for calendar effects and seasonal effects are reviewed in full every month. A6 indicator, average size of revisions, where revision is defined as the difference between final and preliminary estimators, is used for data revision practice. The quality indicators used in data revision are: MAR (Mean Absolute Revision), RMAR (Relative Mean Absolute Revision) and MR (Mean Revision). TOVV A6_MAR (December 2022): 0.09
TOVV Calendar adjusted A6_MAR (December 2022): 0.10 The benchmarking isn't carried out. Revisions aren’t carried out either in a business account quarterly/annual business or on national accounts and on structural business statistics either. Major revisions are informed in advance in the press release the same day of dissemination, although main users are informed in advance. Besides, from 2015 we comunicate main updates in our website.
45 and 46 of NACE Rev.2 The first time the index of a given month is published, it provides provisional data, which are not final until four months later. Meanwhile the index is revised using the same data modifications that have occurred since the date of the first publication, due for instance to the replacement of the estimated data (for management issues) by the updated data completed by the enterprise. However, the series corrected for calendar effects and seasonal effects are reviewed in full every month. A6 indicator, average size of revisions, where revision is defined as the difference between final and preliminary estimators, is used for data revision practice. Estimators are calculated on a number of reference periods: MAR (size of revisions) and RMAR (size of each revision as compared to the last estimate). Original series: A6_MAR (December 2022) =0.0713973052 A6_RMAR (December 2022) = 0.0036244648% A6_MR (December 2022)= 0.071397 A6_MaxARt = 0.203053 ( Annual variation rate March 2019_ March 2020)
Series adjusted for calendar effects: A6_MAR (December 2022) = 0.1376621387 A6_RMAR (December 2022) = 0.0069948603% A6_MR (December 2022)=0.137662 A6_MaxARt = 1.255844 (Annual variation rate March 2020_ March 2021)
MAR, RMAR, MR and MaxARt values were obtained with the information of its last 36 final months being December 2022 the last one. The benchmarking isn't carried out. Revisions aren’t carried out either in a business account quarterly/annual business or on national accounts and on structural business statistics either. Major revisions are informed in advance in the press release the same day of dissemination, although main users are informed in advance. Besides, from 2015 we will communicate main updates in our website. |
|||
|
|||
| 18.1. Source data | |||
Retail Trade For the survey data, we resort to the use of questionnaires to enterprises whose main activity is Division 47 of section G of the Statistical Classification of Economic Activities in the European Community (NACE Rev.2). Stratified sampling is used. The distribution of the sample between the different layers is done by Neyman allocation. In each stratum, a random selection is made, except for enterprises with more than 49 employees who fill out all parts of the sample and other strata where population frame is very small that are also exhaustive. The selected enterprises were ranked based on three variables: main activity, size (measured by number of employees) and region. The sample size is calculated to provide indicators of the variables turnover and employment representative. The sample consists of approximately 12,000 enterprises. Rotations are performed annually, with approximately 20-25% of the sample, which incorporates all new businesses depth stratum, removing those which have died, were not found, were erroneously included fused and where small businesses to replace that the completion of questionnaires required a great effort. The annual rotation process involves making a new selection of sampling units representing commercial distribution in Spain and a re-weighting of such units so that the sample data to the population rise. The rotation of the sample for the index calculation is done in January of each year, at that time elevation factors and weightings are also updated.
45 and 46 of NACE Rev.2 Type of source Statistical survey. Frame on which the source is based The source is the DIRCE (INE's business register). The DIRCE has been used as the framework for the survey, which contains information on the main economic activity and on the number of employees in enterprises, enabling their stratification according to these concepts. Also featured in this directory is other data on the identification and location of the statistical units, which are necessary for collecting the information correctly. The data contained in the DIRCE is obtained using administrative sources, mainly coming from the Tax Agency and Social Security, and is completed with information from the statistical operations of the INE. Sample or census Some strata are investigated exhaustively (strata with enterprises with 200 or more employees) and in the remaining strata, a systematic selection with a random start is carried out, having previously ordered enterprises by size. Criteria for stratification A stratified one-stage sampling is used, where, as a general rule, the enterprise population has been stratified according to the cross of three variables: principal activity at 4-digit level of NACE Rev 2, the number of employees and region. Information from the Structural Business Survey has been used in order to obtain the sample sizes taking into account the weight of the different strata in the total turnover for each activity and information of variance of the variable number of employees by stratum from the Business Register. Frequency of updating the sample A fixed sample is used every year. At the end of the year the new enterprises belonging to the exhaustive strata are included. One quarter (25%) of the rest of the sample is substituted including enterprises that died during the year. With the change of base year a complete update is carried out. |
|||
| 18.2. Frequency of data collection | |||
Retail Trade Data collection is done monthly.
45 and 46 of NACE Rev.2 Data is collected monthly. |
|||
| 18.3. Data collection | |||
Retail Trade The reporting enterprises send their data through the Internet, by mail (paper completed questionnaires), by fax or by phone.
45 and 46 of NACE Rev.2 The questionnaire used is a specific monthly questionnaire named “Indicadores de Actividad del Sector Servicios”. The questionnaire is sent by post and there are also telephone and fax contacts and the enterprises can fill the questionnaire out on the Internet. |
|||
| 18.4. Data validation | |||
Retail Trade At the stage of completion of the questionnaire, a system that detects inconsistencies is used so that the respondent is advised and is required to confirm or modify the information provided. When this information is recorded by INE's own staff, there is a control system of recording which warns about possible inconsistencies that may arise. In this process, for data where there are discrepancies, the staff responsible for the collection of information is brought into contact with the informant to confirm or modify the information provided. Once all the information is compiled, it performs a coverage control of information,in order to ensure the completeness of the recorded data and detect duplicates and coverage errors, non-response, etc.
45 and 46 of NACE Rev.2 At the stage of completion of the questionnaire, a system that detects inconsistencies is used so that the respondent is advised and is required to confirm or modify the information provided. |
|||
| 18.5. Data compilation | |||
Retail Trade The questionnaires are collected by INE data collection staff and there is a first cleansing of errors according to a set of edits. Microediting consists on validating data from each local unit, attending to its historical values. The analysis establishes monthly and annual comparisons so that the data is validated without contacting the informants when the evolution is repeated periodically. Next, at centralized level, the selective editing phase, imputation (non-response is imputed using the data of the previous month of the non-respondent units and the variation rate of the units in the same stratum) and the macroediting process take place. In some cases, manual editing is required, for example non responding large units. Finally estimators are calculated by aggregating the elementary indices taking into account the weightings. In the last phase, the dissemination files together with the press release are prepared according to the dissemination breakdowns. The indexes are obtained using a chaining-linking. The elementary indices are calculated from the respondents (imputed in case of non-response) common to the reference month and the previous december. The weighting variable is calculated with the turnover of December (t-1) from our own sample in base 2015, they have been updated according to the samples used in new base.
45 and 46 of NACE Rev.2 The questionnaires are collected by INE data collection staff and there is a first cleansing of errors according to a set of edits. Microediting consists on validating data from each local unit, attending to its historical values. The analysis establishes monthly and annual comparisons so that the data is validated without contacting the informants when the evolution is repeated periodically. Next, at centralized level, the selective editing phase, imputation (non-response is imputed using the data of the previous month of the non-respondent units and the variation rate of the units in the same stratum) and the macroediting process take place. In some cases, manual editing is required, for example non responding large units. Finally estimators are calculated by aggregating the elementary indices taking into account the weightings. In the last phase, the dissemination files together with the press release are prepared according to the dissemination breakdowns. The indexes are obtained using a chaining-linking. The elementary indices are calculated from the respondents (imputed in case of non-response) common to the reference month and the previous december. The weighting variable is calculated with turnover from SBS 2015, and these weights are updated by Services indexes in base 2015 for have weights in December (t-1) in order to calculate chain linking index. |
|||
| 18.6. Adjustment | |||
Retail Trade For the seasonal adjustment of the series of the Retail Trade Indices, INE Spain has followed the established standard to adjust figures for seasonal and calendar effects. This standard follows the recommendations included in ESS guidelines in seasonal adjustment. INE standard is available in the following link. Calendar effects are defined as the impact that occurs in the time series of a variable due to the different structures presented in the months (or quarters) of different years (both in length and composition), if maintained constant the other factors influencing this variable. To overcome this problem and obtain comparable series, these series are adjusted taking into account the following effects: working days, Easter and leap years. To collect these effects RegARIMA models with four centered variables of intervention for calendar effects have been used. Once the calendar effects have been removed, indices are adjusted for seasonal effects. Seasonal fluctuations are movements that occur with similar intensity every month, every quarter or every season of the year and are expected to sustain over time. Series adjusted for seasonal and calendar effects provide an estimate of the "new effects" in the series (changes in trend, cycle and irregular component). Since base 2010, to complete the analysis of the situation, most series are disseminated not only unadjusted but also calendar adjusted and seasonally and calendar adjusted. The software used for seasonal adjustment is JDemetra+ 2.2.2. And the method used is TRAMO/SEATS. The models are revised annually and the regression coefficients are recalculated annually. The parameters and components are re-estimated monthly. The adjusted series are calculated on a monthly basis and the whole length of the time series is revised. The direct adjustment is used, so there is no consistency amongst the different breakdown. To assess the performanceof the seasonal and calendar effect the following methods are applied:
To assess the effects of the Covid crisis and the war in Ukraine, monthly automatic AOs are included in the models. Annually during the model analysis some of these AOs are changed to LS or TC.
45 and 46 of NACE Rev.2 Calendar effects: the impact that takes place in the time series of a variable due to the different structure of the months different years (both in length and composition) will remain constant if other factors influence this variable. The SSAI is a very sensitive indicator of calendar effects since a holiday in a particular month represents a decrease in the proportional turnover of such month. To overcome this problem and obtain a number that compares the production over time evenly, the series are corrected taking into account the following schedule: trading days, Easter and leap year. After editing the calendar effects, seasonal effects are removed. Seasonal fluctuations are movements that occur with similar intensity in each month and are expected to continue to occur. The seasonally adjusted series, i.e. adjusted for seasonal and calendar effects, provide an estimate of the "new" factors in a series (changes in trend, cycle and irregular component). The method is based on regression models with the intervention of variables of the three effects previously mentioned. We use JDEMETRA program. The adjusted series are published jointly with the uncorrected series, to complete the analysis of the situation. For the effect of the COVID crisis in 2020 we've had to analyse outliers monthly. Annexes: Adjustment TOVT Retail Trade Adjustment TOVV Retail Trade SSAI - SEASONAL ADJUSTMENT |
|||
|
|||
None. |
|||
|
|||
|
|||
| Questionnaire |
|||