|
 |
| For any question on data and metadata, please contact: Eurostat user support |
|
|||
| 1.1. Contact organisation | Hellenic Statistical Authority (ELSTAT) |
||
| 1.2. Contact organisation unit | Economic and Short-Term Indicators Division Retail Sales Value Index Section |
||
| 1.5. Contact mail address | 46 Pireos & Eponiton str. 185.10 Piraeus Greece |
||
|
|||
| 2.1. Metadata last certified | 30/10/2017 | ||
| 2.2. Metadata last posted | 30/10/2017 | ||
| 2.3. Metadata last update | 30/10/2017 | ||
|
|||
| 3.1. Data description | |||
1. Index of Persons Employed in Retail Trade The index of persons employed in retail trade refers to the whole country. The overall index covers the economic activity classes with codes 4711-4799 of NACE Rev. 2. Four aggregated levels of economic classes are produced as follows:
2. The Index of Hours Worked in Retail Trade The index of hours worked in retail trade refers to the whole country and covers the economic activity classes with codes 4711-4799 of NACE Rev. 2. The index of hours worked is compiled at the division 47 level.
3. The Index of Gross Wages and Salaries in Retail Trade The index of gross wages and salaries in retail traderefers to the whole country and covers the economic activity classes with codes 4711-4799 of NACE Rev. 2. The index of gross wages and salaries in retail trade is compiled at the division 47 level. |
|||
| 3.2. Classification system | |||
NACE Rev.2 statistical classification of economic activities is applied, in conformity with Regulation (EC) 1893/2006 of the European Parliament and Council of 20 December 2006 establishing the statistical classification of economic activities NACE Revision 2. |
|||
| 3.3. Coverage - sector | |||
The indices of person employed, hours worked, and gross wages and salaries in retail trade (2010=100.0), according to NACE Rev. 2 classification, cover the economic activity classes identified by codes 4711 to 4799 inclusive. |
|||
| 3.4. Statistical concepts and definitions | |||
1. Index of Persons Employed in Retail Trade The purpose of the index of persons employed in retail trade is to measure, on a quarterly basis, changes in the number of persons employed in retail trade. This index is compiled in order to meet increasing demand for data concerning employment in retail trade, which resulted mainly after the signing of the Treaty on Economic and Monetary Union (EMU). The compilation of the index includes the number of persons employed in the enterprise irrespective of their status (employers, own-account workers, salaried employees, unpaid family workers) and the nature of their work (managers, sales persons and auxiliary staff) and irrespective of whether they work on a provisional or seasonal basis, full time or part time, with or without remuneration. Employment figures are recorded on the last working day of the reference quarter and refer to the total number of persons working for the enterprise, as follows:
2. The Index of Hours Worked in Retail Trade The purpose of the hours worked index is to show the development in the volume of work done in retail trade from the total of persons employed (employers, own-account workers, salaried employees, unpaid family workers). The total number of hours worked represents the aggregate number of hours actually worked for the output of the enterprise during the reference period (quarter). Included are hours actually worked during normal working hours; hours worked in addition to those; time which is spent at the place of work on tasks such as preparing the site and time corresponding to short periods of rest at the work place. This variable excludes hours paid but not actually worked such as for annual leave, holidays and sickness leave. It also excludes meal breaks and commuting between home and work.
3. The Index of Gross Wages and Salaries in Retail Trade The purpose of the gross wages and salaries index is to approximate the development of the gross wage and salaries bill in retail trade. Wages and salaries are defined as the total remuneration, in cash or in kind, payable to all persons counted on the payroll (including home workers), in return for work done during the accounting period, regardless of whether it is paid on the basis of working time, output or piecework and whether it is paid regularly. |
|||
| 3.5. Statistical unit | |||
The observation unit is the enterprise. |
|||
| 3.6. Statistical population | |||
In the framework of the survey carried out for the compilation of the above indices (2010=100.0), it was decided to include 41.801 retail trade enterprises listed in the Business Register (BR) of ELSTAT having an annual turnover (in 2010) equal to or higher than 200.000 euro. |
|||
| 3.7. Reference area | |||
The indices of person employed, hours worked, and gross wages and salaries in retail trade cover the whole country, with data coming from 58 Regional Units. No activities outside the national territory are covered. |
|||
| 3.8. Coverage - Time | |||
a. Revised index of persons employed in retail trade series (2010=100.0) is available on a quarterly basis since 1st quarter 2000. b. Indices of hours worked, and gross wages and salaries in retail trade (2010=100.0) are quarterly indices that are first compiled in 2016 and backdated data since 1st quarter 2010. |
|||
| 3.9. Base period | |||
Base year : 2010=100.0 |
|||
|
|||
Indices, quarter-on-quarter growth rates (%), year-on-year growth rates (%) |
|||
|
|||
Quarter |
|||
|
|||
| 6.1. Institutional Mandate - legal acts and other agreements | |||
1. The General Legislation concerning the organization and operation of ELSTAT is as follows :
The legal framework governing the organization and operation of ELSTAT is posted on the website of ELSTAT: http://www.statistics.gr/en/legal-framework
2. The legal EU framework on the compilation of theindexofpersons employed in retail Trade is as follows:
3. The indices of hours worked, and gross wages and salaries are governed by the Commission Regulation (EC) No 329/2009 (http://eur-lex.europa.eu/legal-content/EN/TXT/PDF/?uri=CELEX:32009R0329&from=EN) amending Council Regulation (EC) No 1165/98 concerning short-term statistics as regards the updating of the list of variables, In addition, theses indices are governed by the Regulation No.1893/2006 of the European Parliament and of the Council establishing the statistical classification of economic activities NACE Rev.2. |
|||
| 6.2. Institutional Mandate - data sharing | |||
Not applicable. |
|||
|
|||
| 7.1. Confidentiality - policy | |||
The issues concerning the observance of statistical confidentiality by the Hellenic Statistical Authority (ELSTAT) are arranged by articles 7, 8 and 9 of the Law 3832/2010 as in force, by Articles 8, 10 and 11(2) of the Regulation on Statistical Obligations of the agencies of the Hellenic Statistical System and by Articles 10 and 15 of the Regulation on the Operation and Administration of ELSTAT. More precisely: ELSTAT disseminates the statistics in compliance with the statistical principles of the European Statistics Code of Practice and in particular with the principle of statistical confidentiality. |
|||
| 7.2. Confidentiality - data treatment | |||
b) the research proposal indicates in sufficient detail the set of data to be accessed, the methods of analyzing them, and the time needed for the research; c) a contract specifying the conditions for access, the obligations of the researchers, the measures for respecting the confidentiality of statistical data and the sanctions in case of breach of these obligations has been signed by the individual researcher, by his/her institution, or by the organization commissioning the research, as the case may be, and by ELSTAT.
- the level of detail at which statistical data can be disseminated, so as the identification, either directly or indirectly, of the surveyed statistical unit is not possible; - the anonymization criteria for the microdata provided to users; - the granting to researchers access to confidential data for scientific purposes.
ELSTAT, by its decision, may impose a penalty amounting from ten thousand (10,000) up to two hundred thousand (200,000) euros to anyone who violates the confidentiality of data and/or statistical confidentiality. The penalty is always imposed after the hearing of the defense of the person liable for the breach, depending on the gravity and the repercussions of the violation. Any relapse constitutes an aggravating factor for the assessment of the administrative sanction. |
|||
|
|||
| 8.1. Release calendar | |||
At the end of each year, ELSTAT publishes a release calendar with the precise release dates of statistics for the following year. |
|||
| 8.2. Release calendar access | |||
The calendar is distributed to the press and is available to all interested parties free of charge. This calendar is also posted on the website of the ELSTAT (http://www.statistics.gr/en/calendar) under the item “Calendar of Press Releases”. |
|||
| 8.3. Release policy - user access | |||
Data are released simultaneously to all interested parties and users through the Press Release of the Index of Persons Employed in Retail Trade that is posted on the website of ELSTAT (http://www.statistics.gr/en/statistics/-/publication/DKT12/-) according to the release calendar. This press release is also available by fax or e-mail to all interested parties. In addition, data are transmitted to Eurostat on a predefined date, concomitantly with their national publication. Neither users nor the government have access to the data prior to their publication. |
|||
|
|||
The indices are produced and disseminated on a quarterly basis. |
|||
|
|||
| 10.1. Dissemination format - News release | |||
Every quarter, 75 days after the end of the reference quarter, at 12.00, a Press Release is published, which presents the calculated indices of persons employed, hours worked, and gross wages and salaries in retail trade, in Greek and English. The press release is sent, free-of-charge, and mostly by email to the press and to other interested parties. The press release is also available on the website of ELSTAT : http://www.statistics.gr/en/statistics/-/publication/DKT12/- |
|||
| 10.2. Dissemination format - Publications | |||
The data are announced quarterly with a press release on specified dates. In the Press Release, they are published:
Tables that contain the above indices as well as quarter-on-quarter growth rates and year-on-year growth rates (+ or -) are posted on the ELSTAT’ website: http://www.statistics.gr/en/statistics/-/publication/DKT12/-
Moreover, data are published in the following publications:
|
|||
| 10.3. Dissemination format - online database | |||
Not applicable |
|||
| 10.4. Dissemination format - microdata access | |||
Users can be given data or other statistical analysis, after submitting an application to the Statistical Information Dissemination Section - ELSTAT, 46, Pireos & Eponiton Str, 80847 Piraeus, Tel ++30 213 135 2173 fax ++30 213 135 2022, e-mail: data.dissem@statistics.gr For confidential reasons, users can have access to micro-data, only under strict conditions and with respect to the relevant process. |
|||
| 10.5. Dissemination format - other | |||
| 10.6. Documentation on methodology | |||
The methodology for the compilation of indices is laid down by ELSTAT, taking into account international practices and, in particular, Eurostat’s recommendations, guidelines and standards that are included in the following manuals:
A special methodological paper on the compilation of the index is posted on the website of ELSTAT containing detailed information on the sources and the methodology used through the link: http://www.statistics.gr/en/statistics/-/publication/DKT12/- |
|||
| 10.7. Quality management - documentation | |||
A user oriented quality report is available at the link : http://www.statistics.gr/en/statistics/-/publication/DKT12/- |
|||
|
|||
| 11.1. Quality assurance | |||
Quality checks and validation of data are carried out during the whole process of the compilation of the indices, from the data collection stage to the final compilation of the index.
More specifically:
The Hellenic Statistical Authority (ELSTAT) aims to ensure and further improve the quality of statistics produced and maintain the confidence of users in them. This is achieved through the Quality Policy of ELSTAT which is posted on the website of ELSTAT and is available at the following links: |
|||
| 11.2. Quality management - assessment | |||
The indices are considered to be of highly quality (reliable index), because:
|
|||
|
|||
| 12.1. Relevance - User Needs | |||
The indices meet national needs and the needs of European users. Generally, the index provides statistical information necessary to improve the competitiveness and performance of the business community.
The main national users of the indices are as follows:
At international level, the Index is used by Eurostat, International Monetary Fund (IMF), the United Nations (UN), the European Central Bank (ECB), the Organisation for Economic Co-operation and Development (OECD), the International Labour Organization (ILO) etc. |
|||
| 12.2. Relevance - User Satisfaction | |||
The Section monitors user needs on a regular basis, in order to satisfy them. Generally, there is a smooth cooperation, through prompt response to users’ requests. Users’ comments are positive.
Moreover: a. User Satisfaction Survey ELSTAT conducts a user satisfaction survey every six months the results of which are published in the “Library’s Newsletter” a bilingual publication issued by the Library Section and the Statistical Data Dissemination Section utilizing the user questionnaire. This publication presents half-yearly figures of the number of users, in combination with some other variables, such as the degree of coverage of requests, the type of the requested statistics, and the dissemination of statistical information. These characteristics are tabulated into absolute values and in percentages. More information on the results of the user satisfaction surveys, is available at the following link on the portal ELSTAT: http://www.statistics.gr/en/user-satisfaction-survey
b. User Conference According to the Annual Statistical Program, ELSTAT has been conducting “User Conference” since 2010, on annual base, in which participants are representatives from institutions of private / public sector and educational / research institutions. The user conferences provide an important opportunity to ELSTAT to collect comments and suggestions from users about the dissemination format of statistics, the data access and the extent to which the statistics that are needed are available. The user conferences significantly help the ELSTAT to draw useful conclusions on the areas where the statistical products and services can be improved in order to meet the evolving needs of users. These conclusions are incorporated in the annual and medium term statistical programs of ELSTAT More information on the results of the user conferences is available at the following link on the portal ELSTAT: http://www.statistics.gr/en/user-conference |
|||
| 12.3. Completeness | |||
The compilation of indices of persons employed, hours worked, and gross wages and salaries in retail trade and the data provided are in line with the relevant EU Regulations. |
|||
|
||||||||||
| 13.1. Accuracy - overall | ||||||||||
The sources of errors that impact on the accuracy of indices are sampling and non-sampling errors.
a) The sampling errors of the indices arise from the fact that not all units of the target population are enumerated, but only a sample of them. The sample size of the survey ensures accurate estimates for the overall index and for the sub-indices. b) As regards non-sampling errors, these are mostly due to erroneous counting (measurement errors) and to the non-response of some enterprises. Any measurement errors are detected by means of quality checks and are duly corrected. Concerning the non response, telephone contacts and field visits are conducted in order to increase the response rate and to reduce the impact of non response on the accuracy of indices.
Therefore, the indices are characterized by high accuracy. |
||||||||||
| 13.2. Sampling error | ||||||||||
Sample survey is conducted in order to compile the indices, and thus sampling errors arise in the estimates of indices. More specifically:
1. Index of persons employed The sampling errors, expressed in coefficient of variations (%), of quarterly growth rates of the persons employed index in 4th quarter 2015 by main retail store categories are as follows:
2. Indices of hours worked, and gross wages and salaries The sampling errors, expressed in coefficient of variations (%), of quarterly growth rates for the hours worked index and the gross wages and salaries index in 4th quarter 2015 at the division 47 level are 1.4% and 1.8%, respectively. |
||||||||||
| 13.3. Non-sampling error | ||||||||||
a. Coverage error No coverage errors are observed in the Business Register of ELSTAT, on the basis of which the survey on the compilation of the index was designed. b. Measurement error Any measurement errors during the data collection process are detected by means of quality checks and are duly corrected. c. Non response error In the case of non response, the surveyed enterprise is contacted by telephone, or is sent a reminder by fax or e-mail, or even the competent staff may pay a visit to the enterprise in order to response. In addition, in the estimation process of the index, the base weights of the respondent enterprises are adjusted to compensate for non-response and to make weighted sample totals conform to known population totals by categories of aggregated economic activity classes and by the size of enterprises. d. Processing error All tasks engaged to the processing procedure (e.g. weighting, calculations, tabulation etc) are performed by using a special software application, in order to eliminate processing errors. |
||||||||||
|
|||
| 14.1. Timeliness | |||
The indices are published 75 days after the end of the reference quarter. |
|||
| 14.2. Punctuality | |||
The indices are published according to the pre-announced release calendar. |
|||
|
|||
| 15.1. Comparability - geographical | |||
The Short Term Statistics (STS) Regulations and the STS methodological guidelines are applied for the compilation of the indices, thus ensuring a good comparability between the Greek indices of persons employed, hours worked, and gross wages and salaries in retail trade and the other national and European respective indices, taking always into account any special conditions prevailing in each country, which may dictate minor methodological deviations. |
|||
| 15.2. Comparability - over time | |||
a. Time series of index of persons employed in retail trade with base year 2010=100.0, which is available from the 1st quarter 2000 and onwards, is considered fully comparable over time. b. Time series of indices of hours worked, and gross wages and salaries in retail trade with base year 2010=100.0, which is available from 1st quarter 2010 and onwards, is considered fully comparable over time. |
|||
| 15.3. Coherence - cross domain | |||
a. Coherence between indices and Structural Business Survey (SBS) According to the Regulations No 58/97 of the Council and No 295/2008 of the European Parliament and Council, Structural Business Survey (SBS) is conducted in order to compile annual structural business statistics. Among the other divisions of economic activity, the SBS covers the division of the retail trade. As the structural business statistics are annual, comparisons are performed to examine the coherence of growth rates between: a) the average annual index of persons employed and the number of persons employed produced by SBS and b) the average annual index of gross wages and salaries and the value of gross wages and salaries produced by SBS. The differences observed in the growth rates between the indices and the statistics coming from SBS are due to the fact that for the compilation of the index a common sample of enterprises is used for every quarter, which is updated when the index is revised with new base year, while in the SBS surveys the sample of enterprises is updated on a yearly basis, except of very large size enterprises. The common sample of enterprises that is used in the index ensures accurate presentation of the evolution of the index over several time periods.
b. Coherence between indices and statistics of Labour Force Survey (LFS) Labour Force Survey is harmonized with European legislation. The principal legal act is the Council Regulation (EC) No. 577/98 that stipulates the provisions on design, survey characteristics and decision making processes. In addition, the survey framework was modified in successive Commission regulations (Regulation (EC) No 1372/2007, Regulation (EC) No 2257/2003 and Regulation (EC) No 1991/2002). The survey produces statistics of employment and unemployment, and it covers population residing in private households, and staying (or intend to stay) at least 1 year in Greece. Individuals who permanently reside in collective houses (i.e. hospitals, hotels, asylums, homes for the elderly, orphanages, etc) are not covered by the survey. More information on the Labour Force Survey is available at the link: http://www.statistics.gr/en/statistics/-/publication/SJO01/- Among the other divisions of economic activity, the LFS covers the division of the retail trade. Since the Labor Force Survey records the average quarterly employment while the index of persons employed records the employment for a specific day of quarter, then in order to examine the coherence of data of the LFS and the index of persons employed (STS), we compare the growth rates between the average annual index of persons employed (STS) and the annual average employment produced by labour Force Survey (LFS). The correlation coefficient between the growth rates of the average annual index of persons employed and the average annual employment derived from LFS based on results for the years 2008-2016 amounts to 0.81. Any differences observed in the growth rates between a) the index of persons employed and the number of persons employed produced by LFS and b) the index of hours worked and the hours worked produced by LFS are mostly due to the fact that for the compilation of the index a sample of enterprises is used, while for the compilation of statistics in LFS, a sample of households is used. |
|||
| 15.4. Coherence - internal | |||
The indices are internally coherent. Higher-level aggregates derive from detailed indices according to well-defined procedures. |
|||
|
|||
a. Regarding the staff of ELSTAT, the annual cost in hours worked amount to 2,483 b. Regarding the respondents, the annual average response burden in hours worked is 15.4 minutes per enterprise. |
|||
|
|||
| 17.1. Data revision - policy | |||
The indices are published 75 days after the end of the reference quarter. Data are provisional when first released. The indices are revised once, simultaneously with the publication of the next quarter. After this revision, the indices become final. In accordance with the requirements of article 11 of the Council Regulation (EC) No 1165/98 concerning short-term statistics, short-term indices are revised every five (5) years, particularly in calendar years ending in 0 or 5. The purpose of the revision of the indices of persons employed, hours worked, and gross wages and salaries in retail trade is to adapt the indices to structural changes of retail trade sector by renewing the sample of enterprises that are surveyed, as well as the extrapolation factors (weighting) that are used (implementation of new weighting scheme). In addition, the index applies the Revision Policy of ELSTAT, available at the link : http://www.statistics.gr/en/policies The same revision policy for all kind of revisions is applied to data released nationally and to those transmitted to Eurostat, in order to assure coherence. |
|||
| 17.2. Data revision - practice | |||
The data released for the reference quarter are provisional and are published together with the revised data of the previous quarter. The indices are revised and considered to be final, simultaneously with the publication of the next quarter. |
|||
|
||||||||||||||
| 18.1. Source data | ||||||||||||||
The survey for the compilation of the indices covers 41,801 retail trade enterprises listed in the Business Register having an annual turnover (in 2010) equal to or higher than 200.000 euro. Out of these enterprises a random sample of 754 enterprises was selected.
The one stage stratified random sampling method was applied, employing the enterprise as a surveyed unit. The sampling frame used for the sample design was based on the Business Register (BR) of the ELSTAT.
The enterprises included in the survey were stratified as follows:
a. By 11 categories of aggregated economic activity classes as follows: 1. Supermarkets 2. Department stores 3. Food, beverages and tobacco 4. Automotive fuel-lubricants 5. Pharmaceuticals and cosmetics[1] 6. Clothing and footwear[2] 7. Furniture, electrical goods, household goods[3] 8. Books, stationery and other articles[4] 9. Retail sale via mail order houses or via Internet 10. Retail sale of second-hand goods in stores 11. Retail trade not in stores, stalls or markets
b. By size class of enterprises. In each category of aggregated activity classes, the enterprises were stratified into six (6) size classes, according to their size, determined by their annual turnover (in 2010) in BR as follows:
In each stratum that is created by crossing the above stratification criteria, a sample of enterprises was selected with equal probabilities and by applying systematic sampling. This sample is a sub-sample of the existent sample of enterprises that is used to compile the Retail Trade Turnover and Volume Index (2010=100.0). The enterprises that belong to the 6th size class are surveyed exhaustively.
Specifically, of the 1607 enterprises included in the survey sample for the Retail Trade Turnover and Volume Index (2010=100,0), 754 enterprises were selected covering all the strata of the above survey, which resulted from the cross-linking of the economic activity (11 categories of aggregated economic activity classes) and the size class of enterprises.
This approach was based on the fact that:
[1] Dispensing chemist, medical and orthopaedic goods, cosmetic and toilet articles in specialised stores [2] Textiles, clothing, footwear and leather goods in specialised stores [3] Furniture, lighting equipment, audio and video equipment, hardware, paints and glass, electrical household appliances, and other household articles. music and video recordings in specialised stores [4] Books, newspapers and stationery, computers, peripheral units and software, telecommunications equipment, carpets, rugs, wall and floor coverings, sporting equipment., games and toys, flowers, plants, seeds, fertilisers, pet animals and pet food, watches and jewellery. other retail sale of new goods in specialised stores |
||||||||||||||
| 18.2. Frequency of data collection | ||||||||||||||
Data are collected on a quarterly basis. |
||||||||||||||
| 18.3. Data collection | ||||||||||||||
Data are collected through a specially designed questionnaire. The collection of questionnaires is conducted by two ways:
a. Personal visits to enterprises by trained private collaborators (face to face interview) b. By postage. More specifically, the questionnaires are sent by post or fax or e-mail and they are collected by means of the following ways: -via post -via fax -via e-mail. In the case of non-response, the surveyed enterprise is contacted by telephone, or is sent a reminder by fax or e-mail, or even the competent staff of ELSTAT may pay a visit to the enterprise. |
||||||||||||||
| 18.4. Data validation | ||||||||||||||
Data are validated by means of logical checks. Data processing involves checking the data derived from respondents with the aim of identifying and eventually correcting errors. In addition, data processing involves checks for completeness, checks to confirm that values are within given ranges. Data processing may take place during or after data entry. Responses can be compared with the responses of previous quarters. Inconsistencies or big deviations (outside of a pre-established range) indicate that further checks are required and may result in further processing. The data processing is designed to give top priority to those outliers that are most in need to be edited, thus ensuring reliability of aggregates.
Eurostat also carries out validation checks on the national indices it receives. This may result in contacting the reporting country for outliers that are most in need of verification. |
||||||||||||||
| 18.5. Data compilation | ||||||||||||||
The indices of persons employed, hours worked, and gross wages and salaries in retail trade are calculated as chain indices. First, the moving based index is calculated by comparing the estimated value (persons employed, hours worked, gross wages and salaries persons)
More specifically: 1. Persons employed, Hours Worked, Gross Wages and Salaries a. Symbolisms For each of the 11 categories of aggregated economic activity classes stands for: h : size class of enterprises (h=1,...,6)
that is:
that is:
that is:
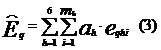
b. Estimation of Persons Employed, Hours Worked, Gross Wages and Salaries For each of the eleven (11) categories of aggregated economic activity classes, the estimation
From the relations (1) and (2) it yields:
The estimated value (number of persons employed, hours worked, wages and salaries) for an economic activity level higher than the 11 categories of aggregated economic activity classes (i.e. Overall Index,Food sector etc) is calculated by adding the separate estimates of the categories composing the estimated level.
2. Indices of Persons Employed, Hours Worked, Wages and Salaries a. Moving base index For each of the eleven (11) categories of aggregated economic activity classes, first the moving-base index is calculated by comparing the estimated value (number of persons employed, hours worked, wages and salaries) for the current quarter q with the corresponding value of the previous quarter as follows:
where:
b. Fixed-base index For each of the eleven (11) categories of aggregated economic activity classes, the fixed-base index for the current quarter is obtained by multiplying the moving-base index by the fixed-base index of the previous quarter, as follows:
For the calculation of the first fixed-base indices of the base year 2010, the following equation applies:
where:
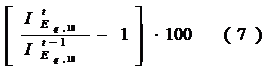
that is: The fixed-base index for an economic level higher than the 11 categories of aggregated economic activity classes (i.e. Overall Index, Food sector etc) is calculated as follows: a) By taking as the numerator and denominator of the equation in relation (4) the total of the separate values (persons employed, hours worked, wages and salaries) for the categories composing the economic activity level under consideration for the current and previous quarter respectively (moving index), and b) By multiplying the said moving index of the economic activity level by the fixed-base index of the relevant economic level of the previous quarter If we compare the fixed base index of the current quarter to the fixed index of the corresponding quarter of the previous year, they calculated the annual rates as percentage changes (+ or -), that is:
where:
3. Index of hours worked, and gross wages and salaries in retail trade for the period 1st quarter 2010-1st quarter 2015 Indices of hours worked, and gross wages and salaries in retail trade for the period 1st quarter 2010-1st quarter 2015 have been compiled by using data coming from the labour force survey (LFS) and the survey of labour cost index (LCI). More specifically:
a. Hours worked of persons employed The hours worked
where:
b. Gross wages and salaries To calculate the gross wages and salaries, the hours worked of salaried employees (based of data from the labour force survey) are multiplied by the gross wages and salaries per hour (based on data from the survey of labour cost index). More specifically:
b1. The hours worked
where:
More information on the survey of labour force survey is available on the portal ELSTAT at the following link: http://www.statistics.gr/en/statistics/-/publication/SJO01/-
In order to apply the relation (9), we consider that:
Actually:
b2. The gross wages and salaries
where:
More information on the survey of labour cost index is available on the portal ELSTAT at the following link: http://www.statistics.gr/en/statistics/-/publication/DKT06/- |
||||||||||||||
| 18.6. Adjustment | ||||||||||||||
a. Hours worked index reduced to a typical quarter of equal duration The hours worked index is reduced to a typical quarter of equal duration. To this end the hours worked estimates are multiplied by a suitable correction factor that is calculated by dividing the mean quarterly number of working days in the given year by the number of the regular working days in the quarter under consideration as follows:
where:
b. Seasonal adjustment Seasonally adjusted time series are produced by removing the impact of seasonality on the time series in order to improve the comparability over time. The seasonal adjustment is conducted by applying the TRAMO-SEAT method with the use of JDemetra+ 2.0.0. The whole series with seasonally adjusted indices is recalculated every time a new observation is added in time series.
c. Backcasting of revised index series of persons employed (1st quarter 2000-4th quarter 2013) The backcasting of revised index series of persons employed (2010=100.0) for the period 1st quarter 2000 – 4th quarter 2013 was calculated on the basis of the average annual indices in 2010, according to the formula:
where:
d. Index of hours worked, and gross wages and salaries (1st quarter 2010-1st quarter 2015) Indices of hours worked, and gross wages and salaries in retail trade for the period 1st quarter 2010-1st quarter 2015 have been produced by using data coming from the labour force survey and the survey of labour cost index (detail in paragraph 20.5). |
||||||||||||||
 for the current quarter q with the corresponding value
  of the previous quarter. Afterwards, the fixed-base index for the current quarter
  is calculated by multiplying the moving-based index by the fixed-base index of the previous quarter.
 : number of enterprises in the size class h (population size)
 : number of enterprises of the sample in the size class h (sample size)
 : the number of the enterprises of the sample that responded in the size class h (respondents)
 : response rate in the size class h, that is:
 : extrapolation factor of the respondents in the size class h
 : persons employed or hours worked or wages and salaries of the current quarter q, of the enterprise of order i, in the size class h
 : persons employed or hours worked or wages and salaries of the current quarter q, of all enterprises that belong to the size class h
 : persons employed or hours worked or wages and salaries of the current quarter q, of all enterprises that belong to the category of aggregated economic activity classes
 of the value (persons employed, hours worked, wages and salaries)
  of the current quarter q is calculated by applying the following relations:


 : the moving-base index for the current quarter q, in relation to the previous quarter q-1
 ,
,  : estimated values (persons employed, hours worked, wages and salaries) for the current and the previous quarter
 : the fixed-base index for the previous quarter, q-1
 : the fixed-base index for the quarter q of year 2010
 : estimated value (persons employed, hours worked, wages and salaries) for quarter q of year 2010
 : mean annually estimated value (persons employed, hours worked, wages and salaries) for year 2010,
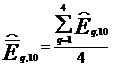
 of persons employed, in quarter q, are calculated as follows:
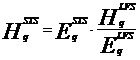 (8)
(8) : number of persons employed in retail trade based on data coming from the survey of the persons employed index (STS), in quarter q
 : number of persons employed in retail trade based on data coming from labour force survey (LFS), in quarter q
 : hours worked from the total of persons employed in retail trade based on data coming from labour force survey (LFS), in quarter q
 of salaried employees, in quarter q, are calculated as follows
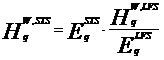 (9)
(9) : hours worked of salaried employees in retail trade based on data from labour force survey (LFS), in quarter q
 : number of persons employed in retail trade based on data from labour force survey (LFS), in quarter q
 : number of persons employed in retail trade based on data from labour force survey (LFS), in quarter q
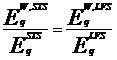 (10)
(10) ,in quarter q, are calculated as follows:
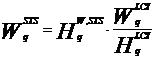 (11)
(11) : gross wages and salaries in retail trade based on data from the survey of labour cost index, in quarter q
 : hours worked of salaried employees in retail trade based on data from the survey of labour cost index, in quarter q
 : correction factor of the quarter q
  : mean quarterly number of working days in the given year
 : number of regular working days in the quarter q

 : index of the aggregated level of economic activity classes k, during the quarter q, with base year 2010
 : index of the aggregated level of economic activity classes k, during the quarter q, with base year 2005
 : average annual index of the aggregated level of economic activity classes k, in the year 2010, with base year 2005.
|
|||
None |
|||
|
|||
|
|||