|
 |
| For any question on data and metadata, please contact: Eurostat user support |
|
|||
| 1.1. Contact organisation | National Statistics Institute-INE Spain |
||
| 1.2. Contact organisation unit | Deputy Directorate for Industrial and Services Statistics |
||
| 1.5. Contact mail address | Paseo de la Castellana, 183. 28071 MADRID (SPAIN) |
||
|
|||
| 2.1. Metadata last certified | 26/04/2021 | ||
| 2.2. Metadata last posted | 26/04/2021 | ||
| 2.3. Metadata last update | 26/04/2021 | ||
|
|||
| 3.1. Data description | |||
The main purpose of the statistical operation of Services Sector Activity Indicators (SSAI) is to provide short-term performance indicators of the economic activity of enterprises operating in the non-financial market services in Spain via two variables: turnover and persons employed. The objective of this operation is to fulfil Regulation no. 1158/2005 of the European Parliament and Council, of 6 July 2005, modifying Regulation no. 1165/98 of the European Union Council dated 19 May 1998, on short-term statistics, although the latter remains in force. This operation began to be carried out in the year 2002. In the year 2005, the sample was increased in order to disseminate regional data, and as of January 2009 SSAI provides information in NACE Rev.2. In January 2013, coinciding with the base change from 2005 to 2010, the formulation used is modified, from direct Laspeyres-type indices with fixed base year 2005, to chain-linked Laspeyres indices, with base year 2010 (monthly chain-linking during last December.) |
|||
| 3.2. Classification system | |||
Statistical Classification of Economic Activities in the European Communities (NACE Rev.2). |
|||
| 3.3. Coverage - sector | |||
The Services Sector Activity Indicators study the population made up of enterprises whose main economic activity is described in sections G, (Trade), H (Transport and Storage), I (Accommodation), J (Information and Communications), M (Professional, Scientific and Technical Activities, excluded 70.1, 72 and 75) and N (Administrative and Support Services Activities, excluded 77, 81.1 and 81.3) of the Statistical Classification of Economic Activities in the European Communities (NACE Rev.2). |
|||
| 3.4. Statistical concepts and definitions | |||
Enterprise classification variables Economic activity The economic activity carried out by an enterprise is defined as the creation of added value by means of the production of goods and services. Each one of the statistical units studied (enterprises) frequently carries out several activities that should be classified in separate categories of the National Classification of the Statistical Classification of Economic Activities in the European Community (NACE Rev.2). In general, the activities carried out by an economic unit may be of three types: main, secondary and auxiliary activities. The main activity differs from secondary activities because it generates the greatest added value and auxiliary activities are those that generate services that are not sold on the market and only serve the unit they depend on (administration departments, transport or storage services). Due to the difficulties faced by enterprises in calculating added value when various activities are carried out, the activity which generates the greatest volume of business is considered the main activity or, failing that, that which employs the greatest number of people. Although statistical units are classified according to their main activity, the information that is requested from the informant units refers not only to the main activity under consideration, but also to all the secondary and auxiliary activities which are carried out.
Enterprise size The size of enterprises is one of the most important variable when it comes to classifying enterprises. This size may be established in terms of the magnitude of turnover or production value, or by considering the number of people on the enterprise staff. In SSAI, this latter option is chosen to determine the size of the enterprises.
Variables studied Number of persons employed. The number of persons employed is defined in Commission Regulation (EC) No 1503/2006. The number of persons employed is defined as the total number of persons who work in the observation unit (inclusive of working proprietors, partners working regularly in the unit and unpaid family workers), as well as persons who work outside the unit who belong to it and are paid by it (e.g. sales representatives, delivery personnel, repair and maintenance teams). It includes persons absent for a short period (e.g. sick leave, paid leave or special leave), and also those on strike, but not those absent for an indefinite period. It also includes part-time workers who are regarded as such under the laws of the country concerned and who are on the payroll, as well as seasonal workers, apprentices and home workers on the payroll. The number of persons employed excludes manpower supplied to the unit by other enterprises, persons carrying out repair and maintenance work in the observation unit on behalf of other enterprises, as well as those on compulsory military service. Unpaid family workers refers to persons who live with the proprietor of the unit and work regularly for the unit, but do not have a contract of service and do not receive a fixed sum for the work they perform. This is limited to those persons who are not included on the payroll of another unit as their principal occupation. |
|||
| 3.5. Statistical unit | |||
The statistical unit of the enterprise carrying out as its main economic activity some of the services included in the population scope has been used. The enterprise is also the informant unit, because as it is perfectly defined and located, and since it has the accounting and employment data available, the response is provided and homogeneous information is obtained. The enterprise is the smallest combination of legal units that constitute an organisational unit that produces goods or services, and which has a certain degree of decision-making autonomy, especially with regard to the allocation of their current resources. |
|||
| 3.6. Statistical population | |||
Population scope The population is around 1.300.000 enterprises for sections G, H, I, J, M (excluded 70.1, 72 and 75) and N (excluded 77, 81.1 and 81.3) included in Other Services of the Statistical Classification of Economic Activities in the European Communities (NACE Rev.2.). The SBS population includes this enterprises, although its scope is bigger. |
|||
| 3.7. Reference area | |||
The geographical coverage of Services is the whole Spanish territory excluding the Autonomous Cities of Ceuta and Melilla. Employment of the units located outside the Spanish territory are not included in the aggregates. The sampled units located in Spain provide their total employment. |
|||
| 3.8. Coverage - Time | |||
This operation began to be carried out in the year 2002. In the year 2005, the sample was increased in order to disseminate regional data, and as of January 2009 SSAI provides information in NACE Rev.2. The historical series begin in January, 2002 except the correspondents to the activities 58 of NACE Rev.2 (Publishing activities), 59 of NACE Rev.2 (Motion picture, video and television programme activities, sounds recording and music publishing) and 60 of the NACE Rev.2 (Radio and television programming and broadcasting activities) and the general indexes of occupation of the autonomous communities that begin in January, 2005. |
|||
| 3.9. Base period | |||
In year 2018, we begin to publish our data in new base year. We choose this year to meet the requirements established in the Regulation of Parliament and EU Council No. 1165/98 which requires that the base years are those ending in zero or five. This facilitates the construction of European aggregates. Services Sector Activity Indicators (SSAI) use chain linking indexes: - The Base year: Year 2015 (the year when the index equals 100)) - The reference period: December t-1 (our chain linking is based on a period shorter than a year) - The reference year: December t-1 (the year on which the weights are based Our base and reference periods released national are equal than data transmitted to Eurostat. |
|||
|
|||
Indices and percentage changes (on previous period or compared to the same period in previous year). |
|||
|
|||
Variable reference period The reference period is the average number of employment of the month. |
|||
|
|||
| 6.1. Institutional Mandate - legal acts and other agreements | |||
The legal basis for the STS indicators is Council Regulation No 1165/98 of 19 May 1998 concerning short-term statistics, amended by Regulation No 1158/2005 of 6 July 2005 concerning short-term statistics and by Regulation (EC) No 1893/2006 of 20 December 2006 establishing the statistical classification of economic activities NACE Revision 2. The definitions of short-term statistics variables are laid down in Commission Regulation No 1503/2006 of 28 September 2006 which implements and amends Council Regulation No 1165/98 of 19 May 1998 that concerns short-term statistics as regards the definition of variables. According to the Spanish legislation, SSAI is a compulsory statistic. The compilation and dissemination of data are governed by the Statistical Law No 12/1989 "Public Statistical Function" of May 9, 1989, and Law No 4/1990 of June 29 on "National Budget of State for the year 1990" amended by Law No 13/1996 "Fiscal, administrative and social measures" of December 30, 1996, makes compulsory all statistics included in the National Statistics Plan. The Plan contains the statistics that must be developed in the four year period by the State General Administration's services or any other entity dependent on it. All statistics included in the National Statistics Plan are statistics for state purposes and are obligatory. The National Statistics Plan 2021-2024, approved by Royal Decree 1110/2020, of December 15th, is the Plan currently implemented. This statistical operation has governmental purposes, and it is included in the National Statistics Plan 2021-2024, which is available in the following link. |
|||
| 6.2. Institutional Mandate - data sharing | |||
The exchanges of information between the INE and the rest of the State statistical offices (Ministerial Departments, independent bodies and administrative bodies depending on the State General Administration), or between these offices and the Autonomous Communities Statistical Offices, are regulated in the Statistical Law No 12/1989 "Public Statistical Function". This law also regulates the mechanisms of statistical coordination, and concludes cooperation agreements between the different offices when necessary. Through the collaboration agreements signed with regional statistical institutes, monthly information exchange is done meeting the requirements established to preserve statistical confidentiality. |
|||
|
|||
| 7.1. Confidentiality - policy | |||
SSAI is a statistical operation included in the National Statistics Plan 2021-2024, therefore, it is subject to Statistics Law No 12/1989 "Public Statistical Function" and, consequently, data is protected by the principle of statistical confidentiality in all the storages of production. Regulation (EC) No 223/2009 of the European Parliament and of the Council on European statistics stipulates the need to establish a guideline and common principles to ensure confidentiality of data used during the production of European statistics and also when accessing the confidential data. INE Spain Confidentiality Policy can be found in the following link. |
|||
| 7.2. Confidentiality - data treatment | |||
INE Spain takes the necessary logical, physical and administrative provisions to protect confidential data, from data collection to dissemination. Questionnaires of the survey include a legal clause related to protection and preservation of data collected. In the case of this survey, only aggregate information is disseminated. Besides data are only published down to an activity level at which they are not confidential and no confidential data can be obtained. |
|||
|
|||
| 8.1. Release calendar | |||
The advanced release calendar is published in the last quarter of every year and shows the exact dates of the publications. |
|||
| 8.2. Release calendar access | |||
This release calendar is available on the web site. |
|||
| 8.3. Release policy - user access | |||
All users have access to the data since 9 am on the press release day. The data are disseminated at INE Spain website. Users are informed that the data are being released via Twitter and also at INE Spain website "News flash" section. In accordance with the European Statistics Code of Practice, all users have access to the same statistical information at the same time, and any privileged pre-release access to any outside user must be limited, controlled and made public. In this sense, a few hours before its official publication, some statistical information of the INE is transmitted, under embargo, to the appointed body, the Secretariat of State for Economic Affairs and Business Support of the Ministry of Economy Affairs and Digital Transformation, for the purpose of providing sufficient time for their responsible parties to prepare answers to any possible questions that journalists might ask them. The release policy doesn't determine the time at which data are disseminated. The dissemination policy is available in the following link. The same release policy is applied to national releases and to transmissions to Eurostat. Data are transmitted in SDMX-ML format to Eurostat at the moment of the national release. |
|||
|
|||
Monthly. The publication is released around 50 days after the end of the reference period. |
|||
|
|||
| 10.1. Dissemination format - News release | |||
The press releases can be consulted on-line. |
|||
| 10.2. Dissemination format - Publications | |||
There are no publications in paper, the information related to this indicator is published in the web page of the INE. In it is possible to find the following information: - Press release, where are outlined the components that more influence the evolution of the indicator the month of reference. - Principal results, which it contains the attached tables to the Press release. - Detailed Results: with the information of the historical series of the indicators. - Methodology, in which the methodological characteristics of the indicator are outlined with major detail. - Weighting used in the added indexes. Also results of the indicators are attached in previous bases. EUROSTAT, the statistical office of the European Union, provide the European Union with statistics at European level that enable comparisons between countries and regions. This information is available in the EUROSTAT statistics database. |
|||
| 10.3. Dissemination format - online database | |||
INEbase is the system that the INE uses to store and to disseminate in the Web all the statistical information. It contains all the information that the INE produces in electronic format. It is organized basically following the thematic classification of the Inventory of Statistical Operations of the General Administration of the State. The basic unit is the statistical operation defined as the set of activities that lead to the obtaining of statistical results for a certain sector or topic, from information gathered individually. The users can accede to the information in INEbase-Services Sector Activity Indicators (SSAI). In 2020 the total number of accesses to Services Sector Activity Indicators (SSAI) website was AC2=1562. |
|||
| 10.4. Dissemination format - microdata access | |||
The microdata of the Services Sector Activity Indicators (SSAI) are not accessible to the general public. A file of microdata does not disseminated anonymous, only these are facilitated to the Oficinas Centrales de Estadística de las Comunidades Autónomas (OCECAS) with which an agreement of collaboration has been signed for the reference of the above mentioned information, by virtue of the Framework agreement of Collaboration between the INE and the OCECAS. |
|||
| 10.5. Dissemination format - other | |||
It is possible to request information as to the user service area INE. It takes into account when processing such requests limitations on confidentiality or precision. Our data are sent to Eurostat, either to be used in European aggregates or to be released also as national data. |
|||
| 10.6. Documentation on methodology | |||
The documentation on the methodology is available at the link: methodology report |
|||
| 10.7. Quality management - documentation | |||
The statistics are prepared in accordance with EU guidelines in order to meet the Code of Practice implemented by Eurostat following the quality criteria on relevance, accuracy, timeliness and punctuality, accessibility and clarity, comparability, consistency and completeness. To ensure the quality of statistics, every three years the Commission shall submit to the European Parliament and the Council a report on the statistics compiled pursuant to Regulation (EC) No 1165/1998 of the Council and in particular on their relevance and quality and the revision of indicators. This report addresses the relevance, quality and review of the indicators as well as the cost of the statistical system and the burden for businesses in relation to its benefits. There aren't additional national quality reports. REPORT FROM THE COMMISSION TO THE EUROPEAN PARLIAMENT AND THE COUNCIL concerning short term statistics as required by Article 14(2) of Council Regulation (EC) No 1165/1998. |
|||
|
|||
| 11.1. Quality assurance | |||
The frame of quality guarantee for the statistics of the INE is based on the ESCOP, the Code of Good practices of EUROSTAT'S European Statistics. The ESCOP consists of 15 principles grouped in three areas: Institutional Environment, Processes and Products. Every principle has associate a series of indicators that allow his measure. To value the quality different tools provided by EUROSTAT are in use: the already mentioned indicators, the self-evaluation (DESAP), the Review for counterparts (Peer Review), the Audits of quality and the Surveys of users' satisfaction. The statistical operation Services Sector Activity Indicators (SSAI) is realized in conformity with the community directives, fulfilling the Code of Good Practices implanted by Eurostat and taking the necessary measurements in order that the published indicators fulfill all the requirements of quality needed. One of the measures carried out to guarantee the quality of this statistical operation consists of confirming the results with other statistical sources between those who stand out: the Sales in the Big enterprises that there obtains the Tributary Agency (AEAT) of the declarations of the VAT, the Survey of Hotel Occupation of the INE, Matriculation of Cars of the Headquarter of Traffic, Imposed of Matriculations of the AEAT, Survey of Population Activates of the INE, etc.. For it, when discrepancies are detected by someone of the sources mentioned previously the available information is analyzed detailed to be able to explain the reasons of the above mentioned discrepancies. |
|||
| 11.2. Quality management - assessment | |||
The statistical operation of the Services Sector Activity Indicators (SSAI) constitutes a product of high quality. His sample size allows to offer information up to the autonomous level inside a few reasonable sampling error, the harmonized used methodology allows to offer comparisons in the international area with a high level of solvency and an extremely valuable measure gives on the sector services, which no other statistical source provides with the same level of detail. As for the limitations of the survey it is necessary to indicate the inherent ones in the statistical operations for sampling, such as not response and the already mentioned sampling errors or coefficients of variation of the estimations. In both cases, they are kept inside reasonable limits. The Regulation n º 1158/2005 of the European Parliament and of the Advice of July 6, 2005 establishes that the quality of the variables will verify from time to time comparing them with another statistical information. The above mentioned comparison will be effected by each of the members states and by the Commission (Eurostat). In addition, the internal coherence will happen. Likewise, it fulfills the quality criteria enumerated in the article 12, paragraph 1, of the Regulation (CE) n º 223/2009 of the European Parliament and of the Advice, namely: relevancy, precision, current importance, punctuality, accessibility, clarity, comparability and coherence. |
|||
|
|||
| 12.1. Relevance - User Needs | |||
The statistical operation of the Services Sector Activity Indicators (SSAI) covers the needs of statistical information of different user groups: The INE itself, which to compile the national accounts uses this statistics of base. Departments and other public organisms that use the results of this statistical operation to made economic analysis, predictions, to elaborate synthetic indicators of activity, etc. Territorial administrations like the autonomous communities. To all the Institutes of statistics of the autonomous communities, by virtue of the agreements established between the INE and these institutions, they receive monthly the information (microdata or regional already compiled indexes) correspondent to enterprises of the sample who belong its region. With this information there can disseminate the Services Sector Activity Indicators (SSAI) to a major level of detail for his Community, it's useful for the measurement of the economic cycle and as instrument of economic regional analysis. Investigators and academic world, enterprises and institutions without ends of profit (services of study of enterprises, foundations, associations, etc.), unions and employer organizations, press and specialized media, as well as of foreign users, so much institutional as individuals. Between the first ones of the latter they stand out, Eurostat, the European Central Bank and the OECD. |
|||
| 12.2. Relevance - User Satisfaction | |||
The INE has made general surveys of users' satisfaction the year 2007, 2010, 2013, 2016 and 2019 and plans to continue making them every 3 years. Their purpose is to know the perception of the users of the statistics regarding to the quality of the information that they use, and in what degree they find his needs covered. In addition, other special surveys are realized to know certain themes: diffusion of the information, quality of certain publications, etc. Besides the surveys experts are in constant contact with main users, in order to meet any specific information need. In the last survey of users satisfaction realized in the year 2019, the sector " Short-term of the sectorial and labour activity " in which this operation is fitted, obtained a valuation for the users of 3.80 on 5. The national user surveys' results is available in the link. |
|||
| 12.3. Completeness | |||
The survey responds to all requests for information, both national and international regulations. |
|||
|
|||
| 13.1. Accuracy - overall | |||
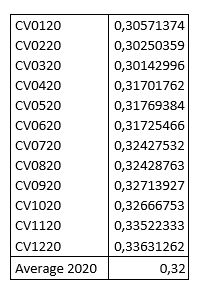
The sample design attempts to minimize sampling errors. Also, errors are reduced as far as possible during the process survey: in data collection (monitoring and control response rate of editing) and later in non-response imputation phase and calculation of aggregate indices. This allows a high degree of reliability of the statistical operation. Random stratified sampling has been used. In order to set out a measurement of the quality from the indices, an approximate relative sampling error is calculated for the year-to-year variation rates. CV for Overall index (G-N_STS) Annual Average 2020: 0.320% Non sampling errors are small too: over-coverage, multiple listings, non-response, imputation... can be considered as minor. Our data are final after five periods from first release and the different between first and last release is small. |
|||
| 13.2. Sampling error | |||
|
|||
| 13.3. Non-sampling error | |||
Impact of over-coverage and multiple listings of the frame We have studied impact of over-coverage and multiple listings of the frame through new units are selected to enter our sample. In September of each year, we select units for an annual renovation: 20-25% of sampling units are rotated in non-exhaustive strata and we select new big enterprises who belong exhaustive strata. In January of each year, part of the sample is renovated. These results have been calculated with new units selected in September 2020: Over-coverage - Units don’t belong target population: 2.82% - Units are closed: 9.22% - Units without any data: 11.19%
Multiple listings - Units are present more than once in the frame % Impact of multiple listings: 0.0091%
Under-coverage We don’t have information about it.
Impact of survey instrument, respondent and interviewer Our survey use simple questionnaires where it appears a contact person who could solve any doubts respondents could have. These contact persons have been working in INE during a long time and they are prepared to answer any question. Besides, most of the questionnaires are collected via web. We use selective editing in web questionnaires, for it most of them have passed several editing controls and respondents should correct them or give us an explanation about their data. When we receive all data, these are revised using selective editing too. If an important error is detected we recontact with respondent again and we correct it.
Impact of unit and non-response item In 2020, we have 29200 units in our sample. We have an small average rate of non-response in it. First release: Average rate, A4. Year 2020 (January-December): 10.49% Last release: Average rate, A4. Year 2020 (January-October): 6.38%
Weighted average rate, A4. Year 2020: 7.02% in first release. Weighted average rate, A4. Year 2020(January-October): 3.002% in last release.
Impact of data editing, coding and imputation Data editing: a first editing phase, at micro-data level takes place when the respondent fills in the e-questionnaire, we use selective editing in them. Data collected by others channels (paper, telephone, fax) are editing by selective editing too when they are recorded. During the data collection another micro-data level editing phase occurs including all data collection methods questionnaires. After that the selective editing is carried out. Finally the macro-data editing phase takes place. Imputation: monthly and annual rates of units filling in the questionnaire in each elementary aggregates are imputed to those units of the same elementary aggregate that did not answer in the reference period. Elementary aggregates are the most detailed levels for which indices are calculated.
% data editing, coding and imputation (October 2020): - editing: 2.5% - imputation: 9.80%
Impact of specific models used in estimation In order to ensure the quality of the data adjusted, INE validates the data using the INE Standard quality measures (chapter 4): verification of the appropriateness of the decomposition (specification) through the diagnoses provided by the SEATS program and verification of the absence of auto-correlation, absence of residual seasonality in the de-seasonalised series and absence of residual calendar effects of the de-seasonalised series. Our questionnaire could be found in Annex of this document. |
|||

|
|||
| 14.1. Timeliness | |||
The publication is disseminated around 50 days after the end of the reference period. |
|||
| 14.2. Punctuality | |||
The results are published punctually in agreement by the calendar of availability of statistical relating to the moment publications elaborated and spread by the INE. The above mentioned calendar is fulfilled by total punctuality. |
|||
|
|||
| 15.1. Comparability - geographical | |||
The survey is designed of homogeneous form in the whole geographical area, regarding his methodology, design, the process of collecting information and data editing. On the other hand, in the European area the comparability between countries is assured thanks to the Regulation 1165/98 of the council on relating to the short term statistics, which it provides with homogeneity to the statistics with the rest of countries of the European Union that disseminated the same information. |
|||
| 15.2. Comparability - over time | |||
All the historical series published of the Services Sector Activity Indicators (SSAI) are homogeneous and, therefore, comparable in the time. From the implantation of the survey there have been base changes of the indexes and of classification of the economic activities but to guarantee the comparability of the information in the time, the INE always has published the retrospective series of the Services Sector Activity Indicators (SSAI) in the new base and in the new classification. The number of comparable data, CC2, From January 2002 to December 2020 is: 228. |
|||
| 15.3. Coherence - cross domain | |||
In the data validation we take into account data of other statistics to ensure consistency between them, such as:
Structural Business Statistics: Services Sector (SBS) of INE SBS and STS use the same Population framework. Our sampling frame is the Statistical Business Register. The sampling design is also quite similar. Both apply stratified sampling with optimum sample allocation. Strata are formed using the following variables: Main economic activity, number of employee and region (NUTS2). In SBS, businesses with 50 or more employees belong to take-all stratum. In STS, for retail trade, the take-all stratum is similar to SBS and for the rest of services, businesses with 200 or more employees belong to take-all stratum. Both use Horvitz-Thompson estimators but there are some differences in the estimation process. SBS estimators are adjusted by stratum changes and the total population, N, is estimated using their own data. In STS, N comes from updated sampling frame. Besides, SBS is designed to obtain level employment and STS is designed to study increasing or decreasing of employment. Labour Force Survey of INE Labour Force Survey is a quarterly survey although the reference period for information is the week before to the interview. Its statistical unit is the main family house. It use a two-stage sampling with stratification, the units of first stage are the census sections and the units of second stage are the family dwellings. Most of the published data are presented in absolute values. In STS sampling frame for employment is the Statistical Business Register. Sample is obtained from enterprises apply stratified sampling with optimum sample allocation. Strata are formed using the following variables: Main economic activity, number of employee and region (NUTS2). Data are published in index form. Sales of the Big enterprises of the Tax Authority Monthly Tax Authority elaborate a publication about turnover of Large enterprises from VAT data. Large enterprises are natural or legal persons whose volume of operations exceeded the figure of 6.01 million euros during the immediately preceding calendar year, this definition is different that European legislation use. Large enterprises operate in all branches of activity, in some the representation is practically exhaustive while in others dominated by small enterprises don’t weight so much. Number of large enterprises change every year. They use a Unit Value Index STS include all units, large and small, our sample has a rotation around 20-25%, we use a Laspeyres Chain Index. |
|||
| 15.4. Coherence - internal | |||
The coherence is a fundamental question both in the exposition of the methodology of the survey and in all his process of production. The coherence between the variables is confirmed in all the phases of the statistical process and they do not find any incoherences. Our indices of employment are in NACE Rev.2 from the beginning. |
|||
|
|||
With the intention of reducing significantly the burden of the units informants, there has been tried that the questionnaire contain all the necessary information and at the same time his design is as simplified as possible to facilitate the answer of respondents, in order to reduce as far as possible the burden of certain reporting units informants that have to fill in of multiple surveys in the same year. To avoid the fatigue of the informants and the aging of the sample, allowing the selection of enterprises of new creation, there is realized an annual rotation of 25%. With regard to the cost associated with the collection and production of the statistical products, in case of the SSAI the budgetary Forecasts in the annual Program 2021 reach an amount of 3,702.73 (thousands of Euros).This budget includes turnover and employment. Burden (respondents) hours per year: 9,797 h Cost (NSI) hours per year: 51,650 h |
|||
|
|||
| 17.1. Data revision - policy | |||
Revised data are used both for the National dissemination and to obtain the STS data transmitted to Eurostat, so the same policy is applied to the STS data released nationally and sent to Eurostat. The revision policy adopted for the STS Services raw data at INE Spain encompasses several types of revisions: - Regular revisions are carried out on a monthly basis. This revision consists on checking the new available information for the data of the reference month plus the late data of previous months that have already been released. - Major revisions are performed on the occasion of rebasing or methodological changes like changes in definitions and classifications as well as legal changes like those due to new Regulations or updates in the already existing. - Non-scheduled revisions take place rarely in the case of detecting an error in the statistical process. The link to the revision policy for raw data adopted at INE Spain is the following: There is no official revision calendar, each indicator has its own revision calendar. |
|||
| 17.2. Data revision - practice | |||
The first time the index of a given month is published, it provides provisional data, which are not final until four months later. Meanwhile the index is revised using the same data modifications that have occurred since the date of the first publication, due for instance to the replacement of the estimated data (for management issues) by the updated data completed by the enterprise. A6_MAR (December 2020) =0.029892 A6_RMAR (December 2020) =1.0651% A6_MR (December 2020) =0.029892 A6_MaxARt= 0.153451( Annual variation rate January 2019_January 2020) MAR, RMAR, MR and MaxARt values were obtained with the information of its last 36 final months being December 2020 the last one. The benchmarking isn't carried out. Revisions aren’t carried out either in a business account quarterly/annual business or on national accounts and on structural business statistics either. Major revisions are informed in advance in the press release the same day of dissemination, although main users are informed in advance. Besides, from 2015 we will comunicate main updates in our website. |
|||
|
|||
| 18.1. Source data | |||
Type of source Statistical survey Frame on which the source is based The source is the DIRCE (INE's business register). The DIRCE has been used as the framework for the survey, which contains information on the main economic activity and on the number of employees in enterprises, enabling their stratification according to these concepts. Also featured in this directory is other data on the identification and location of the statistical units, which are necessary for collecting the information correctly. Sample or census Some strata are investigated exhaustively (strata with enterprises with 200 or more employees) and in the remaining strata, a systematic selection with a random start is carried out, having previously ordered enterprises by size. The sample size was calculated to provide indicators of the variables turnover and employment representative. The sample consists of approximately 28,000 enterprises. Criteria for stratification A stratified one-stage sampling is used, where, as a general rule, the enterprise population has been stratified according to the cross of three variables: principal activity at 4-digit level of NACE Rev 2, the number of employees and region. Information from the Structural Business Survey has been used in order to obtain the sample sizes taking into account the weight of the different strata in the total turnover for each activity and information of variance of the variable number of employees by stratum from the Business Register. Frequency of updating the sample A fixed sample is used every year. At the end of the year the new enterprises belonging to the exhaustive stratum are included. One quarter (25%) of the rest of the sample is substituted including enterprises that died during the year. With the change of base year a complete update is carried out. |
|||
| 18.2. Frequency of data collection | |||
Data is collected monthly. |
|||
| 18.3. Data collection | |||
Questionnaires used in the survey The questionnaire used is a specific monthly questionnaire named “Indicadores de Actividad del Sector Servicios”. Data collection media The questionnaire is sent by post and there are also telephone and fax contacts and the enterprises can fill the questionnaire out on the Internet. |
|||
| 18.4. Data validation | |||
At the stage of completion of the questionnaire, a system that detects inconsistencies is used so that the respondent is advised and is required to confirm or modify the information provided. |
|||
| 18.5. Data compilation | |||
The questionnaires are collected by INE data collection staff and there is a first cleansing of errors according to a set of edits. Microediting consists on validating data from each local unit, attending to its historical values. The analysis establishes monthly and annual comparisons so that the data is validated without contacting the informants when the evolution is repeated periodically. Next, at centralized level, the selective editing phase, imputation (non-response is imputed using the data of the previous month of the non-respondent units and the variation rate of the units in the same stratum) and the macroediting process take place. In some cases, manual editing is required, for example non responding large units. Finally estimators are calculated by aggregating the elementary indices taking into account the weightings. In the last phase, the dissemination files together with the press release are prepared according to the dissemination breakdowns. The indexes are obtained using a chaining-linking. The elementary indices are calculated from the respondents (imputed in case of non-response) common to the reference month and the previous december. The weighting variable is calculated with employment from SBS 2015, and these weights are updated by Services indexes in base 2015 for have weights in December (t-1) in order to calculate chain linking index. |
|||
| 18.6. Adjustment | |||
Employment is not adjusted. |
|||
|
|||
No comments. |
|||
|
|||
|
|||
| IASS-questionnaire |
|||