|
 |
| For any question on data and metadata, please contact: Eurostat user support |
|
|||
| 1.1. Contact organisation | Statistical Office of the Republic of Slovenia (SURS). |
||
| 1.2. Contact organisation unit | Short-term Business Statistics |
||
| 1.5. Contact mail address | Litostrojska cesta 54, 1000 Ljubljana, Slovenia |
||
|
|||
| 2.1. Metadata last certified | 15/06/2023 | ||
| 2.2. Metadata last posted | 15/06/2023 | ||
| 2.3. Metadata last update | 15/06/2023 | ||
|
|||
| 3.1. Data description | |||
The index of service activities is suitable for short-term observation and analyses of economic development. The goal of the monthly estimation is early detection of changes in economic development. |
|||
| 3.2. Classification system | |||
NACE rev.2. |
|||
| 3.3. Coverage - sector | |||
The survey covers enterprises registered in Divisions 49, 50, 51, 52, 53, 55, 56, 58, 59, 60, 61, 62, 63, 68, 69, 70.2, 71, 73, 74, 77, 78, 79, 80, 81, 82 of NACE Rev. 2. The criteria for units to be included in the survey is a yearly turnover of the enterprise and number of persons in paid employment (yearly turnover is higher than EUR 240.000, a yearly turnover is higher than EUR 90.000 and more than 2 persons in paid employment or more than 5 persons in paid employment).
|
|||
| 3.4. Statistical concepts and definitions | |||
Turnover comprises the totals invoiced by the observation unit during the reference period for sales of goods or services. Sale on loan is included in the month of invoice. Turnover includes all other charges (development of computer programs, licenses, instalation, etc.); passed on to the customer, even if these charges are listed separately in the invoice. Turnover excludes VAT, excise duties and other similar taxes, rentals, sales of fixed assets, other operating income, financial income and other extraordinary income. There is no inconsistency to EU definition (according to Regulation (EU) 2019/2152 of the European Parliament and of the Council, Commission Implementing Regulation (EU) 2020/1197 and current methodological guidelines).
|
|||
| 3.5. Statistical unit | |||
Enterprise. |
|||
| 3.6. Statistical population | |||
The survey frame is based on Business Register. Observation units are the enterprises whose principal activity is classified into accommodation and food service activities, transportation and storage, information and communication, professional, real estate activities, scientific and technical activities and administrative and support service activities. Data refer to the whole enterprise, including eventual secondary activity not related to above mentioned activities. The criteria for units to be included in the survey is a yearly turnover of the enterprise and number of persons in paid employment (yearly turnover is more than EUR 240.000, a yearly turnover is higher than EUR 90.000 and more than 2 persons in paid employment or more than 5 persons in paid employment). |
|||
| 3.7. Reference area | |||
The Republic of Slovenia. Turnover from the sale of services covers only activities carried out by the enerprises registered on the national territory of the Republic of Slovenia. |
|||
| 3.8. Coverage - Time | |||
From January 2000 until the end of 2022. The length of the series is 276 months. Data for new service activities according to FRIBS (L68, N77, N81) are available since 2015. The lenght of the series is 96 month. |
|||
| 3.9. Base period | |||
2015. |
|||
|
|||
Index. |
|||
|
|||
A month. |
|||
|
|||
| 6.1. Institutional Mandate - legal acts and other agreements | |||
Regulation (EU) 2019/2152 of the European Parliament and of the Council, Commission Implementing Regulation (EU) 2020/1197. The National Statistics Act (OJ RS No. 45/95 and No. 9/01) and the Annual Programme of Statistical Surveys. |
|||
| 6.2. Institutional Mandate - data sharing | |||
We do not send data directly to any other data producing agency except to Eurostat. |
|||
|
|||
| 7.1. Confidentiality - policy | |||
Regulation (EC) No 223/2009 on European statistics (recital 24 and Article 20 (4)) of 11 March 2009 (OJ L 87,p.164), stipulates the need to establish common principles and guidelines ensuring the confidentiality of data used for the production of European statistics and the access to those confidential data. All data collected and published by the Statistical Office are governed by the National Statistics Act (OJ) RS No. 45/95 and (No. 9/01). |
|||
| 7.2. Confidentiality - data treatment | |||
Confidential data are covered by the National Statistics Act (OJ) RS No. 45/95 and (No. 9/01). Data are suppressed only for NACE REV.2 Divisions 50 and 51 due to the dominant share of one large unit in the turnover of the whole Division. |
|||
|
|||
| 8.1. Release calendar | |||
The release calendar with advanced release dates for all months of the reference year is published at the beginnig of the year on a website of the Statistical Office of the RS. The release calendar is publicly accessible. |
|||
| 8.2. Release calendar access | |||
Link to release calendar: https://www.stat.si/StatWeb/en/ReleaseCal |
|||
| 8.3. Release policy - user access | |||
The most important information channel for data publication is the website https://www.stat.si/StatWeb/en. The Office publishes electronic and printed publications.The Office publishes several types of serial publications, different series and other publications which are according to the content intended for different users (e.g. general public, professional public, statistical experts). Data are available free of charge, except those data that are prepared on users’ request. Statistical data and information are always published at 10.30. All releases are announced at the Office’s website https://www.stat.si/StatWeb/en/ReleaseCal in Release calendar. None of the usres have a prior access to the data on other services. The simultaneous issue of the First Release is ensured. Same release policy applied to national release is applied to transmission to Eurostat. |
|||
|
|||
The data is disseminated monthly. |
|||
|
|||
| 10.1. Dissemination format - News release | |||
First data are issued with a notice called First Release (Turnover in service activities) at 10:30 a.m. on SURS website. First Release is available within 60 days after reference month. |
|||
| 10.2. Dissemination format - Publications | |||
There is no paper publications. |
|||
| 10.3. Dissemination format - online database | |||
SiStat Database (Trade and services). |
|||
| 10.4. Dissemination format - microdata access | |||
In Slovenia, the entities entitled to obtain the statistically protected microdata include the registered research institutions, registered researchers, and the researchers of government offices. Basic instructions concerning the access and the use of statistically protected microdata are availabe on the website: http://www.stat.si/StatWeb/en/StaticPages/Index/For-Researchers. |
|||
| 10.5. Dissemination format - other | |||
The data on service turnover are transmitted to Eurostat according to STS Requirements under NACE Rev. 2 in order to compile EU aggregates and for the dissemination of national data in Eurostat’s dissemination database. |
|||
| 10.6. Documentation on methodology | |||
Methodological explanations for turnover in service activities are availabe on the website: http://www.stat.si/StatWeb/en/mainnavigation/methods-and-classifications/methodological-explanations Theme: Trade and Services, Sub-theme: Other services. There is a link to the methodological explanations in the electronic version of the First Relase and at the SiStat Database for the data set on service turnover. |
|||
| 10.7. Quality management - documentation | |||
Quality reports are availabe at the website: https://www.stat.si/statWeb/en/Methods/QuestionnairesMethodologicalExplanationsQualityReports |
|||
|
|||
| 11.1. Quality assurance | |||
Quality documentation can be reached on SURS website: https://www.stat.si/statWeb/en/Methods/QuestionnairesMethodologicalExplanationsQualityReports |
|||
| 11.2. Quality management - assessment | |||
Indices on service turnover are produced in compliance with methodological requirements and standards. |
|||
|
|||
| 12.1. Relevance - User Needs | |||
The key users of the data are public sector (Slovenian Institute of Macroeconomic Analysis and Development, Ministry of Economic Development and Tehnology, National Bank of Slovenia, Chamber of Commerce and Industry of Slovenia, National Chamber of Commerce), business entities whose activities are observed services, market research companies (GfK Slovenija), educational institutions (Faculty of Economics), media, foreign institutions (Eurostat) and national accounts. |
|||
| 12.2. Relevance - User Satisfaction | |||
The principle users are asked about their needs, wishes, and interests at the regular meetings, i.e. at the statistical advisory commite on retail trade and service. |
|||
| 12.3. Completeness | |||
All statistics that are required by current Regulative are available. |
|||
|
|||
| 13.1. Accuracy - overall | |||
The over-coverage rate for services for 2022 is on average 0.9%. The under-coverage bias for services for 2021 is 0,3 (SBR data for 2022 are not avaliable yet) and is a result of the procedure used for the determination of frame population. It shows the difference between annual indices calculated from data of the Statistical Business Register of Slovenia (SBR) for services, taking into account the entire target population and annual indices calculated from SBR data, taking into account the survey population (coverage). The average rate of the coherence in terms of absolute difference of indices for services field units is 0.1. The average unweighted unit non-response rate is 14.6%. The average weighted unit non-response is 5.4%. A significant number of units constituting the category of unit non-response report VAT data on a quarterly, rather than on a monthly basis. For these units we estimate monthly income for the three months of the quarter at the end of the quarter. With the consideration of estimated monthly VAT data in the category of unit response the average unweighted unit non-response rate is 1.9%. The average monthly weighted unit non-response rate with included quarterly VAT data for services is 1.2%. Because of two different sources, we can talk also about field unit non-response rate and non-response rate for units whose data we get from the administrative source. In 2022 the non-response rate for field units was 2.6%. Non-response rate for units whose data we get from the administrative source was 16.1%. For 2022 we estimate that we corrected data for approximately less than 1% of field units. The editing rate for automatic adjustments of tax data is 0.9%. The average imputation rate for the missing data and data obtained from administrative sources, which were at the stage of automated data editing marked as too prominent, is 14.5%. The first release of services data is 2 month after the end of reference period (t+2M). The data are changed the most between the first release (t+2M) and the second release (t+3M). The absolute difference (coherence) between the data on turnover indices published within t+2M and those that were published within t+3M for 2022 is 0.5. The bias (calculated as the sum of difference between the data on turnover indices published within t+2M and those that were published within t+3M divided with 12) for 2022 is 0.2. After the second release (t+3M) the indices changed a little (±0.1 in absolute numbers) therefore the bias for data in the first release and the final release is almost the same as the bias between the data of the first release and the second release. |
|||
| 13.2. Sampling error | |||
The survey is not conducted on the basis of a random sample, therefore there is no sampling error. |
|||
| 13.3. Non-sampling error | |||
Coverage errors The over-coverage rate is on average 0.9%. The units which represent over-coverage can be divided into ineligible units (we include them in coverage because of lack of information, but do not belong there) and units which were at the inclusion in coverage eligible, but became ineligible at the time of survey implementation as a result of demographic changes. Under-coverage is a result of the procedure used for the determination of frame population. The survey frame is based on Statistical Business Register (SBR). Observation units are chosen at the end of the year for the next year on the basis of threshold coverage. We use the cut-off sample selection; the whole cut-off procedure is carried out in two steps. In the first step the units included in the survey are determined and then in the second step the units for which the data will still be obtained by the postal survey are selected. The enterprise is included in the survey if it fulfils one of the following criteria: • The annual turnover of the enterprise exceeds EUR 240,000; • The annual turnover of the enterprise is higher than EUR 90,000 and the enterprise has more than 2 persons in paid employment; • The enterprise has more than 5 persons in paid employment. The units for which the data will be obtained by questionnaire are determined on the basis of the reported turnover from the previous year. We first sort the units by descending turnover. Then we select a sufficient number of units (largest units) from the beginning of the list so that they exceed the defined share (approximately 60%) of turnover in the total turnover of units covered in the selected activity group. Every year we calculate the under-coverage bias on the basis of SBR data. We compare the annual indices (average of the T year compared to average of the T-1 year). The difference between annual index calculated from data of SBR for services, taking into account the entire population and annual index taking into account the survey population (coverage) for 2021 is 0.3 (SBR data for 2022 are not avaliable yet). Multiple listings: We haven’t detected yet that the enterprises are present more than once in the frame, since the service survey is based on SBR. Measurement errors We collect data on turnover directly from the most important observation units with the monthly questionnaire, which is avaliable electronically. The most important reporting units must send full-filed questionnaires to the Statistical Office by the 20th day in the current month with the data for the previous month. The main sources of data on turnover for other units included in the survey are the data which are reported by enterprises to the Financial Administration of the Republic of Slovenia for the purpose of value added tax return (DDV-O form). There are some methodological differences in the definition of turnover between short-term statistics and the VAT database. The comparison of the index series calculated from two different sources (field units and a combination of field and VAT units) in feasibility studies indicate that VAT data can be used as the main source of turnover. For field units for which data are obtained through a questionnaire, we have the data from the VAT database, so that this (sub)population can be compared to the consistency of data from two different sources. The average rate of the coherence in terms of absolute difference of indices for services data for 2022 is 0.1. If the respondents give the erroneous data on monthly turnover they always have the opportunity to report the correct value later on. If the erroneous data are significant then we detect them through the logical controls, otherwise we detect them by coincidence. Fundamentally there is no interviewer impact in the service survey since the data are gathered on electronic or paper questionnaires. The impact of the interviewer is present just in the case when the unit is contacted by phone because of non-response, but we do not evaluate this kind of errors. Non-response errors Unit non-response: The average monthly un-weighted unit non-response rate for 2022 is 14.6%. The average monthly weighted unit non-response is 5,4%. Variable for calculation of weighted unit non-response is annual turnover of the unit. A significant number of units constituting the category of unit non-response report VAT data on a quarterly, rather than on a monthly basis. For these units we estimate monthly income for the three months of the quarter at the end of the quarter. With the consideration of estimated monthly VAT data in the category of unit response the average monthly un-weighted unit non-response rate for 2022 is 1.9%. The average monthly weighted unit non-response rate with included quarterly VAT data for services is 1.2%. Because of two different sources, we can talk also about field unit non-response rate and non-response rate for units whose data we get from the administrative source. In 2022 non-response rate for field units is 2.6%. Non-response rate for units whose data we get from the administrative source is 16.1%. Item non-response: We monitor only one variable (turnover), so the item non-response rate is equal to the unit non-response rate in general. Data processing errors For field units for which data are obtained through a questionnaire the control takes place interactively so we do not have the accurate records of the editing rate, but only an estimate. For 2021 we estimate that we checked the data for approximately 10% of field units and actually corrected data for approximately less than 1% of units. For the units for which the data on turnover are obtained from VAT database the automatic data editing is performed, where all adjustments take place through computer applications. The editing rate for automatic adjustments of tax data is 0.9%. In the survey we impute (fill in) the missing data and data obtained from administrative sources, which were at the stage of automated data editing marked as too prominent. The average imputation rate is 14.5%. Impact of coding is not relevant because coding of response data is not used. Model errors Model errors are not relevant because no specific models are used in estimation. |
|||
|
|||
| 14.1. Timeliness | |||
The publication schedule is fixed and announced in advance. The First Release is published 60 days after the end of the reference month. Data are at the same time also loaded into the SI STAT database on a website of the Statistical office of the Republic of Slovenia, created for user friendly free of charge data manipulation. Data are published as provisional and they are revised monthly as the response rate increases. Data are considered as provisional 10 months after the reference period. |
|||
| 14.2. Punctuality | |||
There is no time lag between the actual delivery of the data and the target date when it should have been delivered. |
|||
|
|||
| 15.1. Comparability - geographical | |||
Survey results are based on Regulation (EU) 2019/2152 of the European Parliament and of the Council, Commission Implementing Regulation (EU) 2020/1197 and current methodological guidelines, which is in use in all EU Member States. This ensures a good comparability between national data and good-quality European aggregates. |
|||
| 15.2. Comparability - over time | |||
Time series of indices calculated according to the current methodology are available from January 2000 onwards. Until the end of 2022, the length of the series is 276 months. Data for new service activities according to FRIBS (L68, N77, N81) are available since 2015. On 1 January 2008 all Member States of the European Union launched a new classification of activities of business entities NACE Rev 2, which replaced the existing NACE Rev.1.1. In Slovenia the national version of the standard classification, called SKD 2008, came into force. It includes the entire European classification of activities, but also adds national divisions. The new classification has brought many changes and additions that are the result of structural changes in the economy in recent years. Most changes are in market services and manufacturing. Another important change is in the structure of classification, because the revised classification eliminates the level of subsections (2-digit code). We started publishing service statistics according to the SKD 2008 in 2009 for the reference periods in 2009. Due to changes in the classification of activities, the time series of statistical data had to be recalculated (backcasting) according to the new classification (from 2000 to 2008). |
|||
| 15.3. Coherence - cross domain | |||
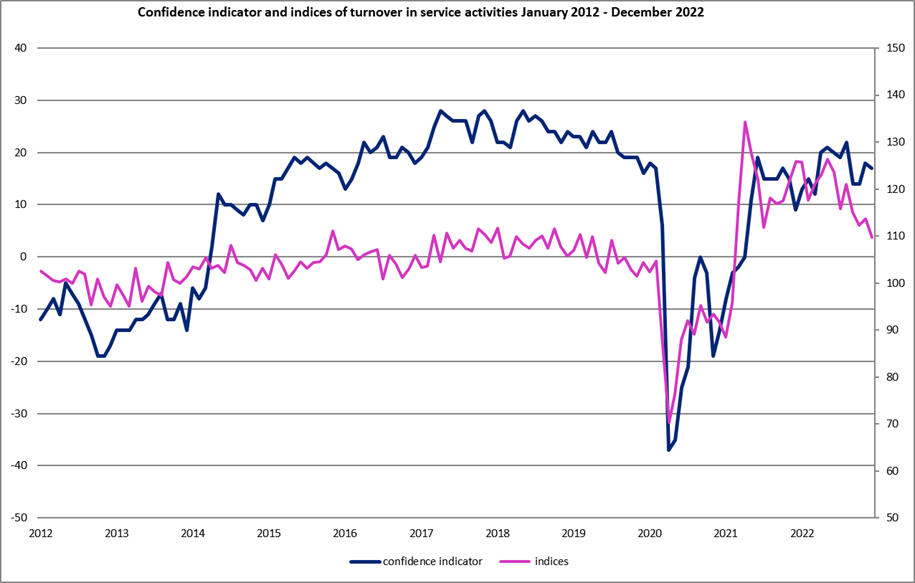
sults of this survey are comparable with the results of the monthly survey Business Tendency in Services. The observation units in this survey are enterprises of which the main activity in the Business Register of Slovenia is classified according to the NACE Rev. 2 into services. The observation units selected by the following two criteria: the size (the number of employees in accordance with the Companies Act), and the classification of the enterprise according to the NACE Rev. 2. The surveys differ in methodologies, since Turnover in service activities is a quantitative survey aimed at monitoring value variable, while Business tendency in services is a qualitative survey aiming at monitoring the opinions of directors on certain economic indicators within the enterprise. The results of the Survey on Business Tendency in Services are shown as the balance by individual question. Due to the different nature of the data, differences between the results of one or another survey are not indicated, but the results are shown only in graphic form.
|
|||
| 15.4. Coherence - internal | |||
Data are internally coherent. Each level of aggregated data is compiled directly from micro data. |
|||
|
|||
In 2022 the number of working hours spent for the selection of enterprises in the sample, preparing the address book, designing on-line questionnaires and notification letters, data capture, data entry and data verification, calculation of the results and their publication, etc. was around 3,700. Number of reporting units that submitted the data was on average 1203. |
|||
|
|||
| 17.1. Data revision - policy | |||
Types of data revisions in relation to planning: a) Planned data revision Planned data revision is subject to the following reasons: I. Due to the needs of users for timely information, data are published that meet the criteria of the quality of official statistical data, but do not meet the quality that can be met with additional statistical procedures. Final data are based on more complete answers about the phenomenon and/or analyses and are published later on; II. Seasonal adjustment and/or elimination of calendar effects; III. Change in methodology and classifications. b) Unplanned data revision: Unplanned data revision is not part of the regular statistical process. It appears due to unpredictable changes in the methodology, unpredictable emergence of new and better data, unpredictable changes regarding reporting units that transmit their data to the Office, unpredictable obstacles in data processing and publishing, and errors in data processing and publishing (e.g. a key unit corrects its data for the past few months, an unpredictable change in the administrative data source). Types of data revisions in relation to time of implementation: a) Regular revisions: inclusion of a more complete/additional data source or a change in the data source, seasonal adjustment and/or elimination of calendar effects; b) Occasional revisions are a consequence of including a new/more complete/additional data source that becomes the standard in later data releases or a consequence of an unpredictable obstacle in data processing and publishing, and change in methodology. Types of data revisions in relation to the purpose: a) Inclusion of a more complete/additional data source or a change in the data source; b) Seasonal adjustment and/or elimination of calendar effects; c) Transition to a new base period; d) Improvement of methodology due to a change in the statistical method or a change in classifications, concepts and definitions; e) Elimination or errors More informations about data revision at SORS are published on web site https://www.stat.si/statWeb/en/Methods/QuestionnairesMethodologicalExplanationsQualityReports >Questionnaires, methodological explanations, quality reports ->methodological explanations - general-> Revision of statistical data. In the case of methodological changes, the data are appropriately recalculated. Changes and revisions of methodology are announced in advence (more in concept 8). The same revision policy is applied nationally and in transmission to Eurostat. |
|||
| 17.2. Data revision - practice | |||
Data for the last 10 months are provisional. With each release the data for the last 10 months can be corrected and supplemented with new data. Data revision is planned. Due to the needs of users for timely information, data are published that meet the criteria of the quality of official statistical data, but do not meet the quality that can be met with additional statistical procedures. Regular revisions include a more complete data source and change of data due to seasonal adjustment and elimination of calendar effects. Data are revised when newer and more quality data respectively can significantly contribute to the quality of data-based decision-making and when due to publication deadlines determined by the European legislation less accurate data are published on the basis of incomplete coverage. Methodological changes are previously discussed with the Advisory Committee for Trade and Service Statistics and are announced to the public at the time of the change. Due to change of the base year data is revised every five years. Data was last revised due to change of the base year in 2018. Mean Revision (MR) and Mean Absolute Revision (MAR): - year-on-year growth rates for data series on servise turnover: MR =0,19, MAR= 0,64
|
|||
|
|||
| 18.1. Source data | |||
In order to collect data on service turnover a combination of two sources of data is used: main sources of data on turnover are the data reported by enterprises to the Financial Administration for the purpose of value added tax return. In this way about 90% of the data in terms of number of units are obtained. In order to provide results that are close enough to the statistical definition of the observed phenomenon and to stay in touch with the most important reporting units, we collect data on turnover directly from about 10% of the largest units with the monthly questionnaire. Census above cut-off (within the pre-defined population) is carried out. The stratification criteria are size of enterprise (employment or turnover) and activity. The source for these data is the accounting documentation of enterprises and only exceptionally their estimates. |
|||
| 18.2. Frequency of data collection | |||
Monthly. |
|||
| 18.3. Data collection | |||
For most of the units VAT declarations are used. Data for the largest units are collected by on-line questionnaire. Actions to speed up or increase the rate of response: at the first one postal reminder is used, which is sent by mail usually 3 days after the time given for the replies. There is also a telephone follow up. |
|||
| 18.4. Data validation | |||
Plausibility checks performed at micro level: if the field unit's turnover for the reference month is not comparable to its turnover for the previous month or the same month of the previous year (lower or higher than a defined threshold) than the unit is contacted by phone in order to clarify the deviation.The data obtained from administrative sources, which were at the stage of automated data editing marked as too prominent are imputed. Plausibility checks performed at macro level: we compare the indices calculated for the units for which the data are obtained from administrative data to indices calculated for the field units. Comparison of the index on aggregate level for the reference month with the indices of the same months of the previous years is also made on aggregate level. A kind of detection question on demographic change of the unit is added on the questionnaire (did the unit operate in the reference month and if not why not). There is also the remark field for any explanation of the unit (especially for the case of very low or high turnover). There is also possibility to report the corrections of turnover for the previous months. The objective of all kind of the detection questions on the field questionnaire is to get more relevant information on the data important for the survey. For the field units we collect the contact data of the person which fulfils the questionnaire and in the case of uncertainties in the data we make an inquiry calls. The information and explanation of deviated data gathered directly from the enterprises are considered as very precious. Sometimes the information from enterprises explain the unusual movement or development of data series. Sometimes the enterprises do not inform us about the demographic change automatically but we reach the information through inquiry call. In the case of uncertainties in administrative data no direct contact to the units exists. For field units for which data are obtained through a questionnaire, we have (with rare exceptions) the data from the VAT database, so that this (sub)population can be compared to the consistency of data from two different sources. |
|||
| 18.5. Data compilation | |||
Within the survey (on service turnover indices), only one variable is measured – turnover. Turnover is also the only variable which is estimated within the survey in the case of non-response. Historical trend method is used for the non-respondents for which the data for the previous month exist. Interpolation of quarterly data is used in the last month of each of the quarters for the units for which only the quarterly VAT data are available. The quarterly data are broken down to the monthly data by using the nearest neighbour principle. And average value (Mean-Value Method) within the stratum is used for the units for which one of the afore mentioned methods could not be used. No weights are used for aggregated data. The each level of aggregated data is compiled directly from micro data (the indices on the aggregated level are only self weighted). A simple value index is compiled. The only index which is calculated directly from the data is the month-to-month change. After calculating this index, the »fixed base index« is calculated by multiplying the base index from the previous month with the month-to-month change. All the other indices are calculated by chaining the time series of base indices. |
|||
| 18.6. Adjustment | |||
Seasonal adjustment is the main part of time series analysis. With seasonal adjustment, seasonal effects and calendar effects are removed, if they are significant. In this way, the data are simplified so that they can be more appropriately interpreted, because seasonal fluctuations can blur other important movements For seasonal adjustment of time series JDemetra +2.2.0. software and the TRAMO/SEATS method is used. In seasonal adjustment the guidelines of the European Statistical System are also taken into account. For each new release of unadjusted data, the parameters of the models are re-estimated; the models mostly remain the same, but sometimes they are changed (e.g. an outlier at the end of a time series is added). Major changes of the models usually occur every few years. For each new release of unadjusted data, the whole seasonally adjusted time series are revised. Models are revised in detail about once a year, taking into account the period available at that time. If the model is changed, we strive to minimize the changes. In the period between detailed revisions, the model is changed only if statistics show that it is no longer good enough. Selection of the model is manual, but some automatic tests are used for help (test for transformation, automatic detection of outliers, automatic selection of ARIMA model). 29 transmited time series have multiplicative decomposition and 4 time series have additive decomposition. Critical value for outlier detection depends on the time series, usually it is between 2.5 and 3.5. Most of the time series don't have the possibility of outlier detection. Filter length is automatically chosen. All the time series are seasonally adjusted directly, therefore seasonally adjusted data of an aggregate are not composed of seasonally adjusted data of its components. When models are selected or changed, connection between an aggregate and its components is taken into account (similar time series have similar models …). Residual seasonality is checked when the model is selected. Afterwards, residual seasonality diagnostics are taken into account. Using the model the time series is decomposed into the trend-cycle component, the seasonal component and the irregular component. The trend-cycle component consists of the trend and cyclical movements over a period longer than one year. The seasonal component consists of the seasonal effects and the calendar effects. Calendar effects are composed of the working day effect, the leap-year effect, the holiday effect and the Easter effect. The irregular component consists of random fluctuations and some outliers. Seasonal and calendar effects are eliminated from the time series only if they are statistically significant. If only seasonal effects are significant and calendar effects are not, then only seasonal effects are eliminated. |
|||
|
|||
No comment. |
|||
|
|||
|
|||