|
 |
| For any question on data and metadata, please contact: Eurostat user support |
|
|||
| 1.1. Contact organisation | Hellenic Statistical Authority (ELSTAT) |
||
| 1.2. Contact organisation unit | Business Statistics Division Section of Trade and Services Indices |
||
| 1.5. Contact mail address | 46 Pireos & Eponiton str. 18510 Piraeus Greece |
||
|
|||
| 2.1. Metadata last certified | 15/06/2023 | ||
| 2.2. Metadata last posted | 15/06/2023 | ||
| 2.3. Metadata last update | 15/06/2023 | ||
|
|||
| 3.1. Data description | |||
The Turnover Indices in Services refer to the whole country and they cover the following divisions and groups of economic activity according to NACE Rev.2:
No geographical breakdown is performed for the above data, which are collected quarterly, and presented as indices and percentage changes. The indices are compiled for each division quarterly, working-day adjusted (actual number of working days) and reported as follows:
|
|||
| 3.2. Classification system | |||
The statistical classification of economic activities NACE Rev.2 is applied, in conformity with Regulation (EC) 1893/2006 of the European Parliament and Council. |
|||
| 3.3. Coverage - sector | |||
The Turnover Indices in Services cover economic activities listed in sections H, I, J, M and N of NACE Rev.2 (H-Transportation and Storage, I-Accommodation and food service activities, J-Information and communication, M-Professional, scientific and technical activities, N-Administrative and support service activities) and more specifically the following divisions: Section H
Section I
Section J
Section M
Section N
|
|||
| 3.4. Statistical concepts and definitions | |||
The Turnover Indices in Services are important business indicators, which show the evolution of the services market. The objective of these indices is to measure in value terms the activity of the surveyed sectors. Turnover comprises the totals invoiced by the enterprise during the reference period (quarter), which correspond to the sales of goods or services supplied to third parties and excludes VAT. The definitions used, in accordance with Commission Regulation (EC) No 1503/2006 defining variables and frequency of data compilation are as follows: Turnover comprises the totals invoiced by the observation unit during the reference period, which correspond to sales of goods or services supplied to third parties. It also includes any other charges (transport, packaging, etc.) charged to the customer, even if these expenses are listed separately in the invoice. Turnover excludes VAT and other similar deductible taxes directly linked to turnover, as well as all duties and taxes on the services invoiced by the enterprise. Reductions in prices, rebates and discounts, as well as the value of returned packaging must be deducted. Price reductions, rebates and bonuses conceded later to clients, for example at the end of the year, are not taken into account. Income classified as other operating income, financial income and extraordinary income in company accounts is excluded from turnover. According to this definition, the items generally included are: - sales of manufactured products; - sales of products manufactured by subcontractors; - sales of goods purchased for resale in the same condition as received; - invoiced services provided; - sales of by-products; - invoiced charges for packaging and transport; - hours worked invoiced to third parties for labour-only subcontracting; - invoiced mounting, installation and repairs; - invoiced instalments (stage payments); - invoiced development of software and software licenses; - sales of supplied electric power, gas, heat, steam and water; - sales of waste and scrap materials; - subsidies on products. Subject to the treatment of the income classified as ‘other operating income, financial income and extraordinary income’ in company accounts, the items generally excluded are: - VAT and other similar deductible taxes directly linked to turnover, as well as all duties and taxes on the goods or services invoiced by the unit; - commissions; - leases and rentals; - leases for own production units and machines if used by third parties; - leases of company-owned buildings; - receipts for license fees; - receipts from staff facilities (for example from a factory canteen); - the supply of products and services within the observation unit; - sales of own land and fixed assets; - sales or leases of own properties; - sales of shares; - interest receipts and dividends; - other extraordinary income. The above items may be included if they generate turnover in the principle field of operation of the observation unit. |
|||
| 3.5. Statistical unit | |||
The observation unit, as well as the reporting unit is the enterprise. |
|||
| 3.6. Statistical population | |||
For the Turnover Index in Transport Sector (div. 49, 50, 51, 52, 79) the population encompasses 10,065 enterprises from the Business Register (BR) of ELSTAT with annual turnover in year 2015 equal to or higher than 70,000 euros for division 49, equal to or higher than 830,000 euros for division 50, equal to or higher than 730,000 euros for division 52, equal to or higher than 380,000 euros for division 79 and by census (all the enterprises) for division 51. For the Turnover Index in Tourism Sector (div. 55, 56) the population encompasses 18,790 enterprises from the BR of ELSTAT with annual turnover in year 2015 equal to or higher than 80,000 euros. For the Turnover Index in Information and Communication Sector (div. 59, 60) the population encompasses 290 enterprises from the BR of ELSTAT with annual turnover in year 2015 equal to or higher than 125,000 euros. For the Turnover Indices for Specific Activities of the Services (div. 53, 58, 61, 62, 63, 69, 70.2, 71, 73, 74, 78, 80, 81, 81.2, 82), the population encompasses 12,857 enterprises from the BR of ELSTAT with annual turnover in year 2015 equal to or higher than 50,000 euros. |
|||
| 3.7. Reference area | |||
The turnover indices cover the whole country. Generally, no activities outside the national territory are covered. Nevertheless,there is not information to distinguish turnover from any activities produced outside the country and included in the data of the enterprises. |
|||
| 3.8. Coverage - Time | |||
The time series of the Turnover Indices in Services cover the period from the 1st quarter 2000 onwards. |
|||
| 3.9. Base period | |||
Base year: 2015=100.0. |
|||
|
|||
Indices, quarter-on-quarter rates of change (%), year-on-year rates of change (%). |
|||
|
|||
The reference period is the quarter. |
|||
|
|||
| 6.1. Institutional Mandate - legal acts and other agreements | |||
The legal framework concerning the organization and operation of ELSTAT is as follows:
The Legal Framework is detailed in the link: http://www.statistics.gr/en/legal-framework. Eurostat legislation: EU legislation: The legal basis is Regulation (EU) 2019/2152 of the European Parliament and of the Council on Business Statistics, as well as Commission Implementing Regulation (EU) 2020/1197 laying down technical specifications and regulations pursuant to Regulation (EU) 2019/2152. In addition, Regulation (EC) No. 1893/2006 of the European Parliament and of the Council on the establishment of the statistical nomenclature of economic activities NACE Rev. 2. The definitions of short-term statistics (STS) variables and the classification by main industrial groups (MIG), are defined in Implementing Regulation (EU) no. 2020/1197 of the Commission. |
|||
| 6.2. Institutional Mandate - data sharing | |||
The Turnover Indices in Services are transmitted to Eurostat according to EU legislation. |
|||
|
|||
| 7.1. Confidentiality - policy | |||
The issues concerning the observance of statistical confidentiality by the Hellenic Statistical Authority (ELSTAT) are arranged by articles 7, 8 and 9 of the Law 3832/2010 as in force, by Articles 8, 10 and 11(2) of the Regulation on Statistical Obligations of the agencies of the Hellenic Statistical System and by Articles 10 and 15 of the Regulation on the Operation and Administration of ELSTAT. Furthermore, ELSTAT disseminates the statistics in compliance with the statistical principles of the European Statistics Code of Practice and in particular with the principle of statistical confidentiality. More details in the following link: http://www.statistics.gr/en/statistical-confidentiality?inheritRedirect=true%20. |
|||
| 7.2. Confidentiality - data treatment | |||
ELSTAT protects and does not disseminate data that it has obtained or it has access to, which enable the direct or indirect identification of the statistical units that have provided them by the disclosure of individual information directly received for statistical purposes or indirectly supplied from administrative or other sources. ELSTAT takes all appropriate preventive measures so as to render impossible the identification of individual statistical units by technical or other means that might reasonably be used by a third party. Statistical data that could potentially enable the identification of the statistical unit are disseminated by ELSTAT if and only if: a. these data have been treated, as it is specifically set out in the Regulation on Statistical Obligations of the agencies of the Hellenic Statistical System (ELSS), in such a way that their dissemination does not prejudice statistical confidentiality or b. the statistical unit has given its consent, without any reservations, for the disclosure of data. The confidential data that are transmitted by ELSS agencies to ELSTAT are used exclusively for statistical purposes and the only persons who have the right to have access to these data are the personnel engaged in this task and appointed by an act of the President of ELSTAT. ELSTAT may grant researchers conducting statistical analyses for scientific purposes access to data that enable the indirect identification of the statistical units concerned. The access is granted provided the following conditions are satisfied: a. an appropriate request together with a detailed research proposal in conformity with current scientific standards have been submitted; b. the research proposal indicates in sufficient detail the set of data to be accessed, the methods of analyzing them, and the time needed for the research; c. a contract specifying the conditions for access, the obligations of the researchers, the measures for respecting the confidentiality of statistical data and the sanctions in case of breach of these obligations has been signed by the individual researcher, by his/her institution, or by the organization commissioning the research, as the case may be, and by ELSTAT. Issues referring to the observance of statistical confidentiality are examined by the Statistical Confidentiality Committee (SCC) operating in ELSTAT. The responsibilities of this Committee are to recommend on: - the level of detail at which statistical data can be disseminated, so as the identification, either directly or indirectly, of the surveyed statistical unit is not possible; - the anonymization criteria for the microdata provided to users; - the granting to researchers access to confidential data for scientific purposes. The staff of ELSTAT, under any employment status, as well as the temporary survey researchers who are employed for the collection of statistical data in statistical surveys conducted by ELSTAT, who acquire access by any means to confidential data, are bound by the principle of confidentiality and must use these data exclusively for the statistical purposes of ELSTAT. After the termination of their term of office, they are not allowed to use these data for any purpose. Violation of data confidentiality and/or statistical confidentiality by any civil servant or employee of ELSTAT constitutes the disciplinary offence of violation of duty and may be punished with the penalty of final dismissal. ELSTAT, by its decision, may impose a penalty amounting from ten thousand (10,000) up to two hundred thousand (200,000) euro to anyone who violates the confidentiality of data and/or statistical confidentiality. The penalty is always imposed after the hearing of the defense of the person liable for the breach, depending on the gravity and the repercussions of the violation. Any relapse constitutes an aggravating factor for the assessment of the administrative sanction. Confidentiality: If tha data are actually confidential according to article 20 of the Law (EC) No 223/2009 arranged by the European Parliament and by the qualified Council on the 11th of March on 2009 (data which allow the exact determination of some statistical units, either directly or indirectly), they should be noted as confidential and consequently they will not be published by Eurostat. Embargo: In order to enable Eurostat to produce press releases, sometimes data are sent in advance to Eurostat. Those data, if considered under embargo, will not be published by Eurostat until the embargo expires. This case is currently addressed by using confidentiality flags. |
|||
|
|||
| 8.1. Release calendar | |||
A release calendar is available on the website with the precise release dates of statistics for the following year. |
|||
| 8.2. Release calendar access | |||
The calendar is distributed to the press and is available to all interested parties free of charge. This calendar is also posted on the website of the ELSTAT (www.statistics.gr) under the link: “Announcements Calendar” http://www.statistics.gr/en/calendar |
|||
| 8.3. Release policy - user access | |||
In line with the Community legal framework and the European Statistics Code of Practice, ELSTAT disseminates national statistics on ELSTAT’s website respecting professional independence and in an objective, professional and transparent manner in which all users are treated equally. In this context, data are released simultaneously to all interested parties and users through an Announcement on the specific indices, which are posted on the website of ELSTAT, at the following links, according to the Release calendar: - Turnover Index in Transport Sector http://www.statistics.gr/en/statistics/-/publication/DKT48/- - Turnover Index in Tourism Sector http://www.statistics.gr/en/statistics/-/publication/DKT51/- - Turnover Index in Information and Communication Sector http://www.statistics.gr/en/statistics/-/publication/SDD06/- - Turnover Indices for Specific Activities of the Services Sector http://www.statistics.gr/en/statistics/-/publication/DKT54/- The press releases are also available by e-mail to all interested parties. In addition, data are transmitted to Eurostat on a predefined date, concomitantly with their national publication. Neither users nor the government have access to the data prior to their publication. |
|||
|
|||
The indices are disseminated on a quarterly basis. |
|||
|
|||
| 10.1. Dissemination format - News release | |||
Turnover Indices in Services are released on a quarterly basis in standardized Announcements, within specified deadlines, presenting the recently calculated indices. The Announcement is available in both Greek and English language and is sent, free-of-charge, and mostly by email to the press and to other interested parties. It is also available on the website of ELSTAT (http://www.statistics.gr/en/home/). For Turnover Indices in Services the Announcement is published 63-67 days after the end of the reference quarter, at 12.00. The Turover Indices in Services are reported as follows:
|
|||
| 10.2. Dissemination format - Publications | |||
Data are released in publications of ELSTAT such as specific publications: “The Greek Economy”and "Greece in figures".
|
|||
| 10.3. Dissemination format - online database | |||
There is no on-line database for the indices. |
|||
| 10.4. Dissemination format - microdata access | |||
Microdata are available on request at: Statistical Information and Publications Division Data Dissemination Section 185.10 Piraeus Tel. (+30) 213-1352022, Access to microdata is only permitted under strict conditions and always with due process. More information are available on the website link: http://www.statistics.gr/en/scientific_provision_data |
|||
| 10.5. Dissemination format - other | |||
Users can have access to previously released publications by ELSTAT, relevant to various statistical surveys posted on the on-line library service, through the link: http://dlib.statistics.gr/portal/page/portal/ESYE/, as well as Eurostat publications through the link: http://ec.europa.eu/eurostat/web/short-term-business-statistics/. The results of the indices are posted on the website of ELSTAT, at the following links: - Turnover Index in Transport Sector http://www.statistics.gr/en/statistics/-/publication/DKT48/- - Turnover Index in Tourism Sector http://www.statistics.gr/en/statistics/-/publication/DKT51/- - Turnover Index in Information and Communication Sector http://www.statistics.gr/en/statistics/-/publication/SDD06/- - Turnover Indices for Specific Activities of the Services Sector http://www.statistics.gr/en/statistics/-/publication/DKT54/- Users can be given data or further analysis, usually by e-mail after submitting a request, describing the requested data to the Section of Statistical Dissemination (the Trade and Services Indices Section will be informed), at the following e-mail addresses: data.dissem@statistics.gr, data.supply@statistics.gr and data.source@statistics.gr. Users can also submit their requests electronically, through the portal at: |
|||
| 10.6. Documentation on methodology | |||
The methodology for the compilation of the index is laid down by ELSTAT, taking into account international practices and, in particular, Eurostat’s recommendations, guidelines and standards. The Methodology of Short-term Business Statistics, Interpretation and guidelines, 2006, contains a comprehensive set of recommendations on the compilation of the STS statistics. It is available at the link: http://ec.europa.eu/eurostat/web/short-term-business-statistics/methodology. Special methodological papers on the compilation of the Turnover Indices in Services are posted on the website of ELSTAT containing detailed information on the sources and the methodology used through the following links: - Turnover Index in Transport Sector http://www.statistics.gr/en/statistics/-/publication/DKT48/- - Turnover Index in Tourism Sector http://www.statistics.gr/en/statistics/-/publication/DKT51/- - Turnover Index in Information and Communication Sector http://www.statistics.gr/en/statistics/-/publication/SDD06/- - Turnover Indices for Specific Activities of the Services Sector http://www.statistics.gr/en/statistics/-/publication/DKT54/- |
|||
| 10.7. Quality management - documentation | |||
User oriented short quality reports are available at the following links: - Turnover Index in Transport Sector http://www.statistics.gr/en/statistics/-/publication/DKT48/- - Turnover Index in Tourism Sector http://www.statistics.gr/en/statistics/-/publication/DKT51/- - Turnover Index in Information and Communication Sector http://www.statistics.gr/en/statistics/-/publication/SDD06/- - Turnover Indices for Specific Activities of the Services Sector http://www.statistics.gr/en/statistics/-/publication/DKT54/- |
|||
|
|||
| 11.1. Quality assurance | |||
The Hellenic Statistical Authority (ELSTAT) aims to ensure and further improve the quality of statistics produced and maintain the confidence of users in them. This is achieved through the Quality Policy of ELSTAT which is posted on the website of ELSTAT and is available at the following links: http://www.statistics.gr/en/quality-asurance-framework and http://www.statistics.gr/en/policies. Quality control and validation of data are carried out during the whole process of the compilation of the indices - from the data collection stage to the final compilation of the indices. The well-trained and experienced staff deals with all the stages of the compilation of the indices, that is: data collection, including communication with the enterprises, initial checks of the data as to their correctness, data entry and final checks, which are conducted after the calculation of the indices. This way, the personnel have a comprehensive and long-standing experience with the enterprises under survey. Data are validated either before or after data entry by means of logical checks. During data processing, the data are checked in order to identify and correct any measurement or data entry errors. The detection of these errors is done in data of the enterprises, by examining whether these data are within a certain range of values, based on the size of the enterprises, as well as the seasonality of the data. At the same time, data are checked for completeness, accuracy and consistency of the correlating variables. The indices are calculated by means of specialised software, through computation routines, thus eliminating any errors to the final results. Nevertheless, even during this stage, consistency checks are carried out to the final results, mainly on comparing the percentage changes of the corresponding quarters. |
|||
| 11.2. Quality management - assessment | |||
The Turnover Indices in Services are considered to be reliable and sufficiently accurate indices, because: the concepts, definitions, and methodology applied in the compilation of the indices follow European and international standards and guidelines,
|
|||
|
|||
| 12.1. Relevance - User Needs | |||
The indices meet national needs and the needs of European users. Generally, the indices provide statistical information necessary to improve the competitiveness and performance of the business community. The main national users of the services turnover indices are the government and other public agencies, the Central Bank of Greece and other Hellenic banks, scientific community (Academic / Researcher, Student), Press and other Media, Commercial Business, National Confederation of Hellenic Commerce etc. At international level, the Indices are used by Eurostat, International Monetary Fund (IMF), the United Nations (UN), the European Central Bank (ECB), the Organisation for Economic Co-operation and Development (OECD), the International Labour Organization (ILO) etc. The compiled indices cover the wide range of users’ needs: as concerns domestic market, the indices are used as a tool providing useful information on the activities, competitiveness and productivity of the services sector, thus helping the government in drawing economic policy and entrepreneurs or other agencies in decision making concerning their taking up several initiatives. At European level, there is the need for fully comparable statistics in order to draw the European economic policy. |
|||
| 12.2. Relevance - User Satisfaction | |||
a.User satisfaction survey: ELSTAT conducts an annual user satisfaction survey. The comments on the media are positive. More information about the latest results of user research, for the annual periods per semester, is available in the Library Information Bulletin, on the website of ELSTAT (www.statistics.gr), "Products and Services" at the link: http://www.statistics.gr/en/user-satisfaction-survey. b.Conference of statistical data users According to its annual statistical program, ELSTAT has been conducting a user conference since 2010 on an annual basis, attended by representatives of private and public sector bodies, as well as educational and research institutions. Information about user conferences at the link: |
|||
| 12.3. Completeness | |||
Data are in full compliance with the relevant European Regulations. |
|||
|
||||||||||||||||||||||||||||||||||||||||||||||||||
| 13.1. Accuracy - overall | ||||||||||||||||||||||||||||||||||||||||||||||||||
The accuracy of indices is influenced by: a) sampling errors and b) non-sampling errors. Sampling errors occur due to the fact that for the indices compilation, the whole target population of enterprises is not investigated, but a sample of them is used instead. Non-sampling errors of indices refer mainly to data errors and non-response errors of the sample enterprises. Measurement errors during data collection are identified by quality checks and then they are corrected. Regarding non-response errors, every effort is made so as the units that have not responded to provide the requested data. |
||||||||||||||||||||||||||||||||||||||||||||||||||
| 13.2. Sampling error | ||||||||||||||||||||||||||||||||||||||||||||||||||
The method of one-stage stratified random sampling was used for the selection of the enterprises to be included in the samples. As sample survey is conducted, sampling errors arise in the estimates of the indices. The sampling errors, expressed as coefficient of variation (quarterly change CV %) for the 3rd quarter 2022 is shown: - Turnover Index in Transport Sector
- Turnover Index in Tourism Sector
- Turnover Index in Information and Communication Sector
- Turnover Indices for Specific Activities of the Services Sector The sampling errors, expressed in coefficient of variation (quarterly change CV %), for the 3rd quarter 2022 is shown:
The sampling error of the divisions: 51, 53 and 61 is nought as, the surveillance of their financial turnover is by census. |
||||||||||||||||||||||||||||||||||||||||||||||||||
| 13.3. Non-sampling error | ||||||||||||||||||||||||||||||||||||||||||||||||||
There are no errors related with inconsistent use of definitions. Some counting errors may occur, such as data provided by the surveyed enterprises. These errors are usually easy to identify, through checks and cross-checks with the data provided by the enterprises during the prvious years and are corrected after telephone or e-mail communication with the accountants. Non-sampling errors involve coverage errors, measurements errors, non-response errors, processing errors and model errors. More specifically: a. Coverage error No coverage errors are observed in the Business Register of ELSTAT, on the basis of which the survey on the compilation of the indices in services was designed. b. Measurement error Any measurement errors during the data collection process are detected by means of quality checks and are duly corrected. c. Non response error In the case of non response, the surveyed enterprise is contacted by telephone, or is sent a reminder by e-mail, or even the competent staff may pay a visit to the enterprise in order to respond. The weighted variable used is turnover where the size-weighted response rate 3rd quarter 2022 for each division is as follows: - Turnover Index in Transport Sector, Rrsw%=100.00 - Turnover Index in Tourism Sector, Rrsw%=100.00 - Turnover Index in Information and Communication Sector, Rrsw%=100.00 - Turnover Indices for Specific Activities of the Services Sector, Rrsw%=100.00 d. Processing error All tasks engaged to the processing procedure (e.g. weighting, calculations, tabulation etc) are performed by using a special software application, in order to eliminate processing errors. e. Model assumption error No model is used for the compilation of the indices. |
||||||||||||||||||||||||||||||||||||||||||||||||||
|
|||
| 14.1. Timeliness | |||
The Turnover Indices for Activities of the Services Sector is published 63-67 days after the end of the reference quarter. |
|||
| 14.2. Punctuality | |||
The indices are published according to the pre-announced release calendar. |
|||
|
|||
| 15.1. Comparability - geographical | |||
The Regulation (EU) 2019/2152 of the European Parliament and of the Council on European Business Statistics, as well as Commission Implementing Regulation (EU) 2020/1197 laying down technical specifications and arrangements pursuant to Regulation (EU) 2019/2152 are applied for the compilation of the indices, thus ensuring a good comparability between thw Greek indices and other national and European indices,taking always into account any special conditions prevailing in each country, which may dictate minor methodological deviations. Asymmetry for mirror flows statistics – coefficient There are no mirror flows statistics among EU Member States in the Turnover Indices. |
|||
| 15.2. Comparability - over time | |||
For the Turnover Index in Transport Sector, in Tourism Sector and in Information and Communication Sector, from 3rd quarter 2013 onwards the time series of the revised turnover indices, with base year 2015 (2015=100.0) was backasted and dully adjusted. For the Turnover Indices for Specific Activities of the Services Sector, the time series with base year 2015=100.0 are available since 1st quarter 2000 (with the exception of the index of the division 81, whose time series starts from the 1st quarter 2010) and is comparable over time. |
|||
| 15.3. Coherence - cross domain | |||
Coherence – sub annual and annual statistics According to the Regulations No 58/97 of the Council and No 295/2008 of the European Parliament and Council, Structural Business Surveys (SBS) are conducted in order to compile annual structural business statistics, covering the various divisions of economic activity. As the structural business statistics are annual, comparisons are performed to examine the coherence of growth rates between the average annual turnover indices and the turnover produced by SBS. SBS and STS data are considered coherent taking into account the following: 1. There is a difference in the European definition of turnover between SBS and STS. Some differences that have been observed are mostly due to subsidies. 2. Regular crosschecksare made on the basis of comparisons with the results of other surveys, such as with the results of the Annual Structural Business Survey (SBS) as soon as they become available and there is a consistency in the trend of the indices. The deviations observed are due to the fact that the quarterly surveys of Turnover Indices keep constant the number of the monitored companies of the sample of the base year (2015 = 100) in the sample reductions, while the SBS uses a different number of companies each year. In addition, the survey of Turnover Indices is quarterly and results are announced no later than 75 days after the end of the surveyed quarter, while SBS is annual and results are announced no later than 18 months after the end of the reference year, therefore surveyed units have finalized their financial results for the reference year.
Coherence – National Accounts The Turnover Indices are available to the Division of National Accounts for their annual temporary estimations and the compilation of the quarterly National Accounts. Therefore, the rate of change of the index is coherent with the corresponding rate of change of GDP. |
|||
| 15.4. Coherence - internal | |||
The indices are internally coherent. The estimates of the index among all the variables and definitions of the survey have a high internal coherence, as a single database is used and their calculation is done by the same method. |
|||
|
|||
For the Turnover Indices for Specific Activities of the Services Sector, regarding the time burden of the surveyed enterprises, the average time spent by the enterprise for the needs of the questionnaire in 2022 is estimated to 9.7 minutes per hour. The estimation for the production cost of the Indices is not available. For the Turnover Indices for all the other sectors, there are not sufficient available data concerning the production cost of the surveyed enterprises. Given the fact that only one variable (turnover) is collected from the enterprises, the burden is estimated to 9.0 minutes per enterprise. |
|||
|
|||
| 17.1. Data revision - policy | |||
The indices are published 63-67 days after the end of the reference quarter, for the Transport Sector, the Tourism Sector and the Information and Communication Sector, 52-55 days after the end of the reference quarter. Moreover, in accordance with the requirements of the Council Regulation (EC) No 1165/98 concerning short-term statistics, the indices are revised every five (5) years, particularly in calendar years ending in 0 or 5. In this framework, the index in fully revised every five years, with the revision of the base year, the renewal of the sample of the enterprises and the implementation of new weighting scheme. The revision Policy of ELSTAT is implemented which is available at the following link: http://www.statistics.gr/en/policies. The same revision policy for all kind of revisions is applied to data released nationally and to those transmitted to Eurostat, in order to assure coherence. |
|||
| 17.2. Data revision - practice | |||
For the Transport Sector, the Tourism Sector and the Information and Communication Sector, the indices are provisional when first released. The indices are revised simultaneously with the publication of the next quarter. For the Turnover Indices for Specific Activities of the Services Sector, the indices are provisional when first released and become final as soon as all data collected become definite. More specifially, the data released for the most recent quarter are provisional and are published along with revised data of the previous quarter. Quarterly correction is made due to late reporting of respondents. Mean Revision (MR) and Mean Absolute Revision (MAR) are not calculated due to the fact that, for the time being, the total services turnover index is not calculated (the services turnover indices are calculated at division level). |
|||
|
||||||||||||||||||||||||||||||||||||||||||||||||||||||||||||||||||||||||||||||||||||||||||||||||||||||||||||||||||||||||||||||||||||||||||||||||||||||||||||||||||||||||||||||||||||||||||||||||||||||||||||||||||||||||||||||||||||||||||||||||||||||||||||||||||||||||||||||||||||||||||||||||||||||||||||||||||||||||||||||||||||||||||||||||||||||||||||||||||||||||||||||||||||||||||||||||||||||||||||||||||||||||||||||||||||||||||||||||||||||||||||||||||||||||||||||||||||||||||||||||||||||||||||||||||||||||||||||||||||||||||||||||||||||||||||||||||||||||||||||||||||||||||||||
| 18.1. Source data | ||||||||||||||||||||||||||||||||||||||||||||||||||||||||||||||||||||||||||||||||||||||||||||||||||||||||||||||||||||||||||||||||||||||||||||||||||||||||||||||||||||||||||||||||||||||||||||||||||||||||||||||||||||||||||||||||||||||||||||||||||||||||||||||||||||||||||||||||||||||||||||||||||||||||||||||||||||||||||||||||||||||||||||||||||||||||||||||||||||||||||||||||||||||||||||||||||||||||||||||||||||||||||||||||||||||||||||||||||||||||||||||||||||||||||||||||||||||||||||||||||||||||||||||||||||||||||||||||||||||||||||||||||||||||||||||||||||||||||||||||||||||||||||||
Turnover Index in Transport sector For the purposes of the survey for the compilation of the Turnover Index in Transport (2015=100.0), a representative sample of 440 enterprises was selected from the whole country that belong to branches of economic activities of the divisions 49, 50, 51, 52 and 79 of the statistical classification NACE Rev.2 “Transport”. The enterprises of the sample were selected on the basis of one-stage stratified random sampling. For each of the 2-digit branches of economic activity the surveyed enterprises were further stratified by size class (strata) on the basis of their annual turnover for the year 2015, as follows:
In Division 51 the data collection from enterprises are surveyed by census.
Turnover Index in Accommodation and Food Service Activities sector For the purposes of the survey for the compilation of the Turnover Index in Tourism (2015=100.0), a representative sample of 284 enterprises was selected from the whole country that belong to branches of economic activities of the groups 55 and 56 of the statistical classification NACE Rev.2 “Accommodation and Food Service Activities”. The enterprises of the sample were selected on the basis of the single random stratified sampling. For each of the 2-digit branches of economic activity the surveyed enterprises were further stratified by size class (strata) on the basis of their annual turnover for the year 2015 as follows:
Turnover Index in Information and Communication sector For the purposes of the survey for the compilation of the Turnover Index in Information and Communication sector (2015=100.0), a representative sample of 71 enterprises was selected from the whole country that belong to branches of economic activities of the divisions 59 and 60 of the statistical classification NACE Rev.2 “Information and Communication”. The enterprises of the sample were selected on the basis of one-stage stratified random sampling. For each of the 2-digit branches of economic activity the surveyed enterprises were further stratified by size class (strata) on the basis of their annual turnover for the year 2015 as follows:
The sampling units were allocated to the above ultimate strata by appling the optimal (Neyman) allocation. In each stratum, a systematic sample was selected with equal probabilities. In order for each stratum the sample to be representative by class and geography, implicit stratified sampling procedure was applied by using a sorted list (Regional Units within the classes) and then by taking a systematic sample from the sorted list using a fixed sampling interval and a random start. The enterprises that belong to the 9th size class are surveyed by census. Turnover Indices for Specific Activities of the Services Sector The survey for the compilation of the Turnover Indices for Specific Activities of the Services sector for the specific divisions (53,58,61,62,63,69,70.2,71,73,74,78,80,81,82) has as population of 12,857 enterprises with annual turnover equal to or higher than 50,000 euro, according to the BR of ELSTAT for the year 2015. As the collection of the necessary statistical data from such a large number of enterprises is not considered feasible, a representative sample of 1,076 enterprises throughout the country was selected instead. Single-stage stratified random sampling was used for the selection of the sample's enterprises. For each of the two-digit economic activity divisions, the enterprises included in the survey were stratified by size class (strata) on the basis of their annual turnover for the year 2015 as follows:
In Divisions 53 and 61 the data collection from enterprises are surveyed by census. |
||||||||||||||||||||||||||||||||||||||||||||||||||||||||||||||||||||||||||||||||||||||||||||||||||||||||||||||||||||||||||||||||||||||||||||||||||||||||||||||||||||||||||||||||||||||||||||||||||||||||||||||||||||||||||||||||||||||||||||||||||||||||||||||||||||||||||||||||||||||||||||||||||||||||||||||||||||||||||||||||||||||||||||||||||||||||||||||||||||||||||||||||||||||||||||||||||||||||||||||||||||||||||||||||||||||||||||||||||||||||||||||||||||||||||||||||||||||||||||||||||||||||||||||||||||||||||||||||||||||||||||||||||||||||||||||||||||||||||||||||||||||||||||||
| 18.2. Frequency of data collection | ||||||||||||||||||||||||||||||||||||||||||||||||||||||||||||||||||||||||||||||||||||||||||||||||||||||||||||||||||||||||||||||||||||||||||||||||||||||||||||||||||||||||||||||||||||||||||||||||||||||||||||||||||||||||||||||||||||||||||||||||||||||||||||||||||||||||||||||||||||||||||||||||||||||||||||||||||||||||||||||||||||||||||||||||||||||||||||||||||||||||||||||||||||||||||||||||||||||||||||||||||||||||||||||||||||||||||||||||||||||||||||||||||||||||||||||||||||||||||||||||||||||||||||||||||||||||||||||||||||||||||||||||||||||||||||||||||||||||||||||||||||||||||||||
Data are collected on a quarterly basis. |
||||||||||||||||||||||||||||||||||||||||||||||||||||||||||||||||||||||||||||||||||||||||||||||||||||||||||||||||||||||||||||||||||||||||||||||||||||||||||||||||||||||||||||||||||||||||||||||||||||||||||||||||||||||||||||||||||||||||||||||||||||||||||||||||||||||||||||||||||||||||||||||||||||||||||||||||||||||||||||||||||||||||||||||||||||||||||||||||||||||||||||||||||||||||||||||||||||||||||||||||||||||||||||||||||||||||||||||||||||||||||||||||||||||||||||||||||||||||||||||||||||||||||||||||||||||||||||||||||||||||||||||||||||||||||||||||||||||||||||||||||||||||||||||
| 18.3. Data collection | ||||||||||||||||||||||||||||||||||||||||||||||||||||||||||||||||||||||||||||||||||||||||||||||||||||||||||||||||||||||||||||||||||||||||||||||||||||||||||||||||||||||||||||||||||||||||||||||||||||||||||||||||||||||||||||||||||||||||||||||||||||||||||||||||||||||||||||||||||||||||||||||||||||||||||||||||||||||||||||||||||||||||||||||||||||||||||||||||||||||||||||||||||||||||||||||||||||||||||||||||||||||||||||||||||||||||||||||||||||||||||||||||||||||||||||||||||||||||||||||||||||||||||||||||||||||||||||||||||||||||||||||||||||||||||||||||||||||||||||||||||||||||||||||
Data are collected by specially designed questionnaires (for each division), which sent by email to the enterprises from trained private partners. Non-response is addressed by telephone or email reminder or personal visits to the enterprises. Data from administrative sources (the tax authorities) are also taken into account. |
||||||||||||||||||||||||||||||||||||||||||||||||||||||||||||||||||||||||||||||||||||||||||||||||||||||||||||||||||||||||||||||||||||||||||||||||||||||||||||||||||||||||||||||||||||||||||||||||||||||||||||||||||||||||||||||||||||||||||||||||||||||||||||||||||||||||||||||||||||||||||||||||||||||||||||||||||||||||||||||||||||||||||||||||||||||||||||||||||||||||||||||||||||||||||||||||||||||||||||||||||||||||||||||||||||||||||||||||||||||||||||||||||||||||||||||||||||||||||||||||||||||||||||||||||||||||||||||||||||||||||||||||||||||||||||||||||||||||||||||||||||||||||||||
| 18.4. Data validation | ||||||||||||||||||||||||||||||||||||||||||||||||||||||||||||||||||||||||||||||||||||||||||||||||||||||||||||||||||||||||||||||||||||||||||||||||||||||||||||||||||||||||||||||||||||||||||||||||||||||||||||||||||||||||||||||||||||||||||||||||||||||||||||||||||||||||||||||||||||||||||||||||||||||||||||||||||||||||||||||||||||||||||||||||||||||||||||||||||||||||||||||||||||||||||||||||||||||||||||||||||||||||||||||||||||||||||||||||||||||||||||||||||||||||||||||||||||||||||||||||||||||||||||||||||||||||||||||||||||||||||||||||||||||||||||||||||||||||||||||||||||||||||||||
At national level, the data processing includes check of the data collected by enterprises in order to identify and correct errors. Given the difficulty to identify all the errors, the objective is to identify those with significant impact on the results and to achieve great improvement in their resolution. Irregular prices are identified by rules, and further investigation is carried out in the case of error or outlier. While data processing, along with the completeness, it is checked if data are within a certain range of values, as well as if the relevant variables are logically consistent. The data processing can be performed on data acquisition time, during data entry or even afterwards. The data are compared with information of previous quarters and where large variations are identified (outside a predetermined range), there is a need for further investigation. The process can be designed so as the highest priority to be given to outliers with the greatest need for treatment, in order the reliability of the overall results to be ensured. Eurostat also carries out validation checks on national indices that receives and makes contacts with the country, when necessary, in order to confirm the correctness of outliers. |
||||||||||||||||||||||||||||||||||||||||||||||||||||||||||||||||||||||||||||||||||||||||||||||||||||||||||||||||||||||||||||||||||||||||||||||||||||||||||||||||||||||||||||||||||||||||||||||||||||||||||||||||||||||||||||||||||||||||||||||||||||||||||||||||||||||||||||||||||||||||||||||||||||||||||||||||||||||||||||||||||||||||||||||||||||||||||||||||||||||||||||||||||||||||||||||||||||||||||||||||||||||||||||||||||||||||||||||||||||||||||||||||||||||||||||||||||||||||||||||||||||||||||||||||||||||||||||||||||||||||||||||||||||||||||||||||||||||||||||||||||||||||||||||
| 18.5. Data compilation | ||||||||||||||||||||||||||||||||||||||||||||||||||||||||||||||||||||||||||||||||||||||||||||||||||||||||||||||||||||||||||||||||||||||||||||||||||||||||||||||||||||||||||||||||||||||||||||||||||||||||||||||||||||||||||||||||||||||||||||||||||||||||||||||||||||||||||||||||||||||||||||||||||||||||||||||||||||||||||||||||||||||||||||||||||||||||||||||||||||||||||||||||||||||||||||||||||||||||||||||||||||||||||||||||||||||||||||||||||||||||||||||||||||||||||||||||||||||||||||||||||||||||||||||||||||||||||||||||||||||||||||||||||||||||||||||||||||||||||||||||||||||||||||||
The Turnover Indices of the Services Sector are compiled on the basis of the chain-linking method. Firstly, the moving-base index was calculated, by comparing the “estimated” turnover value The estimate of turnover value in current month is based on a reduction in all relevant data from the enterprises sample. This is achieved by multiplying the monthly turnover value of each enterprtise, with a suitable reduction factor and then summing up of the products. This factor, for each stratum h (intersection of activity and class of enterprises turnover size) is defined as the quotient of the total number of Nh enterprises, by the number of enterprises of the nh sample, which corresponded. The reduction factor ah for each enterprise in stratum (class) h is given by the equation:
where: Nh is the total number of enterprises in stratum h nh is the number of enterprises that responded in stratum h of the sample. The estimate of the turnover value
where yqhi is the turnover value for the current quarter q of the ith enterprise in stratum h=1,2,3,…l, and l, the number of stratums in each two-digit level of economic activity. The fixed-base index for each two-digit level of economic activity for the current quarter q, is thus obtained by multiplying the moving-base index by the fixed-base index of the previous quarter. The above is a consequence of the types: and where:
The time series of the indices was revised with base year 2015=100,0 by multiplying the indices calculated with base year 2010=100,0 by the following weighting coefficient:
Imputation – rate Usually, imputed values are not used to substitute turnover values in the enterprises sample. However, in few cases, imputed prices are used, the percentage of which does not exceed 0,01%. The procedure for handling missing values is to estimate them (imputed values), based on the turnover of the enterprises in previous years, taking into account the evolution of the rate of changes of the value of turnover in the economic activity sector; the class of size of the enterprise and the trend of the administrative data of the enterprise. |
||||||||||||||||||||||||||||||||||||||||||||||||||||||||||||||||||||||||||||||||||||||||||||||||||||||||||||||||||||||||||||||||||||||||||||||||||||||||||||||||||||||||||||||||||||||||||||||||||||||||||||||||||||||||||||||||||||||||||||||||||||||||||||||||||||||||||||||||||||||||||||||||||||||||||||||||||||||||||||||||||||||||||||||||||||||||||||||||||||||||||||||||||||||||||||||||||||||||||||||||||||||||||||||||||||||||||||||||||||||||||||||||||||||||||||||||||||||||||||||||||||||||||||||||||||||||||||||||||||||||||||||||||||||||||||||||||||||||||||||||||||||||||||||
| 18.6. Adjustment | ||||||||||||||||||||||||||||||||||||||||||||||||||||||||||||||||||||||||||||||||||||||||||||||||||||||||||||||||||||||||||||||||||||||||||||||||||||||||||||||||||||||||||||||||||||||||||||||||||||||||||||||||||||||||||||||||||||||||||||||||||||||||||||||||||||||||||||||||||||||||||||||||||||||||||||||||||||||||||||||||||||||||||||||||||||||||||||||||||||||||||||||||||||||||||||||||||||||||||||||||||||||||||||||||||||||||||||||||||||||||||||||||||||||||||||||||||||||||||||||||||||||||||||||||||||||||||||||||||||||||||||||||||||||||||||||||||||||||||||||||||||||||||||||
The indices are adjusted to the working days of the months of the quarters. The indices are reduced to a typical quarter by multiplying the estimated turnover values by a specific correction factor according to the number of working days of each quarter. The typical quarter refers to the actual number of working days. The correction factor ct is obtained by dividing the average quarterly number of working days of the current year by the number of working days of the surveyed quarter as follows:
where: These weighting coefficient are reviewed annually.
Seasonal adjustment The Turnover Indices in Wholesale Trade, Motor Trades, Transport Sector, in Tourism Sector, in Information and Communication Sector and for Specific Activities of the Services Sector are seasonally adjusted by applying the TRAMO-SEAT method with the use of JDemetra+ 2.0.0. The whole time series with seasonally adjusted indices is recalculated every time a new observation is added in time series. |
||||||||||||||||||||||||||||||||||||||||||||||||||||||||||||||||||||||||||||||||||||||||||||||||||||||||||||||||||||||||||||||||||||||||||||||||||||||||||||||||||||||||||||||||||||||||||||||||||||||||||||||||||||||||||||||||||||||||||||||||||||||||||||||||||||||||||||||||||||||||||||||||||||||||||||||||||||||||||||||||||||||||||||||||||||||||||||||||||||||||||||||||||||||||||||||||||||||||||||||||||||||||||||||||||||||||||||||||||||||||||||||||||||||||||||||||||||||||||||||||||||||||||||||||||||||||||||||||||||||||||||||||||||||||||||||||||||||||||||||||||||||||||||||
 of the data of the sample enterprises of the current quarter with the corresponding value
  of the previous quarter. The fixed-base index at each two-digit level of economic activity of the current quarter is calculated by multiplying the moving-base index by the fixed-base index of the previous quarter.
 for the current quarter q, in any two-digit division of economic activity, is given by the equation:
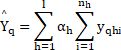
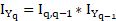

 is the moving-base index for the current quarter q, in relation to the previous quarter q-1,
 is the fixed-base index for the current quarter q,
 is the fixed-base index for the previous quarter q-1, and
 ,
,  are the corresponding turnover estimates for the current and previous quarters.
 , where:
  , is the average of the indices of the year 2015 with base year 2010=100.0.
 : the average quarterly number of working days, of the current year,
 : the number of working days in quarter t.
|
|||
None |
|||
|
|||
|
|||