|
 |
| For any question on data and metadata, please contact: Eurostat user support |
|
|||
| 1.1. Contact organisation | Hellenic Statistical Authority (ELSTAT) |
||
| 1.2. Contact organisation unit | Business Statistics Division (B3) Manufacture – Construction Indices and Industrial Products Section (B33) Trade and Services Indices Section (B34) |
||
| 1.5. Contact mail address | 46 Pireos & Eponiton str. 18510 Piraeus Greece |
||
|
|||
| 2.1. Metadata last certified | 14/06/2023 | ||
| 2.2. Metadata last posted | 14/06/2023 | ||
| 2.3. Metadata last update | 14/06/2023 | ||
|
|||
| 3.1. Data description | |||
The Labour Input Indicators (Number of employees and self-employed persons, Hours worked by employees, Gross wages and salaries) are quarterly indices concerning the sections of economic activities B to E (Mining and Quarrying, Manufacturing, Electricity Supply and Water Supply), F (Construction), G (Trade - divisions 45,46,47), H to J and M to N (Other Services) of the statistical classification of economic activities NACE Rev. 2 of EU, having 2015 as the base year (2015=100.0). Data are disseminated for the sections B, C, D, E, F, G, H, I, J, M, and N, the divisions 05-09 of section B, 10-33 of section C, 35 of section D, 36 of section E, 45-46-47 of section G, for the main industrial groupings (capital goods, intermediate goods, durable consumer goods, non-durable consumer goods and energy), for specific aggregates (e.g. B to E, B to F, H to N (excl. K, M701, M72 and M75), and in addition for the codes 4711-4799 of the div.47 (where referred to indices of Number of employees and self-employed persons, Hours worked by employees, Gross wages and salaries in Retail Trade), of the statistical classification of economic activities NACE Rev.2. No geographical breakdown is made for the above data. Data are quarterly and are presented in the form of indices and growth rates. Each quarter, unadjusted series for all indicators are calculated, whereas for hours worked by employees and gross wages and salaries, additionally, calendar adjusted series and seasonally adjusted series are calculated. |
|||
| 3.2. Classification system | |||
For the compilation of the indices the Statistical classification of economic activities NACE Rev. 2 in the European Community (pursuant to Regulation (EC) No 1893/2006 of the European Parliament and of the Council) is used. |
|||
| 3.3. Coverage - sector | |||
The Labour Input Indicators cover the economic activities listed in the Sections B: Mining and quarrying, C: Manufacturing, D: Electricity, gas, steam and air conditioning supply, E: Water supply, sewerage, waste management and remediation activities, F: Construction, G: Trade, H: Transportation and Storage, I: Accommodation and Food Service Activities, J: Information and Communication, M: Professional, Scientific and Technical Activities and N: Administrative and Support Service Activities, as defined in the statistical classification NACE Rev. 2. |
|||
| 3.4. Statistical concepts and definitions | |||
NUMBER OF EMPLOYEES AND SELF-EMPLOYED PERSONS The objective of the index of number of employees and self-employed persons is to show the development of employment on a quarterly basis in sections of economic activities B to E (Mining and Quarrying, Manufacturing, Electricity Supply and Water Supply), F (Construction), G (Trade), H to J and M to N (Other Services) of the statistical classification NACE Rev. 2. The Number of employees and self-employed persons is defined as the total number of persons employed in the enterprise, irrespectively of their status (owners, partners and their family members) and the nature of their work (managers, sales persons and auxiliary staff) and irrespectively of whether they work temporarily or seasonally, full-time or part-time employment, with or without remuneration. Employment figures are recorded on the first day of the third month of the reference quarter and refer to the total number of persons working for the enterprise, as follows:
HOURS WORKED BY EMPLOYEES The objective of the hours worked by employees index is to show the development in the volume of work done on a quarterly basis in sections of economic activities B to E (Mining and Quarrying, Manufacturing, Electricity Supply and Water Supply), F (Construction), G (Trade), H to J and M to N (Other Services) of the statistical classification NACE Rev. 2. The total number of hours worked by employees represents the aggregate number of hours actually worked for the output of the enterprise during the reference period. It includes hours actually worked during regular working hours; hours worked overtime, whether paid or unpaid; hours worked during nights, Sundays or public holidays. It also includes the time which is spent at the place of work on tasks such as preparing the site and time corresponding to short periods of rest at the work place. This variable excludes hours paid but not actually worked such as for annual leave, holidays and sickness leave.
WAGES AND SALARIES The objective of the wages and salaries index is to approximate the development of the wage and salaries bill on a quarterly basis in sections of economic activities B to E (Mining and Quarrying, Manufacturing, Electricity Supply and Water Supply), F (Construction), G (Trade), H to J and M to N (Other Services) of the statistical classification NACE Rev. 2. Wages and salaries are defined as the total remuneration, in cash or in kind, payable to all persons counted on the payroll (including home workers), in return for work done during the accounting period, regardless of whether it is paid on the basis of working time, output or piecework and whether it is paid regularly. Wages and salaries include direct remuneration, bonuses, allowances, gratuities, tips, commissions, payments to employees’ saving schemes, payments for days not worked, wages and salaries in kind, company products, staff housing, company cars, stock options and purchase schemes, amounts to be withheld by the employer (social security contributions of the employee, personal income tax, etc.). |
|||
| 3.5. Statistical unit | |||
The sampling unit used is the enterprise (legal unit). |
|||
| 3.6. Statistical population | |||
The statistical population refers to all enterprises classified in sections of economic activities B to E (Mining and Quarrying, Manufacturing, Electricity Supply and Water Supply), F (Construction), G (Trade), H to J and M to N (Other Services) of the statistical classification NACE Rev. 2 with employment of at least 5 employees, whereas in div.47 (retail trade), there is not such limitation on the employees. |
|||
| 3.7. Reference area | |||
The survey covers the whole country. No activities outside the national territory are covered. |
|||
| 3.8. Coverage - Time | |||
The time series of the indices are being released on a quarterly basis. The time series of the indices of Number of employees and self-employed persons, Hours worked by employees, Gross wages and salaries for industry and construction start from Q1 2000. The time series of the index of number of employees and self-employed persons for services starts from Q1 2000. The time series of the index of hours worked by employees, gross wages and salaries for services start from Q1 2010. |
|||
| 3.9. Base period | |||
The base year is the year 2015 (2015=100.0). |
|||
|
|||
The data are published at national level as indices, quarter-on-quarter growth rates (%), year-on-year growth rates (%). The data are transmitted to Eurostat as indices. |
|||
|
|||
The reference period is the quarter. |
|||
|
|||
| 6.1. Institutional Mandate - legal acts and other agreements | |||
The legal framework concerning the organization and operation of ELSTAT is as follows:
The Legal Framework is detailed in the following link: http://www.statistics.gr/en/legal-framework
EU legislation: The legal basis is Regulation (EU) 2019/2152 of the European Parliament and of the Council on Business Statistics, as well as Commission Implementing Regulation (EU) 2020/1197 laying down technical specifications and regulations pursuant to Regulation (EU) 2019/2152. In addition, Regulation (EC) No. 1893/2006 of the European Parliament and of the Council on the establishment of the statistical nomenclature of economic activities NACE Rev. 2. The definitions of short-term statistics (STS) variables and the classification by main industrial groups (MIG), are defined in Implementing Regulation (EU) no. 2020/1197 of the Commission. |
|||
| 6.2. Institutional Mandate - data sharing | |||
The Labour Input Indicators are transmitted to Eurostat according to EU legislation. |
|||
|
|||
| 7.1. Confidentiality - policy | |||
The issues concerning the observance of statistical confidentiality by the Hellenic Statistical Authority (ELSTAT) are arranged by articles 7, 8 and 9 of the Law 3832/2010 as in force, by Articles 8, 10 and 11(2) of the Regulation on Statistical Obligations of the agencies of the Hellenic Statistical System and by Articles 10 and 15 of the Regulation on the Operation and Administration of ELSTAT. More precisely: ELSTAT disseminates the statistics in compliance with the statistical principles of the European Statistics Code of Practice and in particular with the principle of statistical confidentiality. http://www.statistics.gr/en/statistical-confidentiality?inheritRedirect=true |
|||
| 7.2. Confidentiality - data treatment | |||
ELSTAT protects and does not disseminate data it has obtained or it has access to, which enable the direct or indirect identification of the statistical units that have provided them by the disclosure of individual information directly received for statistical purposes or indirectly supplied from administrative or other sources. ELSTAT takes all appropriate preventive measures so as to render impossible the identification of individual statistical units by technical or other means that might reasonably be used by a third party. Statistical data that could potentially enable the identification of the statistical unit are disseminated by ELSTAT if and only if: a) These data have been treated, as it is specifically set out in the Regulation on Statistical Obligations of the agencies of the Hellenic Statistical System (ELSS), in such a way that their dissemination does not prejudice statistical confidentiality or b) The statistical unit has given its consent, without any reservations, for the disclosure of data. The confidential data that are transmitted by ELSS agencies to ELSTAT are used exclusively for statistical purposes and the only persons who have the right to have access to these data are the personnel engaged in this task and appointed by an act of the President of ELSTAT. ELSTAT may grant researchers conducting statistical analyses for scientific purposes access to data that enable the indirect identification of the statistical units concerned. The access is granted provided the following conditions are satisfied: a) An appropriate request together with a detailed research proposal in conformity with current scientific standards have been submitted; b) The research proposal indicates in sufficient detail the set of data to be accessed, the methods of analyzing them, and the time needed for the research; c) A contract specifying the conditions for access, the obligations of the researchers, the measures for respecting the confidentiality of statistical data and the sanctions in case of breach of these obligations has been signed by the individual researcher, by his/her institution, or by the organization commissioning the research, as the case may be, and by ELSTAT. Issues referring to the observance of statistical confidentiality are examined by the Statistical Confidentiality Committee (SCC) operating in ELSTAT. The responsibilities of this Committee are to make recommendations to the President of ELSTAT on:
The staff of ELSTAT, under any employment status, as well as the temporary survey workers who are employed for the collection of statistical data in statistical surveys conducted by ELSTAT, who acquire access by any means to confidential data, are bound by the principle of confidentiality and must use these data exclusively for the statistical purposes of ELSTAT. After the termination of their term of office, they are not allowed to use these data for any purpose. Violation of data confidentiality and/or statistical confidentiality by any civil servant or employee of ELSTAT constitutes the disciplinary offence of violation of duty and may be punished with the penalty of final dismissal. ELSTAT, by its decision, may impose a penalty amounting from ten thousand (10,000) up to two hundred thousand (200,000) euros to anyone who violates the confidentiality of data and/or statistical confidentiality. The penalty is always imposed after the hearing of the defense of the person liable for the breach, depending on the gravity and the repercussions of the violation. Any relapse constitutes an aggravating factor for the assessment of the administrative sanction. Confidentiality -if data are of truly confidential nature according to article 20 of Regulation (EC) No 223/2009 of the European Parliament and of the Council of 11 March 2009 (data which allow statistical units to be identified, either directly or indirectly), they are flagged as confidential and are not published. Eurostat is legally bound to suppress such data from publication as well. |
|||
|
|||
| 8.1. Release calendar | |||
Each year ELSTAT publishes a release calendar with the precise release dates of statistics for the following year. |
|||
| 8.2. Release calendar access | |||
The calendar is distributed to the press and is available to all interested parties free of charge. This calendar is also posted on ELSTAT’s website (http://www.statistics.gr/en/home/) under the item “Release Calendar”. |
|||
| 8.3. Release policy - user access | |||
In line with the Community legal framework and the European Statistics Code of Practice, ELSTAT disseminates national statistics on ELSTAT’s website respecting professional independence and in an objective, professional and transparent manner in which all users are treated equitably. In this content, data are released simultaneously to all interested parties and users through an Announcement on the the Employment Indices (Persons employed, Hours worked by employees, Gross wages and salaries), which is posted on the website of ELSTAT (http://www.statistics.gr/en/home/) according to the release calendar. This Announcement is also available by e-mail to all interested parties. In addition, data are transmitted to Eurostat on a predefined date, concomitantly with their national publication. |
|||
|
|||
Data are disseminated on national level on a quarterly basis. Data are also transmitted to Eurostat on a quarterly basis. |
|||
|
|||
| 10.1. Dissemination format - News release | |||
Every quarter, 75 days after the end of the reference quarter, at 12.00, an Announcement is published which presents the newly calculated Employment Indices (Number of employees and self-employed persons, Hours worked by employees, Gross wages and salaries) in Greek and English. The Announcement is sent, free-of-charge, and mostly by email to the press and to other interested parties. It is also available on the website of ELSTAT: (https://www.statistics.gr/en/statistics/-/publication/DKT03/-). The Employment Indices are published as following: - gross indices (base year 2015=100.0), - quarter-on-quartergrowth rates, - year-on-year growth rates. |
|||
| 10.2. Dissemination format - Publications | |||
The Labour Input Indicators (Number of employees and self-employed persons, Hours worked by employees, Gross wages and salaries) are not published in other publications. |
|||
| 10.3. Dissemination format - online database | |||
There is no on-line database for the indices. |
|||
| 10.4. Dissemination format - microdata access | |||
Micro-data are made available to users after submitting a request to the: Statistical Information and Publications Division 46, Pireos & Eponiton Str, PO Box 80847 18510 Piraeus Tel: +30 213 135 2022 e-mail: data.dissem@statistics.gr For confidential reasons, access to micro-data is granted to users only under strict conditions and by always adhering to the relevant procedure. More information is available at the following link: |
|||
| 10.5. Dissemination format - other | |||
Users can have access to ELSTAT publications, even for previous years, which are posted on the digital library of ELSTAT, through: http://dlib.statistics.gr/portal/page/portal/ESYE.
Data are sent to Eurostat and published in Eurostat online database https://ec.europa.eu/eurostat/web/short-term-business-statistics/
The results of the Labour Input Indicators are posted on the website of ELSTAT, at the link: https://www.statistics.gr/en/statistics/-/publication/DKT03/-.
Users can be given data or further analysis, usually by e-mail after submitting a request, describing the requested data, at the following link: http://www.statistics.gr/en/statistical-data-request. Users can also contact the Data Dissemination Section, at the following e-mail address: |
|||
| 10.6. Documentation on methodology | |||
The methodology for the compilation of the indices is laid down by ELSTAT, taking into account international practices and in particular Eurostat’s recommendations, guidelines and standards.
The Methodology of Short-term Business Statistics, Interpretation and guidelines, 2006, contains a comprehensive set of recommendations on the compilation of the STS statistics. It is available at the link: http://ec.europa.eu/eurostat/web/short-term-business-statistics/methodology.
A special methodological paper on the compilation of the theindices in Greece is available on the website of ELSTAT (http://www.statistics.gr/en/home/) containing detailed information on the sources and the methodology used through the link: https://www.statistics.gr/en/statistics/-/publication/DKT03/-.
Metadata completeness – rate Metadata on the compilation of the Labour Input Indicators are available on the webpage of ELSTAT (http://www.statistics.gr/en/home/), therefore metadata completeness is 100%. |
|||
| 10.7. Quality management - documentation | |||
A Single Metadata Structure (SIMS) report is available at the link: https://www.statistics.gr/en/statistics/-/publication/DKT03/-. |
|||
|
|||
| 11.1. Quality assurance | |||
The Hellenic Statistical Authority (ELSTAT) aims to ensure and further improve the quality of statistics produced and maintain the confidence of users in them. This is achieved through the Quality Policy of ELSTAT which is posted on the website of ELSTAT and is available at the following link: http://www.statistics.gr/en/policies.
Quality controls and validation of data are carried out during the whole process of the compilation of the indices: from the data collection stage to the final compilation of the indices. First of all, well-trained and experienced staff is utilized for all the stages of the compilation of the indices, that is, for data collection including communication with the enterprises, initial checks, data entry and final checks, which are conducted after the calculation of the index. This way, the personnel have a comprehensive and longitudinal knowledge of the enterprises under their responsibility. Data are validated either before or after data entry to the data base of ELSTAT by means of logical checks. Initially, basic quality checks are applied, along with checks for completeness, accuracy and consistency of the correlating variables. Afterwards, the collected questionnaires are checked in terms of the rates of change in the various variables (number of employees and self-employed persons, hours worked by employees, gross wages and salaries) in comparison with the previous quarters and with the corresponding quarter of the previous year. If differences are rather significant (outside of a pre-established range) and cannot be justified by the size of the enterprise or seasonality, data are further investigated, in cooperation with the enterprises in order to confirm whether this is an erroneous value or it is just an unusual value (outlier), before approving the questionnaire. Moreover, data are compared with the results of the Labour Force survey, upon availability. After the completion of all the aforementioned checks, the possibility of processing errors is minimized. The indices are calculated by means of specialised software, through automatic computation procedures (“routines”), thus eliminating any errors to the final results. Nevertheless, even during this stage, consistency checks are carried out to the final results, mainly by means of comparing the percentage changes of the sub-indices and their impact on the overall indices. |
|||
| 11.2. Quality management - assessment | |||
The indices are considered to be of high quality (reliable indices), because:
|
|||
|
|||
| 12.1. Relevance - User Needs | |||
The indices meet national needs as well as needs to fulfil obligations arising from the implementation of European Regulations. Generally, the index provides statistical information, which is necessary for improving the competitiveness and performance of the business community. The main national users of the indices are the government, ministries, other public agencies, the Central Bank of Greece, other Hellenic banks, enterprises, chambers, economic analysts, universities, research institutes,etc., while at international level, the indices are used by Eurostat, the International Monetary Fund (IMF), the United Nations (UN), OECD, etc. The compiled indices cover the wide range of users’ needs: as concerns domestic market, the indices are used as a tool providing useful information on the evolution of employment, competitiveness and productivity of the business sector, thus aiding the government in drawing economic policy and entrepreneurs or other agencies in decision making concerning remuneration policy and taking up several initiatives. At European level, there is the need for exhaustive, up to date, reliable and comparable information on the activity, competitiveness and performance of enterprises in the Community, in order to draw the European economic policy and assist decision making.
|
|||
| 12.2. Relevance - User Satisfaction | |||
The Manufacture-Construction Indices and Industrial Products Section monitors user needs on a regular basis, in order to satisfy them. Generally, there is a smooth cooperation, through prompt response to users’ requests. Users’ comments are positive. Moreover, ELSTAT conducts a user satisfaction survey every six months. Comments on media are also positive. More information about the results of the survey is available at the following link: http://www.statistics.gr/en/user-satisfaction-survey. Furthermore, ELSTAT organises a Users Conference, on an annual basis, in which representatives of private and public sector, educational and research institutions participate. The conferences provide a significant opportunity for ELSTAT to collect comments and suggestions from users relative to the dissemination and the accessibility of the statistical data and the gaps in the production of statistics. The users conferences help significantly ELSTAT to draw useful conclusions on the areas where the statistical products and services can be improved in order to meet the increasing users needs. These conclusions are incorporated in the annual and medium term statistical programs of ELSTAT. More information about user conferences at the link: |
|||
| 12.3. Completeness | |||
The compilation of the indices and the data provided are in line with the relevant EU Regulations.
|
|||
|
|||
| 13.1. Accuracy - overall | |||
The errors that have an impact on the accuracy of the indices are sampling errors and non-sampling errors. a) Sampling errors are due to the fact that the survey is not conducted on all the enterprises ofthe target population but ona sample of these enterprises. The sample size ensures accurate estimates as regards both the overall indices andthe sub-indices. b) Non-sampling errors mostly referto measurement errors and non-response errors, on account of non-response of the sample enterprises. Any measurement errors duringdata collection are identified by means of quality checks and are duly corrected.As regards non-responseerrors, telephone contacts and field visits are conducted in order to increase the response rate and reduce the impact of non response on the accuracy of the index. Therefore, the overall accuracy of the indices is generally considered to be high. |
|||
| 13.2. Sampling error | |||
Sampling errors are due to the fact that the survey is not conducted on all the enterprises of the target population but on a sample of these enterprises. Sampling errors can be measured on the basis of the features of sampling design and response. |
|||
| 13.3. Non-sampling error | |||
Non-sampling errors involve coverage errors, measurements errors, non-response errors, processing errors and model errors. Unit non – response These errors exist when data are not collected for all population units designated for data collection. Non-response of the enterprises is addressed by sending reminder letters via fax or e-mail, by calling the enterprises or by paying a visit to the enterprise, in order to collect the requested data.Response rate as regards employment size classes and the total population is quite satisfactory. In the census strata, where all the population units have been included in the sample, unit response areusually quite high, but not 100% for all the combinations of sectionsand size classes, on account of non-response of some enterprises. Consequently, some census strata become sampling strata, thus increasing sampling error for the survey characteristics.In order to address non-response, imputation is used since the compilation of indices necessitates data from consecutive quarters. Item non - response In case of item non-response, missing values are imputed.
Coverage error The survey covers the enterprises employing more than 5 employees. During the period from the drawing of the sample to the conduct of the survey, some sampling units (enterprises) changed the designing of the strata after data collection. These units were allocated to new strata (employment size classes, divisionof economic activity) maintaining their initial probability of selection. Thisfact changed the initial variation of data, the initial allocation of the sample enterprises, thus inflating the variation of estimations. Therefore, the coefficient of variation of the produced statistics was higher than the coefficient of variation which had been calculated on the basis of the sample design. Over-coverage – rate In cases where an enterprise is found to be out of the scope of the survey (closed enterprises,enterprises employing less than 5 employees), the enterprise is excluded from the survey. This fact results to the reduction of the initial size of the sample. In addition, some enterprises, even though they satisfied the inclusion criteria, are not included in the sample, because theystart operating in a laterstage. This fact results in under-coverage and underestimation of the produced statistics. Common units – proportion Not applicable.
Measurement error These are errors that occur during data collection and they are categorized as survey instrument, respondent and interviewer. Regarding survey instrument errors, for the compilation of the indices, data are collected through a specially designed questionnaire. The structure and the size of the questionnaire make it friendly to statistical interviewers and respondents. The questions are clearly stated using the appropriate language and terminology. Furthermore, the questionnaire is accompanied with concrete instructions on the filling, covering analytically all the survey variables. All the above ensure the completeness and the correct fill-in of the collected questionnaires, thus eliminating any measurement errors arising from the questionnaire. Interviewer errors are not very common. The questionnaires are filled in through personal interviews in the enterprises. This method ensures high quality data, since the statistical interviewers assist the respondent to filling in the questionnaire and they check the filled in questionnaires before leaving the enterprise.Thestatisticalinterviewers are normally external survey workers and, if necessary, experienced permanent employees of ELSTAT. The interviewers are duly trained during training seminars before the conduct of the survey. The purpose of the training seminars is to enable the interviewers to a) fully understand the definitions and the variables of the survey, b) correctly fill in the survey questionnaire and c) check the questionnaires for any errors through logical checks. Respondent errors are the most frequent type of errors. In this context, erroneous data may be provided by the surveyed enterprises. These errors are usually easy to identify, as there are in force rules to assist in detecting possible inconsistencies that require further investigation in order to determine whether they are actually errors or just unusual values. Current responses are compared with data provided by the enterprises during the previous quarters or years. Moreover, comparisons with data of other similar variables for which data are also collected (e.g. turnover) at unit level are taking place regularly. The vast majority of these errors, after being detected, are duly corrected.
Processing error Processing errors are errors that may occur when processing the collected data, manually or automatically and comprise of data entry, data editing, coding and imputation. Once collected, the data are processed in order to compile the indices.More specifically, once the data are gathered in the central offices of ELSTAT, the following statistical actions take place: codification, logical checks, data entry and comparison with other sources of statistical information.After the completion of all the final checks in order to identify any non-sampling errors, the following actions take place:
Model assumption error No model is used for the compilation of the indices, so this type of error is not relevant. |
|||
|
|||
| 14.1. Timeliness | |||
The indices are published 75 days after the end of the reference quarter. |
|||
| 14.2. Punctuality | |||
The Labour Input Indicators are published according to the pre-announced release calendar. Any delays in the release of data are due exclusively to extraordinary events. Users are informed in advance of such delays through a relevant announcement. |
|||
|
|||
| 15.1. Comparability - geographical | |||
The Regulation (EU) No 2019/2152 of the European Parliament and of the Council on European Business Statistics, as well as Commission Implementing Regulation (EU) No 2020/1197 laying down technical specifications and arrangements pursuant to Regulation (EU) No 2019/2152 are applied for the compilation of the indices, thus ensuring a good comparability between the Greek indices and the other national and European indices, taking always into account any special conditions prevailing in each country, which may dictate minor methodological deviations.
Assymetry for mirror flows statistics – coefficient There are nomirror flows statistics among EU Member States in the indices. |
|||
| 15.2. Comparability - over time | |||
The available full time series of the revised indices of Number of employees and self-employed persons, Hours worked by employees, Gross wages and salaries for industry and construction and the index of persons employed for services (2015=100.0) consists of the backcasted indices for the period Q1 2000 – Q3 2018 and of the re-calculated indices using the new weighting scheme from Q4 2018 and onwards. The available full time series of the revised indices of hours worked by employees, gross wages and salaries for services (2015=100.0) consists of the backcasted indices for the period Q1 2010 – Q3 2018 and of the re-calculated indices using the new weighting scheme from Q4 2018 and onwards. Therefore, the time series of the indices with base year 2015=100.0, which is available from Q1 2000 or Q1 2010 (depending on the variable and the section) onwards, is considered fully comparable over time. |
|||
| 15.3. Coherence - cross domain | |||
Regular crosschecks are carried out on the basis of information from the other surveys. The results of the indices are compared with the results from the Structural Business Survey (SBS) and the Labour Force Survey, once the annual or quarterly results respectively are made available.
Coherence – sub annual and annual statistics Coherence with Annual Industrial Survey (SBS) The results of the two surveys are regurarly compared.The differences observed in the growth rates between the indices and the SBS statistics are mainly due to the fact that for the compilation of the indices a common sample of enterprises is used for every quarter, which is updated when the index is revised with new base year, while in the SBS surveys the sample of enterprises is updated on a yearly basis, except of very large size enterprises. The common sample of enterprises that is used in the indices ensures accurate presentation of the evolution of the indices over several time periods. Moreover, the differences are due to the different definitions and provisions of each survey.
Coherence with Labour Force Survey (LFS) The indices of number of employees and self-employed persons and hours worked by employees are compared with the corresponding data from the Labour Force Survey on a quarterly basis. Any differences observed in the growth rates between the two surveys are are mostly due to the fact that for the compilation of the indices a sample of enterprises is used, while for the compilation of statistics in LFS, a sample of households is used. Furthermore, the Labour Force Survey records the average quarterly employment, while the index of persons employed records the employment for a specific day of quarter.
Coherence – National Accounts The data are compared with National Accounts by ELSTAT and Eurostat. |
|||
| 15.4. Coherence - internal | |||
The indices are internally coherent. Higher-level aggregates derive from their components according to well-defined procedures (appropriate weighting scheme). |
|||
|
|||
According to the results of the Cost Assessment Survey covering the production of statistics in the ESS for the year 2022 launch by Eurostat and carried out by ELSTAT, it can be concluded that, regarding the staff of ELSTAT engaged in the compilation of the indices, the annual cost in hours worked amounts to 365. Regarding the response burden of the surveyed statistical units, it should be mentioned that the questionnaire which is used for the survey of the Labour Input Indicators is a joint questionnaire also used for Labour Cost Indices Survey and the Jobs Vacancy Survey. Therefore, the administrative burden of respondents is significantly reduced, since many of the questions are common for the three aforementioned surveys.The total time needed for the completion of the questionnaire ranges from 20 to 60 minutes, depending on the size of the enterprise. Efforts are made to acquire access to relevant administrative sources (Social Security Found - EFKA), in order to reduce the administrative burden of the enterprises. Regarding the staff of ELSTAT that is involved in the compilation of the retail trade index (div.47), the annual cost, in working hours in 2022, amounts to 3,483 hours and the working time required to provide a responsed questionnaire in 2022, is 20.0 minutes per surveyed enterprise of the retail trade index (div.47).
|
|||
|
|||
| 17.1. Data revision - policy | |||
The general revision policy adopted by ELSTAT, which is also applied to Labour Input Indicators, is available at the link: http://www.statistics.gr/en/policies.
In accordance with the Revision Policy of ELSTAT and the ESS guidelines, the revisions are classified as planned revisions, which refer to routine revisions and major revisions, and non-scheduled revisions. Routine revisions The unadjusted indices are published 75 days after the end of each reference quarter. The unadjusted data for the reference quarter are considered final and they are not subject to revisions, since they are not based on estimates. For some quarters, the indices may be subject to revisions (but not on a permanent basis), as there might be estimates for a small share of enterprises caused by delayed reporting (estimated values for missing responses are replaced by reported figures). A relevant comment is included in the relevant Press Release in such cases. The unadjusted indices, along with the calendar and seasonally adjusted data, are also transmitted to Eurostat, according to the calendar of data transmission to Eurostat. The calendar and seasonally adjusted data are characterised as provisional and are revised each quarter with the addition of the new observations in the time series. The routine revisions of the indices, if any, are included in the list of scheduled revisions of ELSTAT, which is available at the link: http://www.statistics.gr/en/scheduledrevisions.
Major revisions In accordance with the requirements of the Council Regulation (EC) No 2019/2152 on Business Statistics and Commission Implementing Regulation (EU) No 2020/1197, short-term indices are revised every five (5) years, particularly in calendar years ending in 0 or 5. In this framework, the indices are fully revised every five years, with the change of the base year and the implementation of new weighting scheme. Major revisions are pre-announced to the public through special methodological papers. In addition, a relevant text on the planned revision of the indices is included in the Annual Statistical Work Programs of ELSTAT. Moreover, major revisions are accompanied at the time of the publication with updated back data.
Non-scheduled revisions Non-scheduled revisions may occur as a result of unforeseeable events such as errors. They are not announced in advance by definition. The users are promptly informed on significant errors identified in published statistics. The revised results are released without any delay in an open and transparent manner. The reasons for carrying out the non-scheduled revisions are also published. Non-scheduled revisions are accompanied by relevant documentation, as well as by updated back data if available.
Benchmarking with other statistics is not carried out regularly.
The same revision policy for all kind of revisions is applied to data released nationally and to those transmitted to Eurostat, in order to assure coherence.
Vintage databases Vintage databases are not available. |
|||
| 17.2. Data revision - practice | |||
In accordance with the requirements of the Council Regulation (EC) No 2019/2152 on Business Statistics and Commission Implementing Regulation (EU) No 2020/1197, short-term indices are revised every five (5) years, particularly in calendar years ending in 0 or 5. In this framework, the indices are fully revised every five years, with the change of the base year and the implementation of new weighting scheme. The latest revision of the indices, with base year 2015=100.0, was completed in 2019 with the announcement of the indices for the 4th quarter 2018. Moreover, major revisions are accompanied at the time of the publication with updated back data.
As far as routine revisions are concerned, the common practice for the indices is that the unadjusted data released for the reference quarter are considered final and they are not subject to revisions. For some quarters, the indices may be subject to revisions (but not on a permanent basis), as there might be estimates for a small share of enterprises caused by delayed reporting. The calendar and seasonally adjusted data are characterised as provisional and are revised every quarter with the addition of the new observations in the time series. |
|||
|
||||||||||||||||||||||||||||||||||||||
| 18.1. Source data | ||||||||||||||||||||||||||||||||||||||
The Labour Input Indicators are compiled on the basis of a sample drawn from the Statistical Business Register of ELSTAT. More specifically, for every 2-digit division of economic activity,the enterpises were stratified into eight (8) size classes, according to their size, determined by their annual average employment (in 2015) in SBR as follows:
In each stratum that is derived by crossing the above stratification criteria (2-digit division of economic activity, size class) a sample of enterprises was selected by applying one-stage stratified sampling. Therefore, all the strata are covered. The enterprises belonging to the 6th, 7th, 8thsize classes are surveyed exhaustively. The sampling unit used is the enterprise. The sample size amounts to 3,624 enterprises out of the total population of enterprises belonging to sections B to E (Mining and Quarrying, Manufacturing, Electricity Supply and Water Supply), F (Construction), (div.45,46 of G, Trade), H to J and M to N (Other Services) of the statistical classification of economic activities NACE Rev. 2 , according to the Statistical Business Register of ELSTAT. The enterprises of the sample have employment of 5 persons and more. Concerning on the retail trade index (div.47), the survey to compile the indices covers 38,444 retail trade enterprises listed in the SBR having an annual turnover (in 2015) equal to or higher than 140,000 euro. Out of these enterprises a random sample of 575 enterprises was selected. The 9 size classes, based on the average annual number of employees of enterprises, during the year 2015, as follows:
The sample size of the enterprises was defined so that the relevant sampling error (coefficient of variation CV) of the variable “annual average employment” at the 2-digit level of economic activity does not exceed 2.0%. |
||||||||||||||||||||||||||||||||||||||
| 18.2. Frequency of data collection | ||||||||||||||||||||||||||||||||||||||
Data are collected on a quarterly basis. |
||||||||||||||||||||||||||||||||||||||
| 18.3. Data collection | ||||||||||||||||||||||||||||||||||||||
Data are collected through a specially designed questionnaire which is a joint questionnaire also used for Labour Cost Indices Survey and the Jobs Vacancy Survey. The questionnaires are delivered to external survey workers (statistical interviewers) who, once trained, visit the enterprises in order to fill in the questionnaire with the assistance of the enterprise’s staff or they hand the questionnaire to be filled in by the accountant of the enterprise. Afterwards, they collect the filledin questionnairesand they deliver them back to ELSTAT.In cases where the enterprise refuses to cooperate with the statistical interviewers, or refuses to respond, delays or in case there are particularities, an employee of ELSTAT pays avisit tothe enterprise and collects the necessary information himself. In some cases (due to lack of time) the questionnaire may be delivered and collected by e-mail. The same procedure is followed in the Regional Statistical Offices (RSO) of ELSTAT. The questionnaires are sent by post to the RSO and then the completed questionnaires are sent by the RSO to ELSTAT's headquarters by post. In some cases (due to lack of time) the questionnaire may be sent and returned by e-mail. Non-response is addressed through telephone contact with the enterprise, reminders sent by e-mail or personal visits to the enterprise. |
||||||||||||||||||||||||||||||||||||||
| 18.4. Data validation | ||||||||||||||||||||||||||||||||||||||
At national level, data processing involves checking the data derived from respondents with the aim of identifying (and eventually correcting) errors. Not all errors can be identified and the aim is to detect the errors that have a significant impact on the results. Rules to assist in identifying errors may flag possible errors that require further investigation in order to determine whether it is actually an error or just an unusual value. Data processing also involves checks for completeness, checks to confirm that values are within given ranges and that values for related variables are coherent. Data processing may take place during or after data entry. For every enterprise the data are cross-checked with the data of the previous quarter and of the corresponding quarter of the previous year. In addition, the indices are checked by employment stratum and by 2-digit division of economic activity.Inconsistencies or big deviations (outside of a pre-established range) indicate that further checks are required and may result in further processing. Eurostat also carries out validation checks on the national aggregated indices received, using validation rules implementing in the data feeding software. In case any inconsistencies are identified in the validation process, further clarifications may be needed by the Member States. Then Eurostat proceeds to the validation and publication of data. |
||||||||||||||||||||||||||||||||||||||
| 18.5. Data compilation | ||||||||||||||||||||||||||||||||||||||
The indices of Number of employees and self-employed persons, Hours worked by employees, Gross wages and salaries in main sections of the economy are calculated as chain indices. First, the moving based index is calculated by comparing the estimated value (Number of employees and self-employed persons, Hours worked by employees, Gross wages and salaries) for the current quarter q with the corresponding value of the previous quarter. Afterwards, the fixed-base index for the current quarter is calculated by multiplying the moving-based index by the fixed-base index of the previous quarter. More specifically:
1. Number of employees and self-employed persons, Hours worked by employees, Gross wages and salaries a. Symbolisms For each of the 2-digit division of economic activity stands for: h : size class of enterprises (h = 1,…,8), (while: h = 1,…,9, in the div.47 on retail trade)
that is:
b. Estimation of Number of employees and self-employed persons, Hours worked by employees, Gross wages and salaries For each of the 2-digit division of economic activity, the estimation
From the above relations, it yields:
The estimated value (number of persons employed, hours worked, wages and salaries) for an economic activity level higher than the 2-digit division of economic activity (i.e. sections etc) is calculated by adding the separate estimates of the 2-digit division composing the estimated level.
2. Indices of Number of employees and self-employed persons, Hours worked by employees, Gross wages and salaries a. Moving base index For each of the 2-digit division of economic activity, first the moving-base index is calculated by comparing the estimated value (Number of employees and self-employed persons, Hours worked by employees, Gross wages and salaries) for the current quarter q with the corresponding value of the previous quarter as follows:
where:
b. Fixed-base index For each of the 2-digit division of economic activity, the fixed-base index for the current quarter is obtained by multiplying the moving-base index by the fixed-base index of the previous quarter, as follows:
For the calculation of the first fixed-base indices of the base year 2015, the following equation applies:
where:
that is:
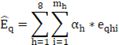
The fixed-base index for an economic level higher than the 2-digit division of economic activity (i.e. sections, aggregates, MIGs etc) is calculated as follows:
where:
k : the two-digit level (division of econpmic activity) that belongs to the section or aggregate or MIG,
y : the annual number of persons employed or number of hours worked or wages and salaries of all the two-digit levels which compose the section or aggregate or MIG, according to the results of the 2015 Structural Business Survey (SBS).
The backcasted quarterly and annual indices at each level k for the period Q1 2000 – Q3 2018 were calculated on the basis of the average annual indices in 2015, according to the formula:
where:
|
||||||||||||||||||||||||||||||||||||||
| 18.6. Adjustment | ||||||||||||||||||||||||||||||||||||||
The indices of the number of employees and self-employed persons are released in unadjusted form, whereas, the indices of hours worked by employees and gross wages and salaries are released in unadjusted, calendar adjusted and seasonally adjusted form. The method used is the TRAMO-SEATS method with the use of JDemetra+ 2.0.0. Calendar and seasonally adjustment series are estimated for all series except for those that no significant effect is found. For the calendar and seasonal adjustment of the series, the direct approach is applied, namely each time-series is adjusted independently. Outliers (additive outliers, temporary changes, level shift) are automatically and manually fixed, according to the critical values for the outlier detection. The majority of the series of the data set follows a log-additive decomposition model. Benchmarking techniques are not applied. The whole series with seasonally adjusted indices is recalculated every time a new observation is added in the time-series. Adjustment models are completely reviewed once a year. Calendar and seasonally adjusted data are available for industry and construction from Q1 2000 onwards and for trade and services from Q1 2010 onwards. |
||||||||||||||||||||||||||||||||||||||
 : number of enterprises in the size class h (population size)
 : number of enterprises of sample in the size class h (sample size)
 : number of enterprises of sample that responded in the size class h (respondents)
 : response rate in the size class h, that is:
 : extrapolation factor of the respondents in the size class h, that is:
 : persons employed or hours worked or wages and salaries of the current quarter q, of the enterprise of order i, in the size class h
 : persons employed or hours worked or wages and salaries of the current quarter q, of all enterprises that belong to the size class h, that is:
 : persons employed or hours worked or wages and salaries of the current quarter q, of all enterprises that belong to the category of aggregated economic activity classes,
 of the value (persons employed, hours worked, wages and salaries)
  of the current quarter q is calculated by applying the following relations:
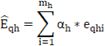


 : moving-base index for the current quarter q, in relation to the previous quarter q-1
 ,
,  : estimated values (persons employed, hours worked, wages and salaries) for the current and the previous quarter
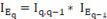
 : fixed-base index for the current quarter q
 : fixed-base index for the previous quarter q-1
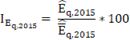
 : fixed-base index for the quarter q of the year 2015
 : estimated value (persons employed, hours worked, wages and salaries) for quarter q of year 2015
 : mean annually estimated value (persons employed, hours worked, wages and salaries) for the year 2015,
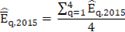


 : the annual number of persons employed or number of hours worked or wages and salaries of the enterprises of the two-digit level k for the base year, according to the results of the 2015 Structural Business Survey (SBS),
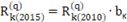

 : the index of the level k during the current period (quarter, year) q with base year 2015,
 : the index of the level k during the current period (quarter, year) q with base year 2010 and
 : the average annual index of the level k in the year 2015 with the base year 2010.
|
|||
None |
|||
|
|||
|
|||