Reference metadata describe statistical concepts and methodologies used for the collection and generation of data. They provide information on data quality and, since they are strongly content-oriented, assist users in interpreting the data. Reference metadata, unlike structural metadata, can be decoupled from the data.
Annex I-IV: Institut National de la Statistique et des Etudes Economiques - STATEC
1.2. Contact organisation unit
Annex I-IV: Unit ENT3 Structural Business Statistics
1.3. Contact name
Confidential because of GDPR
1.4. Contact person function
Confidential because of GDPR
1.5. Contact mail address
13, rue Erasme
L-1468 Luxembourg
1.6. Contact email address
Confidential because of GDPR
1.7. Contact phone number
Confidential because of GDPR
1.8. Contact fax number
Confidential because of GDPR
2.1. Metadata last certified
28 March 2023
2.2. Metadata last posted
28 March 2023
2.3. Metadata last update
28 March 2023
3.1. Data description
Structural business statistics (SBS) describes the structure, conduct and performance of economic activities, down to the most detailed activity level (several hundred economic sectors).
SBS covers all activities of the non-financial business economy with the exception of agricultural activities and personal services. Limited information is available on banking, insurance and pension funds.
Main characteristics (variables) of the SBS data category:
Business demographic variables (e.g. Number of enterprises)
"Output related" variables (e.g. Turnover, Value added)
"Input related" variables: labour input (e.g. Employment, Hours worked); goods and services input (e.g. Total of purchases); capital input (e.g. Material investments)
3.2. Classification system
Statistical Classification of Economic Activities in the European Community (NACE): NACE Rev.1 was used until 2001, NACE Rev. 1.1 since 2002, and NACE Rev 2 is used from 2008 onwards. Key data were double reported in NACE Rev.1.1 and NACE Rev.2 for 2008. From 2009 onwards, only NACE Rev.2 data are available.
The regional breakdown of the EU Member States is based on the Nomenclature of Territorial Units for Statistics (NUTS). Detailed information about the consecutive NUTS Regulations can be found at Eurostat's website
The SBS coverage was limited to Sections C to K of NACE Rev.1.1 until 2007. Starting from the reference year 2008 data is available for Sections B to N and Division S95 of NACE Rev.2. With 2013 as the first reference year information is published on NACE codes K6411, K6419 and K65 and its breakdown.
survey unit = legal unit, local unit and, for a few select cases, subdivisions of a legal unit;
reporting unit / statistical unit = KAU, enterprise, local unit;
3.6. Statistical population
Only active market units are included.
Active units encompass the following units:
* units with a non-zero value of turnover or non-zero employees;
* units which are active according to the SBS survey and not properly recorded in the administrative sources (e.g. VAT exempt units without employment);
The market status of a unit is defined in terms of the national accounts institutional sectors. Sectors 12.7, 13 and 15 are excluded from the target population.
The following units are specifically excluded:
* temporary partnerships;
* private persons producing energy using photovoltaic installation;
* artificial subsidiaries and other special purpose entities dealing almost exclusively with group affiliates.
There are no exclusions in terms of NACE. However, branch H.50 (water transport) is only available as a branch estimate and not as micro-data. Consequently, the size class dimension is not available.
3.7. Reference area
The reference area is the Luxembourgish economic territory as defined by the national accounts ESA 2010 definition.
Consequently, resident branches of foreign enterprises are included in the target population if the said units are subject to fiscal and other legal obligations of the national economy beyond a simple registration for VAT purposes.
Symetrically, foreign branches of resident enterprises are excluded from the target population. Immobile fixed tangible assets (e.g. buildings) located in foreign economic territories but legally owned by resident enterprises are also considered foreign branches and thus excluded from the target population. The exclusions can only be performed on a case by case basis because the information is not easily available.
3.8. Coverage - Time
Restricted from publication
3.9. Base period
Not applicable.
Number of enterprises and number of local units are expressed in units.
Monetary data are expressed in millions of €.
Employment variables are expressed in units.
Per head values are expressed in thousands of € per head.
Ratios are expressed in percentages.
2020
The reference year corresponds with the calendar year.
For each company with a different financial year than the calendar year, we take a decision regarding the SBS reference period. Normally, this decision is taken in such a way that at least 6 months of the financial year for a given company are included in the corresponding SBS reference period. Once that decision is taken, it is maintained every subsequent year for comparability reasons.
6.1. Institutional Mandate - legal acts and other agreements
The team involved in the SDC procedures has been trained either internally or via the training courses offered in the European Statistical System.
Technical considerations
The basis for any suppression pattern (addressing both primary and secondary confidentiality) is the software package tau-Argus. However, the process also involves manual procedures, i.e. checking the tau-Argus output, comparing the historical data series and addressing linked table disclosure risks (see secondary confidentiality for further details).
The statistical disclosure control procedures are not performed for every variable individually but only for a single shadow variable, i.e. "Turnover", more precisely the SBS variable 12 11 0 but including royalties. If a given cell is confidential for that variable (no matter if primary or secondary), the same cell will be suppressed for all the other available variables (e.g. number of persons employed, investments, personnel costs, etc.).
This approach has lead us to check the confidentiality for the following reference series:
• preliminary enterprise data broken down by economic activity;
• final enterprise data broken down by economic activity;
• enterprise data broken down by economic activity and by employment size class;
• enterprise data broken down by special aggregates;
• kind-of-activity (KAU) data broken down by economic activity;
• (if available) local unit data broken down by economic activity;
• enterprise data broken down by economic activity and by CPA product or by the client’s country of residence (annex VIII).
This strongly contributes to minimising both SBS transmission delays and otherwise unsolvable linked table or variable-specific disclosure risks.
Primary confidentiality rules
As a general principle, the NACE section level data, if not broken down by any other spanning variable (e.g. size class), are not considered as confidential, except if the section has a trivial breakdown (e.g. section L of NACE Rev.2). There can be other case-by-case exceptions to this principle.
a) Sensitivity rule
We apply the (n,k)-dominance rule, i.e. a cell is suppressed if n units separately or jointly dominate the total value of a cell by at least k%. The (n, k) parameters for Luxembourg are confidential.
b) Minimum frequency rule
For any cells that are left after applying the sensitivity rule, a minimum frequency is applied. A cell is suppressed if there are less than n units in a given cell. The n parameter for Luxembourg is confidential.
Secondary confidentiality rules
The secondary suppression is calculated by tau-Argus using the ‘Modular’ algorithm. Manual suppressions or cost adjustments are performed to adjust the secondary confidentiality pattern calculated by the software.
a) Secondary suppression within a table
• A cell is suppressed for secondary confidentiality if n units jointly or separately dominate the confidential subtotal by at least k%;
• special attention is paid to the impact of singletons, a risk which is in most cases directly addressed by the tau-Argus Modular algorithm;
• tau-Argus is set to minimise the cost when determining the secondary suppressed cells.
However, we also want to provide the user with relevant data, whether it is in terms of interpretation and/or availability of time series. Consequently, the cost minimisation can be overridden for economic and/or historical reasons.
b) Secondary suppression due to linked tables disclosure risks
• historical disclosure: in conformity with the SDC handbook, we ensure that no historical cell is compromised by disclosing the same cell for the current reference year. As long as there is any significant link with prior year data, a cell may not be disclosed for the current reference year.
• links to any other series based on different unit concepts but sharing the same breakdown: data are first checked on an enterprise level. Then the data for other concepts (KAU, local units) are checked - the cells for which there is any significant link with the enterprise data series inherit the flags from the latter. A link is defined to exist between two tables if the values for the same cell in both tables are within p% range (please note that p% here only refers to the relationship between dominance and p% thresholds and not to the p% sensitivity rule). Sometimes, a flag of a KAU or local unit series has an impact on the enterprise series. Therefore, we cannot transmit the enterprise data series before the other series.
8.1. Release calendar
Restricted from publication
8.2. Release calendar access
Not applicable.
8.3. Release policy - user access
All information accessible to the users are available in the published publications and in the published on-line databases.
Annual
10.1. Dissemination format - News release
Currently, no regular news release for SBS.
10.2. Dissemination format - Publications
SBS publications are typically available in FR and some in EN language.
Any national micro-data access is governed by article 16 of the Law of 10 July 2011 on the organisation of the National Institute for Statistics and Economic Studies.
10.5. Dissemination format - other
Data are transmitted annually to Eurostat either to be used in European aggregates and for country comparisons.
10.6. Documentation on methodology
Methodological guidelines are generally in FR (ad-hoc publications or data publications), while definitions are embedded whenever available in the relevant tables (FR and EN)
External users: public and private research institutions, marketing companies, national central bank, lobby and policy groups, private users, university students, academic users and others.
External users are often interested in the variables “number of [units]”, “turnover”, “value-added” and “employment” by economic activity as well as by employment size class. Sometimes, concentrations ratios (e.g. market share of top 5 companies, etc.) are requested but due to disclosure issues, these are not provided.
Internal users: national annual accounts, CIS-R&D statistics, ICT statistics, short-term statistics, foreign direct investment, internal research department, satellite accounts (culture, tourism).
Internal users often need micro level data. SBS micro level data are mainly used as a direct data source for the production of other statistics (e.g. national annual accounts including the financial account, ICT, CIS-R&D) or to calculate index weights (e.g. short-term statistics). Other uses are quality checks, use of the data for sampling purposes, etc.
Internal users and annex VIII The geographical dimension in the national SBS survey is also a major national source for national accounts, not only for services companies but for production of services in general. The same source is used to compile the annex VIII series.
Some data published nationally are different from European data
As of the revision from 2005 onwards in NACE Rev.2, the data are finally fully aligned with Eurostat with the following limits.
The definition of turnover is not the same. For national purposes, the variety which includes royalties has been published for consistency reasons. For activity N77, the non-inclusion of royalties makes it impossible to match turnover with total purchases, even though they are included in the production value and in the value-added.
However, not all variables are subject to national publication (e.g. subcontracting, investment by type of tangible asset, leasing, etc.). On the other hand, some variables are nationally published for all activities, whereas on the Eurostat website they are not (e.g. number of hours worked, changes in inventory, etc.).
12.2. Relevance - User Satisfaction
Not available.
12.3. Completeness
Restricted from publication
13.1. Accuracy - overall
Restricted from publication
13.2. Sampling error
Impact of sampling error
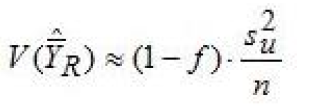
Sampling error has become less relevant as of reference year 2015 because of the integration of a new massive administrative data source. In 2017, the overall sampling error can be deemed negligible to small. Locally, there may be higher sampling errors.
Estimator description
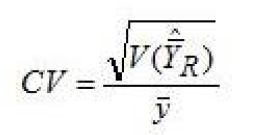
The ratio estimator is used for grossing up. Please refer to section 18.5 for further details on grossing up procedures. The formula of the CV for the ratio estimator has been programmed in Stata implementing the analytic formulas described in the book “Techniques de sondage” by Pascal Ardilly (ISBN 10: 2-7108- 0847-1).
Given the ratio R, the sampling variance has been estimated using the residuals (u) between the variable of interest (y) and the ancillary variable (x) :
with and ui = yi - R * xi
The CV has been calculated using the following formula:
Use of ancillary data
Given that the sample design includes a rotation principle for small units, data imputed using the procedures described in section 13.3 have also been taken into account for the calculation of the CVs. The CVs have been calculated for a given variable of interest with the corresponding ancillary variable.
The following variables of interest have been grossed up using the ancillary variable “turnover”: 12 11 0 and 12 15 0.
The following variables of interest have been grossed up using the ancillary variable “number of persons employed”: 15 11 0 and 16 11 0.
Variable 13 31 0 has been grossed up using the ancillary variable “personnel costs”, available through administrative sources.
For the variable 11 11 0, the CV is zero, as it is available for every unit in the business register and thus does not need to be estimated.
For the variable 16 13 0, the CVs should be close to zero because for the non-surveyed units the administrative data source is used for hotdeck ratio imputation.
Limits of the CV calculation
The CV has been calculated for every single cell, i.e. by activity as well as by activity broken down by employment size class. Please note that the CV is missing for the following cells:
• cells with no unit or only one unit in the target population ;
• cells with no unit or only one unit in the sample.
Finally, it should be noted that the CV for variables that can take negative values (e.g. variable 12 15 0) is not necessarily the most appropriate indicator to assess the sampling error.
13.3. Non-sampling error
1. Non-sampling error
Measurement errors can be frequent but are most often of minor importance. Most measurement errors are in relation with NACE reclassifications and can lead to local breaks in series.
In recent years, some globalisation phenomena observed through multinational enterprises have become the source of some very significant interpretation difficulties and therefore potential error. This is mainly due to a growing importance of flows generated by multinationals as well as vague or absent methodology regarding the proper statistical treatment of these phenomena. As a consequence, Luxembourg has set up a large cases unit, which is operational since 2018, to centralise information regarding multinationals with the objective to seek consistency across statistical domains regarding their treatment.
In case that such errors are observed ex post to SBS publication, impacted cells are subject to relevant quality flags (if available and meaningful, e.g. break in series, contributes to EU total only, etc.) until the revision of the impacted reference year(s).
2. Measures to minimize non-response
Non response concerns units for which either of the following characteristics applies:
units which have not responded. Every two months a written reminder is addressed to the units who have not responded. The third reminder is done by registered mail;
the survey form data are not exploitable due to either inconsistent data or lack of information - the questionnaire design is reviewed every year to ensure that item non response due to form design is minimal and does not transform into unit non response;
units which have ceased their activity or which have been subject to restructuring (mergers, splits, etc.) during the reference year – for these units, data cannot be easily collected but have to be estimated or imputed in most cases;
units which cannot be contacted. The addresses for these units are checked manually using the phone book and the national Register of Natural and Legal Persons. Unit non response for this reason is usually low.
In rare situations, we enforce statistical obligation on a case-by-case basis by filing a legal complaint against big units which have repeatedly failed to respond with usable data or at all.
3. Imputation methods for dealing with non-response
As of reference year 2015, data from the Central Balance Sheet Office are used to impute units which are not part of the sample or which no recent survey data are available. The impact of the data integration is an improvement of the sampling error, potentially traded for an increased measurement error.
Alternatively, non-responding units are imputed using the cold-deck ratio imputation. This method consists in applying an individual growth ratio expressed in terms of an adminstrative data indicator (turnover, number of employees, personnel costs) to the latest available survey data for the last 10 years.
In some cases, mainly for bigger companies, the ratio is manually adjusted using annual business accounts available for the reference period. This provides an even more precise estimate. If the ratio is abnormally high (compared to other similar units in the stratum) or if there is a weak correlation between the administrative variable and the survey variable, this type of imputation is not performed. If no historical data are available or if those data are deemed outdated, the units are grossed up using the same procedures as for units not covered by the sample or by imputed data.
Investment variables This form of imputation is not used for the family of variables related to 15 11 0. However, an administrative source is used to impute this variable.
Employment variables Imputation procedures for employment variables are similar to the general approach. However, for variables 16 14 0 and 16 15 0, purely administrative source data as well as variable 16 13 0 are used.
4. Weighted non-response rate
The weighted unit non-response rate was weighted using the variable 12 11 0. The non-response rate is equal to 0 for the variables 11 11 0 and 16 13 0, as they are available in the administrative sources.
Overall, the weighted unit non-response rate is very low, the rate in 2019 being 1% (2018: 1%) for the non-financial business economy.
However, for some economic activities, the rate is high. The non-response rate can even be equal to “NA”, i.e. if there was no unit in the sample for a given cell, even though there are units for that cell in the total population. It is important to know that :
• it is often not possible to use the same strata for estimation as those foreseen in the data transmission format. Given the fact that estimated values are imputed on a micro data level (imputation is done based on the relative importance of turnover for each unit), it is nonetheless possible to disclose the results according to the data transmission format ; • for the NACE groups H 50.1 to H 50.4, we do not use any micro data figures, please refer to section 12.3 for further details.
5. Bias from non-response and from the estimation method
Bias resulting from non-response
For the units for which administrative accounting data is available, the bias due to non-response is practically equal to zero.
For the units to which the cold-deck ratio imputation method has been applied, the bias is significantly reduced when that ratio is adjusted with observations from the annual business accounts (if available).
For most units, such an adjustment is not performed due to limited resources and the limited availability of detailed annual business accounts for small businesses in particular. Nonetheless, the use of adjusted past survey data certainly reduces the bias resulting from non-response. If no historical survey data are available for a given unit, the latter is handled in the same way as any unit which is not included in the sample. The bias would then result from the estimation method. In most cases, this concerns only small businesses, which have a minor impact on the aggregate value of the variables of interest. Given the above, the bias can be evaluated as being small.
Bias resulting from the estimation method
According to the book reference mentioned in section 13.2, the ratio estimator is biased, the formula of the bias being complex but with an order of magnitude of 1/n. Consequently, the higher n (sample size), the smaller the bias. However, if n is small or if there is a weak linear correlation, the bias of the ratio estimator could be significant.
While the bias resulting from the estimation method remains unknown, the estimation method mainly concerns small units. Given the new administative accounting data source and the fact that mainly small units are concerned by estimation, we believe that it has a limited effect in the overall accuracy of the estimate.
6. Coverage error
Impact of coverage errors on the key statistics: medium
7. Out-of-scope units
Definition
The most frequently observed type of out-of scope units are legal units which are incorporated or registered in Luxembourg but which at the same time do not have any non financial economic activity (SBS scope for annexes I-IV, VIII) in the Luxembourg economic territory (e.g. real-estate rental activities with buildings in foreign territories only, companies where the activity is done in foreign branches only, some activities related to shipping, group-only special purpose entities, etc.). The other significant type of out-of-scope units relates to non-market activities.
Identification
Such units are identified and dealt with on a case-by-case basis by the staff involved in national accounts, SBS, business register and balance of payments. This kind of information is also increasingly centralised through the business register.
Estimated number of undetected units
There is a list of companies which have been excluded from the SBS population for the above reasons. However, we have no estimate of the number of undetected out-of-scope units still lingering in the SBS population.
14.1. Timeliness
Restricted from publication
14.2. Punctuality
Restricted from publication
15.1. Comparability - geographical
Not applicable.
15.2. Comparability - over time
Length of comparable time series
1995 - 2002 (KAU concept)
2003 - 2009 (enterprise concept NACE Rev.1.1)
2005 - 2020 (enterprise concept NACE Rev.2)
Important events in the time series
A revision of SBS data series was completed in summer 2014 for the reference years 2005 to 2010 included. The revision was performed using NACE Rev.2 and included the revision of the profiling of some major players. The impact of the revision was significant for a few activities.
As of 2015, data from the Central Balance Sheet Office are used to impute units which are not part of the sample or which no recent survey data are available. The impact of the data integration is an overall improvement of the sampling error, potentially traded for an increased measurement error on the local level.
As of 2019 reference year, a rolling revision policy has been introduced. After the official production of reference year T (e.g. 2019) published during the year T+2 (e.g. 2021), a revision for the reference year T data is performed during T+3 (e.g. 2022). The impact of this revision not only removes local breaks in series due to temporary errors in NACE but also introduces a less desirable side-effect: due to the consideration of late VAT data during the revision, there is a potentially significant upward impact on the number of active enterprises (mainly very small entities) and the number of persons employed (excluding employees).
15.3. Coherence - cross domain
Business demography
Timing differences are generally small.
Since 2007, business demography more accurately reflects the number of enterprises than SBS for legal activities (NACE code 69.1) because the administrative sources are insufficiently detailed for SBS purposes and thus to maintain internal consistency between all the variables. As long as the sources won't improve, this inconsistency is there to stay. Regarding the differences observed in trade activities, SBS took a different historical path than business demography: the latter assumed that some very small units should be dismissed as inactive, whereas in SBS the said units would be kept in the target population.
Prodcom
Not available in Luxembourg.
National accounts
Consistency has been officially documented for the variables 12 12 0, 12 15 0 and 16 11 0. Generally, differences arise from different approaches to comply with the methodologies. While SBS is generally based on a bottom-up approach, consisting in aggregating business accounts figures, national accounts integrate other data sources (e.g. taxes, other sectors, illegal activities, etc.) - such integration requires the use of balancing procedures, which results in differences with SBS. Timing differences are also possible but generally of low impact.
Furthermore, it appears that "Number of hours worked by employees" is generally lower in national accounts figures than for SBS or LCS.
Short-term statistics
No efforts have been invested so far in analysing the potential or actual data inconsistencies between SBS and STS. However, the latter uses SBS data (enterprise concept) for weighting purposes. Comparing consistency can only be done for services and trade because the observational unit is only the same for those two types of activities - for the others data at KAU level would have to be compared.
Labour Cost Survey (LCS) for wages and salaries per employee
If we consider only the population of enterprises employing at least 10 persons and only those economic activities which are covered by both statistics at the same time, the figures are similar.
15.4. Coherence - internal
Internal inconsistencies stem most often from rounding errors.
Restricted from publication
17.1. Data revision - policy
Restricted from publication
17.2. Data revision - practice
Restricted from publication
18.1. Source data
Statistical survey combined with administrative sources
At the heart of the data collection is the annual structural business survey. The annual sample of the said survey is based on a stratified random sampling design. Using number of employees and turnover thresholds, the target population is divided into two parts:
* any legal units employing either more than 45 employees or having declared a turnover excluding VAT of more than 7 million EUR per annum are selected every year. Any legal units linked to the aforementioned units (e.g. group and enterprise links) are also selected every year;
* the other legal units are selected using a stratified random probability sampling design. Units in strata consisting of only one unit are always selected. Furthermore, we apply a rotation principle to ensure that a unit can only be surveyed at maximum once every three years – this procedure helps to reduce the administrative burden for the smaller entities. The following years, these units can be satisfactorily imputed using cold-deck ratio imputation or, as of 2015, be imputed using detailed accounting data.
To cover the needs of national accounts and SBS, the sample size is between 3000 and 3600 reporting units.
The stratification used in the sample design does not take into account the size classes defined in the SBS regulation. However, mass imputation procedures exist on a micro data level, so that data can be broken down according to any spanning variable defined a posteriori:
* as of 2015, detailed accounting data from the Central Balance Sheet Office are used to impute units which are not part of the sample or which no recent survey data are available - this source covers balance sheet and profit & loss data. In 2019, the data source accounts for more than half of the SBS population;
* as of 2005, social security data to impute number of employees, personnel costs and number of hours worked by employees;
* detailed VAT data to impute investment variables;
* VAT and social security key indicators to impute non-respondent units using the cold-deck ratio imputation method.
Data sources used for the population frame or target population
The statistical business register is the prime source for building the target population. The said register is enriched by key data from social security and VAT. These data are used to determine the activity status of any enterprise. Only active units are retained. There is no threshold on employment and turnover, except that either has to be positive for the reference year in question.
In addition, for units having no employment and not covered by VAT, the survey helps to identify a few active units. They are added to the population frame.
NACE classification
The difference between principal and secondary activities is directly available in the business register. The approach to identify principal activities is the top-down approach. Stability rules are in place to avoid yearly shifting between principal and secondary activities.
The update frequency of the business register is daily. However, for SBS purposes the extract of the business register is frozen at a given date. From that point on, changes in NACE are only performed through a dedicated working area.
Relation between the reporting unit and the enterprise
In the SBS survey, the reporting unit is the legal unit. However, for a very few legal units, the data are collected separately for the economic subdivisions of the legal unit. Moreover, local unit data are collected at legal unit level. In the administrative sources, the reporting unit is the legal unit.
Finally, the statistical unit "enterprise" can be a legal unit or a group of legal units. Enterprises which are formed by a group of legal units are not the general case in Luxembourg but their occurrence is significant, in particular due to many legal units specialized in ancillary activities for other legal units belonging to the same enterprise group.
18.2. Frequency of data collection
Annual data collection
18.3. Data collection
Restricted from publication
18.4. Data validation
Survey data are subject to an indepth validation programme. Administrative source data are checked for plausibility for every unit in the sample and on a case-by-case basis with annual business accounts (if available at the Register of Commerce). For the units not covered by the survey, outlier tests are performed to avoid any negative impacts on the ratio estimation.
Type of controls
The test environment underlies an objective-driven risk management strategy. This ensures that the survey data comply with the pre-defined quality standard. The following documentation (in French) describes an old version of framework used to cover non sampling errors for the survey reference year 2005, i.e. in the context of the old regulatory framework.
There is no updated version of the report, for it is was published as a working paper and thus is not an official methodological document by STATEC. However, it provides an idea of the type of control environment that we have in place in the area of SBS survey data. PDF Economie et statistiques 29/2009 - Statistiques - Luxembourg (public.lu)
The test environment covers both micro-data and tabular data and consists in control activities which cover
Error checking activities in the administrative sources consist in the following:
* analysis of the correlation between survey and administrative variables; * analysis of births and deaths of significant units; * detection of out-of-scope units; * comparability in time and NACE classification of enterprise units (enterprise concept); * outlier detection; * identification of merger and acquisitions to minimise the risk of double counting; * automatic validation procedures for the standard chart of accounts data (as of 2015).
18.5. Data compilation
Unit non-response imputation
Please refer to chapter 13.
Item non-response imputation
Given that SBS data are above all quantitative and that they also serve the needs of national accounts, it is very difficult to identify item non-response. This is in particular true for units who are included only once in the sample in a given time series.
For the bigger companies, we are able to follow their structure over a larger period and thus to identify item non-response in an easier way. Item non-response is therefore dealt with on a case-by-case basis during editing procedures.
Missing or erroneous information in the administrative source
For some economic activities, VAT data are not available. No imputation is done on administrative data. If employment data are significant for a given unit, it is very likely included in the survey data. Consequently, the occurrence of missing data in the VAT and social security administrative source is rare and of low impact. In the rare case of missing or the more frequent case of erroneous administrative data, adjustments are performed in a dedicated working area.
For the standard chart of accounts data source (available as of 2015), any missing data is imputed using the either cold-deck ratio imputation or hot-deck ratio imputation (grossing up).
Grossing up
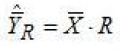
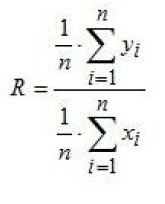
When grossing up survey data, we always take into account ancillary data available in the administrative sources, i.e. the ancillary variables “turnover” and “number of employees”, and not only the sample design. The aforementioned ancillary variables most often have a linear correlation with the variables of interest in SBS. Consequently, the ratio estimator is used for grossing up. With the variable of interest being available only for the sample (y) and with the ancillary variable being available both for the sample (x) and the SBS target population (X), the ratio estimator of the variable of interest , expressed as an average, can be written:
The ratio R has been formulated in the following way:
If for a given stratum no unit is available in the sample, i.e. neither for the historical periods nor for the reference period, the units in this stratum are grouped together with another stratum for which sample data are available and are then grossed up.
Variables 11 11 0, 13 31 0, 13 32 0, 13 33 0, 16 13 0 and 16 15 0 are available directly in the administrative source and therefore do not need to be grossed up (as from reference year 2009). If prior year survey data are available, a cold-deck ratio imputation is performed – this significantly reduces the bias in case there are permanent differences between the admin source and the survey data for a given unit. For the other units, administrative data are simply pasted into the data set.
Please also refer to chapter 13.
18.6. Adjustment
If the reference period of a company differs from the calendar year, there is no correction to bring it in accordance with the statistical reference period.
For each company with a different financial year than the calendar year, we take a decision regarding the SBS reference period. Normally, this decision is taken in such a way that at least 6 full months of the financial year for a given company are included in the corresponding SBS reference period. Once that decision is taken, it is maintained every subsequent year for comparability reasons.
Not applicable.
Structural business statistics (SBS) describes the structure, conduct and performance of economic activities, down to the most detailed activity level (several hundred economic sectors).
SBS covers all activities of the non-financial business economy with the exception of agricultural activities and personal services. Limited information is available on banking, insurance and pension funds.
Main characteristics (variables) of the SBS data category:
Business demographic variables (e.g. Number of enterprises)
"Output related" variables (e.g. Turnover, Value added)
"Input related" variables: labour input (e.g. Employment, Hours worked); goods and services input (e.g. Total of purchases); capital input (e.g. Material investments)
survey unit = legal unit, local unit and, for a few select cases, subdivisions of a legal unit;
reporting unit / statistical unit = KAU, enterprise, local unit;
Only active market units are included.
Active units encompass the following units:
* units with a non-zero value of turnover or non-zero employees;
* units which are active according to the SBS survey and not properly recorded in the administrative sources (e.g. VAT exempt units without employment);
The market status of a unit is defined in terms of the national accounts institutional sectors. Sectors 12.7, 13 and 15 are excluded from the target population.
The following units are specifically excluded:
* temporary partnerships;
* private persons producing energy using photovoltaic installation;
* artificial subsidiaries and other special purpose entities dealing almost exclusively with group affiliates.
There are no exclusions in terms of NACE. However, branch H.50 (water transport) is only available as a branch estimate and not as micro-data. Consequently, the size class dimension is not available.
The reference area is the Luxembourgish economic territory as defined by the national accounts ESA 2010 definition.
Consequently, resident branches of foreign enterprises are included in the target population if the said units are subject to fiscal and other legal obligations of the national economy beyond a simple registration for VAT purposes.
Symetrically, foreign branches of resident enterprises are excluded from the target population. Immobile fixed tangible assets (e.g. buildings) located in foreign economic territories but legally owned by resident enterprises are also considered foreign branches and thus excluded from the target population. The exclusions can only be performed on a case by case basis because the information is not easily available.
2020
The reference year corresponds with the calendar year.
For each company with a different financial year than the calendar year, we take a decision regarding the SBS reference period. Normally, this decision is taken in such a way that at least 6 months of the financial year for a given company are included in the corresponding SBS reference period. Once that decision is taken, it is maintained every subsequent year for comparability reasons.
Restricted from publication
Number of enterprises and number of local units are expressed in units.
Monetary data are expressed in millions of €.
Employment variables are expressed in units.
Per head values are expressed in thousands of € per head.
Ratios are expressed in percentages.
Unit non-response imputation
Please refer to chapter 13.
Item non-response imputation
Given that SBS data are above all quantitative and that they also serve the needs of national accounts, it is very difficult to identify item non-response. This is in particular true for units who are included only once in the sample in a given time series.
For the bigger companies, we are able to follow their structure over a larger period and thus to identify item non-response in an easier way. Item non-response is therefore dealt with on a case-by-case basis during editing procedures.
Missing or erroneous information in the administrative source
For some economic activities, VAT data are not available. No imputation is done on administrative data. If employment data are significant for a given unit, it is very likely included in the survey data. Consequently, the occurrence of missing data in the VAT and social security administrative source is rare and of low impact. In the rare case of missing or the more frequent case of erroneous administrative data, adjustments are performed in a dedicated working area.
For the standard chart of accounts data source (available as of 2015), any missing data is imputed using the either cold-deck ratio imputation or hot-deck ratio imputation (grossing up).
Grossing up
When grossing up survey data, we always take into account ancillary data available in the administrative sources, i.e. the ancillary variables “turnover” and “number of employees”, and not only the sample design. The aforementioned ancillary variables most often have a linear correlation with the variables of interest in SBS. Consequently, the ratio estimator is used for grossing up. With the variable of interest being available only for the sample (y) and with the ancillary variable being available both for the sample (x) and the SBS target population (X), the ratio estimator of the variable of interest , expressed as an average, can be written:
The ratio R has been formulated in the following way:
If for a given stratum no unit is available in the sample, i.e. neither for the historical periods nor for the reference period, the units in this stratum are grouped together with another stratum for which sample data are available and are then grossed up.
Variables 11 11 0, 13 31 0, 13 32 0, 13 33 0, 16 13 0 and 16 15 0 are available directly in the administrative source and therefore do not need to be grossed up (as from reference year 2009). If prior year survey data are available, a cold-deck ratio imputation is performed – this significantly reduces the bias in case there are permanent differences between the admin source and the survey data for a given unit. For the other units, administrative data are simply pasted into the data set.
Please also refer to chapter 13.
Statistical survey combined with administrative sources
At the heart of the data collection is the annual structural business survey. The annual sample of the said survey is based on a stratified random sampling design. Using number of employees and turnover thresholds, the target population is divided into two parts:
* any legal units employing either more than 45 employees or having declared a turnover excluding VAT of more than 7 million EUR per annum are selected every year. Any legal units linked to the aforementioned units (e.g. group and enterprise links) are also selected every year;
* the other legal units are selected using a stratified random probability sampling design. Units in strata consisting of only one unit are always selected. Furthermore, we apply a rotation principle to ensure that a unit can only be surveyed at maximum once every three years – this procedure helps to reduce the administrative burden for the smaller entities. The following years, these units can be satisfactorily imputed using cold-deck ratio imputation or, as of 2015, be imputed using detailed accounting data.
To cover the needs of national accounts and SBS, the sample size is between 3000 and 3600 reporting units.
The stratification used in the sample design does not take into account the size classes defined in the SBS regulation. However, mass imputation procedures exist on a micro data level, so that data can be broken down according to any spanning variable defined a posteriori:
* as of 2015, detailed accounting data from the Central Balance Sheet Office are used to impute units which are not part of the sample or which no recent survey data are available - this source covers balance sheet and profit & loss data. In 2019, the data source accounts for more than half of the SBS population;
* as of 2005, social security data to impute number of employees, personnel costs and number of hours worked by employees;
* detailed VAT data to impute investment variables;
* VAT and social security key indicators to impute non-respondent units using the cold-deck ratio imputation method.
Data sources used for the population frame or target population
The statistical business register is the prime source for building the target population. The said register is enriched by key data from social security and VAT. These data are used to determine the activity status of any enterprise. Only active units are retained. There is no threshold on employment and turnover, except that either has to be positive for the reference year in question.
In addition, for units having no employment and not covered by VAT, the survey helps to identify a few active units. They are added to the population frame.
NACE classification
The difference between principal and secondary activities is directly available in the business register. The approach to identify principal activities is the top-down approach. Stability rules are in place to avoid yearly shifting between principal and secondary activities.
The update frequency of the business register is daily. However, for SBS purposes the extract of the business register is frozen at a given date. From that point on, changes in NACE are only performed through a dedicated working area.
Relation between the reporting unit and the enterprise
In the SBS survey, the reporting unit is the legal unit. However, for a very few legal units, the data are collected separately for the economic subdivisions of the legal unit. Moreover, local unit data are collected at legal unit level. In the administrative sources, the reporting unit is the legal unit.
Finally, the statistical unit "enterprise" can be a legal unit or a group of legal units. Enterprises which are formed by a group of legal units are not the general case in Luxembourg but their occurrence is significant, in particular due to many legal units specialized in ancillary activities for other legal units belonging to the same enterprise group.
Annual
Restricted from publication
Not applicable.
Length of comparable time series
1995 - 2002 (KAU concept)
2003 - 2009 (enterprise concept NACE Rev.1.1)
2005 - 2020 (enterprise concept NACE Rev.2)
Important events in the time series
A revision of SBS data series was completed in summer 2014 for the reference years 2005 to 2010 included. The revision was performed using NACE Rev.2 and included the revision of the profiling of some major players. The impact of the revision was significant for a few activities.
As of 2015, data from the Central Balance Sheet Office are used to impute units which are not part of the sample or which no recent survey data are available. The impact of the data integration is an overall improvement of the sampling error, potentially traded for an increased measurement error on the local level.
As of 2019 reference year, a rolling revision policy has been introduced. After the official production of reference year T (e.g. 2019) published during the year T+2 (e.g. 2021), a revision for the reference year T data is performed during T+3 (e.g. 2022). The impact of this revision not only removes local breaks in series due to temporary errors in NACE but also introduces a less desirable side-effect: due to the consideration of late VAT data during the revision, there is a potentially significant upward impact on the number of active enterprises (mainly very small entities) and the number of persons employed (excluding employees).


 with
with 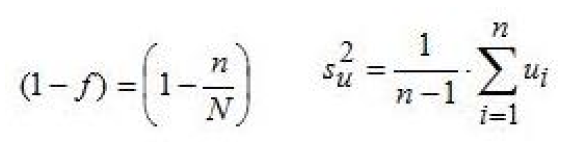 and ui = yi - R * xi