|
 |
| For any question on data and metadata, please contact: Eurostat user support |
|
|||
| 1.1. Contact organisation | STATEC |
||
| 1.2. Contact organisation unit | ENT3 Statistiques structurelles d'entreprises |
||
| 1.5. Contact mail address | 13, rue Erasme L-1468 Luxembourg |
||
|
|||
| 2.1. Metadata last certified | 21/12/2023 | ||
| 2.2. Metadata last posted | 21/12/2023 | ||
| 2.3. Metadata last update | 21/12/2023 | ||
|
||||||||||||||
| 3.1. Data description | ||||||||||||||
Structural business statistics (SBS) describes the structure, conduct and performance of economic activities, down to the most detailed activity level (several hundred economic sectors). SBS covers all activities of the business economy with the exception of agricultural activities, public administration and (largely) non-market services such as education and health. Main characteristics (variables) of the SBS data category: • "Business demographic" variables (e.g. Number of active enterprises) • "Output related" variables (e.g. Net turnover, Value added) • "Input related" variables: labour input (e.g. Number of employees and self-employed persons, Hours worked by employees); goods and services input (e.g. Purchases of goods and services); capital input (e.g. Gross investments) Business services statistics (BS) collection contains harmonised statistics on business services. From 2008 onwards BS become part of the regular mandatory annual data collection of SBS. The BS’s data requirement includes variable “Turnover” broken down by products and by type of residence of client. The annual regional statistics collection includes three characteristics due by NUTS-2 country region and detailed on NACE Rev 2division level (2-digits). |
||||||||||||||
| 3.2. Classification system | ||||||||||||||
Statistical Classification of Economic Activities in the European Community (NACE): NACE Rev.2 is used from 2008 onwards. Key data were double reported in NACE Rev.1.1 and NACE Rev.2 only for 2008. From 2002 to 2007 NACE Rev. 1.1 was used and until 2001 NACE Rev.1 The regional breakdown of the EU Member States is based on the Nomenclature of Territorial Units for Statistics (NUTS). The product breakdown is based on the Classification of Products by Activity (CPA) as stated in the Regulation establishing CPA 2008 and its amending Commission Regulation (EU) No 1209/2014 (from reference year 2015 onwards). |
||||||||||||||
| 3.3. Coverage - sector | ||||||||||||||
Starting reference year 2021 onwards SBS cover the economic activities of market producers within the NACE Rev. 2 Sections B to N, P to R and Divisions S95 and S96. From 2008 reference year data collection Business Services covers NACE Rev 2 codes: J62, N78, J582, J631, M731, M691, M692, M702, M712, M732, M7111, and M7112. |
||||||||||||||
| 3.4. Statistical concepts and definitions | ||||||||||||||
SBS constitutes an important and integrated part of the new European Business Statistics Regulation N° 2152/2019 Data requirements, simplifications and technical definitions are defined in Commission Implementing Regulation (EU) 2020/1197 |
||||||||||||||
| 3.5. Statistical unit | ||||||||||||||
Enterprise (national level); Local unit (regional level) |
||||||||||||||
| 3.5.1. Treatment of complex enterprise | ||||||||||||||
|
||||||||||||||
| 3.5.2. Consolidation | ||||||||||||||
|
||||||||||||||
| 3.6. Statistical population | ||||||||||||||
Only active market units are included. Active units encompass the following units: * units with a non-zero value of turnover or non-zero employees; * units which are active according to the SBS survey and not properly recorded in the administrative sources (e.g. VAT exempt units without employment); The market status of a unit is defined in terms of the national accounts institutional sectors. Sectors 12.7, 13 and 15 are excluded from the target population. The following units are specifically excluded: * temporary partnerships; * private persons producing energy using photovoltaic installation; * artificial subsidiaries and other special purpose entities dealing almost exclusively with group affiliates. There are no exclusions in terms of NACE. However, branch H.50 (water transport) is only available as a branch estimate and not as micro-data. Consequently, the size class dimension is not reliable. |
||||||||||||||
| 3.7. Reference area | ||||||||||||||
Luxembourg economic territory. |
||||||||||||||
| 3.8. Coverage - Time | ||||||||||||||
The available time series covers the reference years starting from 1995 to 2021. The length of comparable series is as follows: * 1995 - 2002 (KAU concept); * 2003 - 2008 (enterprise concept NACE Rev.1.1); * 2005 - 2021 (enterprise concept NACE Rev.2) - as of 2015 upwards (enterprise concept NACE Rev.2) - as of this reference year, data from the Central Balance Sheet Office is used for massive imputation, leading to several local breaks in time series. A revision of SBS data series was performed for the reference years 2005 to 2010 included based on NACE Rev.2. The revision was significant due to the adaptation of the enterprise definition for some multinational enterprises and in general due to changes in NACE codes for enterprises. As of 2012, the identification of the legal unit providing the activity support to the enterprise to which it belongs is allocated according to the contribution in terms of value-added of each legal unit composing the enterprise, in case the support unit allocated in the Business Register is too recent. The impact of this change is local and not global. As of 2012, punctual, local and significant breaks in series are flagged accordingly. The reasons for the breaks are typically significant errors in the NACE codes for enterprises as well as significant measurement errors detected in hindsight. As of 2014, the technical definition of the target population in terms of enterprises and KAUs has changed: KAUs without any activity support unit in the SBS target population as defined according to the enterprise concept are no longer part of the said population. The impact of this change in method has no significant impact but is important to ensure consistency with the financial sector. As of 2015, data from the Central Balance Sheet Office are used to impute units which are not part of the sample or which no recent survey data are available. The impact of the data integration is an improvement of the sampling error, potentially traded for an increased local measurement error. |
||||||||||||||
| 3.9. Base period | ||||||||||||||
Not applicable. |
||||||||||||||
|
|||
• Number of enterprises and number of local units are expressed in units. • Monetary data are expressed in millions of €. • Employment variables are expressed in units. • Per head values are expressed in thousands of € per head. Ratios are expressed in percentages. |
|||
|
|||
2021 The reference year corresponds with the calendar year. For each company with a different financial year than the calendar year, we take a decision regarding the SBS reference period. Normally, this decision is taken in such a way that at least 6 months of the financial year for a given company are included in the corresponding SBS reference period. Once that decision is taken, it is maintained every subsequent year for comparability reasons. |
|||
|
|||
| 6.1. Institutional Mandate - legal acts and other agreements | |||
Starting with reference year 2021 two new regulations currently form the legal basis of SBS:
Year 1995 was the first year for the implementation of the Council Regulation No 58/97 (SBS Regulation). The Council Regulation No 58/97 has been amended three times: by Council Regulation No 410/98, Commission Regulation No 1614/2002 and European Parliament and Council Regulation No 2056/2002. As a new amendment of the basic Regulation it was decided to recast the Regulation No 58/97 in order to obtain a new "clean" legal text. |
|||
| 6.2. Institutional Mandate - data sharing | |||
Not applicable. |
|||
|
||||||||||||||||
| 7.1. Confidentiality - policy | ||||||||||||||||
Regulation (EC) No 223/2009 of the European Parliament and of the Council on the transmission of data subject to statistical confidentiality to the Statistical Office of the European Communities. Loi du 10 juillet 2011 portant organisation de l’Institut national de la statistique et des études économiques on statistical confidentiality as it applies to the Luxembourgian Statistical System. |
||||||||||||||||
| 7.2. Confidentiality - data treatment | ||||||||||||||||
Primary rules We apply the (n,k)-dominance rule, i.e. a cell is suppressed if n units separately or jointly dominate the total value of a cell by at least k%. The (n, k) parameters for Luxembourg are confidential. For any cells that are left after applying the sensitivity rule, a minimum frequency is applied. A cell is suppressed if there are less than n units in a given cell. The n parameter for Luxembourg is confidential. The primary rules' underlying parameters are kept confidential because their disclosure could compromise the safety of the primary suppressed cells. Secondary confidentiality rules The secondary suppression is calculated by tau-Argus using the ‘Modular’ algorithm. Manual suppressions or cost adjustments are performed to adjust the secondary confidentiality pattern calculated by the software. a) Secondary suppression within a table • A cell is suppressed for secondary confidentiality if n units jointly or separately dominate the confidential subtotal by at least k%; • special attention is paid to the impact of singletons, a risk which is in most cases directly addressed by the tau-Argus Modular algorithm; • tau-Argus is set to minimise the cost when determining the secondary suppressed cells. However, we also want to provide the user with relevant data, whether it is in terms of interpretation and/or availability of time series. Consequently, the cost minimisation can be overridden for economic and/or historical reasons. b) Secondary suppression due to linked-table disclosure risks A link is defined to exist between a cell sharing the same cell coordinates in two tables if an estimate for that cell based on the source table can be produced within p% range of the primary confidential cell's value of the target table. Most often, estimates based on the rule of three and linear interpolation, both of which are common user scenarios, are tested. Please note that p% only refers to the relationship between the dominance and p% thresholds and not to the p% sensitivity rule. The following linked-table risks are addressed: • historical disclosure (time dimension): no primary historically confidential cell should be compromised by disclosing the same cell for the current reference year. As long as there is a significant link with a prior year primary confidential data, a cell may not be disclosed for the current reference year. • links to any other table sharing at least one dimension, including SBS tables by activty. Other SDC policy considerations The statistical confidentiality analyses are performed on the basis of turnover (shadow variable approach). The same pattern is therefore applied to all variables, including the number of enterprises when applicable. As a general principle, the NACE section level data, if not broken down by any other dimension than NACE and if unfiltered, are not considered confidential, except if the section has a trivial breakdown. There can be other case-by-case exceptions to this general principle. |
||||||||||||||||
| 7.2.1. Confidentiality processing | ||||||||||||||||
|
||||||||||||||||
|
|||
| 8.1. Release calendar | |||
Data are disseminated nationally but without a predefined release calendar. |
|||
| 8.2. Release calendar access | |||
Not applicable. |
|||
| 8.3. Release policy - user access | |||
All information accessible to the users are available in the published publications and in the published on-line databases. |
|||
|
|||
Annual. |
|||
|
|||
| 10.1. Dissemination format - News release | |||
Currently, no news release for SBS. |
|||
| 10.2. Dissemination format - Publications | |||
SBS publications are typically available in FR and some in EN language. Publications - page 1 - Statistiques - Luxembourg Recent publications Portrait chiffré des entreprises - Statistiques - Luxembourg (public.lu) |
|||
| 10.3. Dissemination format - online database | |||
Annual dissemination. |
|||
| 10.4. Dissemination format - microdata access | |||
Any national micro-data access is governed by article 16 of the Law of 10 July 2011 on the organisation of the National Institute for Statistics and Economic Studies. |
|||
| 10.5. Dissemination format - other | |||
Data are transmitted annually to Eurostat either to be used in European aggregates and for country comparisons. |
|||
| 10.6. Documentation on methodology | |||
Methodological guidelines are generally in FR (ad-hoc publications or data publications), while definitions are embedded whenever available in the relevant tables (FR and EN) Structure et activité des entreprises - Statistiques - Luxembourg (public.lu) |
|||
| 10.7. Quality management - documentation | |||
Quality documentation is generally in FR and be found in ad-hoc publications or data publications. Quality reports are only available in EN. Structure et activité des entreprises - Statistiques - Luxembourg (public.lu) |
|||
|
|||
| 11.1. Quality assurance | |||
The application of the European Statistics Code of Practice is monitored by the national quality delegate. Further documentation can be found here: |
|||
| 11.2. Quality management - assessment | |||
Sampling error has become less relevant as of reference year 2015 because of the integration of a massive administrative data source. The overall sampling error can be deemed negligible to small. Locally, there may be higher sampling errors, for example in activity branches where both survey and administrative source data are less available or relevant. Higher sampling errors are observed for variables which cannot be be easily collected via administrative source, such as unpaid workers, investments and variables which take into account a geographic or product dimension. Most measurement errors are in relation with NACE reclassifications and can lead to local breaks in series. In recent years, some globalisation phenomena observed through multinational enterprises have become the source of some very significant interpretation difficulties and therefore potential error. As of 2019 reference year, a rolling revision policy has been introduced. For further details, please refer to the chapters 12 to 15. |
|||
|
|||
| 12.1. Relevance - User Needs | |||
External users: public and private research institutions, marketing companies, national central bank, lobby and policy groups, private users, university students, academic users and others. External users are often interested in the variables “number of [units]”, “turnover”, “value-added” and “employment” by economic activity as well as by employment size class. Sometimes, concentrations ratios (e.g. market share of top 5 companies, etc.) are requested but due to disclosure issues, these are not provided. Internal users: national annual accounts, CIS-R&D statistics, ICT statistics, short-term statistics, foreign direct investment, internal research department, satellite accounts (culture, tourism). Internal users often need micro level data. SBS micro level data are mainly used as a direct data source for the production of other statistics (e.g. national annual accounts including the financial account, ICT, CIS-R&D) or to calculate index weights (e.g. short-term statistics). Other uses are quality checks, use of the data for sampling purposes, etc. Internal users and business services. Some data published nationally are different from European data As of the revision from 2005 onwards in NACE Rev.2, the data are finally fully aligned with Eurostat with the following limits. The definition of turnover is not the same for the period from 2005 to 2020 included. For national purposes, the national variety, which includes royalties, has been published for consistency reasons. For activity N77, the non-inclusion of royalties makes it impossible to match turnover with total purchases, even though they are included in the production value and in the value-added. However, not all variables are subject to national publication (e.g. subcontracting, investment by type of tangible asset, leasing, etc.). On the other hand, some variables are nationally published for all activities, whereas on the Eurostat website they are not (e.g. number of hours worked, changes in inventory, etc.). |
|||
| 12.2. Relevance - User Satisfaction | |||
No user satisfaction survey conducted in this statistical area. |
|||
| 12.3. Completeness | |||
Breakdown in series: water transport (H 50) The activities missing in series 1A and 1B are related to subdivisions of water transport, more precisely sea and coastal water transport. Water transport activities are a very complex issue in Luxembourg. Technically, it is a national NACE classification and an institutional sector issue. Several hundreds of legal units have so far declared themselves as active in water transport, whereas in substance only certain sub-activities (e.g. logistics, management, leasing & renting, etc.) can be realised on or from the economic territory of Luxembourg, given the lack of access to any sea or the lack of direct access to any significant river. An analysis performed in 2003 allowed delimiting the population eligible for water transport activities. However, ever since the analysis could not be updated due to a lack of resources. Furthermore, the said analysis results were only available as a NACE Rev.1.1 activity branch estimate (instead of micro data), so that the transition of the analysis towards the relevant NACE Rev.2 codes was impossible. Consequently, there are currently still no data by size class for this branch and no estimate for branch H 50.2, given the lack of such a detailed breakdown in NACE Rev.1.1. The analysis conducted in 2003 was updated in November 2011 by SBS staff. However, the results of the project remained inconclusive regarding the link with the NACE classification – more particularly, any outcome required the coordination with the Business Register unit as well as the National Accounts unit, both of whom had other priorities at that time. The project has unfortunately been put on hold ever since. The required actions are: The project was started in 2017 and has finished in 2023. It is now awaiting green light by Eurostat and deployment thereafter. |
|||
|
|||
| 13.1. Accuracy - overall | |||
Sampling error is mainly relevant for small size classes but also more generally for certain caracteristics (e.g. unpaid persons employed). This error has most often a local impact. Since 2015, the sampling error has been reduced due to the integration of administrative source on accounting data. Coverage errors are relevant for activities which carry little to no employment and which are not or only partially covered by VAT data. Examples of such activities are real estate activities, parts of the financial and health sectors. The failure to identify special purpose entities early on is another potential source of coverage error. Overall, the impact of coverage errors is local. Non-response error is generally low due to imputation strategies. For certain activities (e.g. construction, real estate), imputation is nonetheless more challenging and can thus locally generate significant misstatements. Measurement errors pertain mainly but not only to errors in the NACE classification and can be of significant impact locally as well as globally. NACE errors are the most difficult to deal with because nothing can be done other than accepting them and, if necessary, producing revised data for the past. NACE errors are the main cause for documented breaks in the time series. Errors due to the misinterpretation of or incomplete information on globalisation phenomena is rare but can have significant global impacts due to the big figures of multinational enterprises. Massive imputation via administrative sources is another source of measurement error: understated investment variables, slightly understated personnel costs (until reference year 2014 included), and misstated profit & loss variables as of the reference year 2015 (new data source). However, reasonable data processing and analysis procedures are in place to ensure that the most significant errors are captured before dissemination. Therefore, such errors bear only a local significance. Data processing errors are rare but may have a significant impact if they go undetected. The aforementioned data processing and analysis procedures are normally sufficient but in the past a few rare cases of such errors slipped into published data. Preliminary results for SBS are mostly burdened by undercoverage errors (insufficient VAT data available for units with no employment), data processing errors (due to imputation) and measurement errors (mainly due to NACE misclassifications). The period from the production of preliminary results to the production of final results is approximately 9 months. Since reference year 2019, an administrative source on accounting data is additionally used to complete the SBS population, including the one used for preliminary results. |
|||
| 13.2. Sampling error | |||
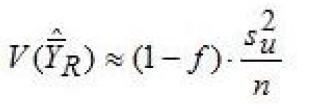
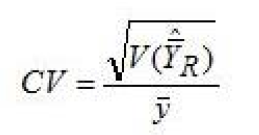
Impact of sampling error Sampling error has become less relevant as of reference year 2015 because of the integration of a new massive administrative data source. Since 2017, the overall sampling error can be deemed negligible to small. Locally, especially by employment size class, there may still be higher sampling errors. Estimator description The ratio estimator is used for grossing up. Please refer to section 18.5 for further details on grossing up procedures. The formula of the CV for the ratio estimator has been programmed in Stata implementing the analytic formulas described in the book “Techniques de sondage” by Pascal Ardilly (ISBN 10: 2-7108-0847-1). Given the ratio R, the sampling variance has been estimated using the residuals (u) between the variable of interest (y) and the ancillary variable (x) : with and ui = yi - R * xi The CV has been calculated using the following formula:
Use of ancillary data The CVs have been calculated for a given variable of interest with the corresponding ancillary variable. The following variables of interest have been grossed up using the ancillary variable “turnover”: "Total net turnover" and "Value-added". The following variables of interest have been grossed up using the ancillary variable “number of employees”: "Tangible gross investments" and "Number of persons employed". Variable "Personnel costs" has been grossed up using the ancillary variable “personnel costs” available through administrative sources. For the variable "Number of enterprises", the CV is zero, as it is available for every unit in the business register and thus does not need to be estimated. For the variable "Number of employees", the CVs should be close to zero because, for the units not part of the survey, the administrative data source is used for hot-deck ratio imputation. For "Number of persons employed", this may not be the case because self-employed persons are not obtained from an administrative source. Limits of the CV calculation The CV has been calculated for every single cell, i.e. by activity broken down by employment size class. However, please note that the CV is not available for the following cells: • zero value cells in the target population: the CV has been imputed to zero, even though technically its calculation is simply not applicable; • cells with no unit or only one unit in the sample: the CV cannot be calculated and the corresponding cell's CV is flagged as unreliable. This can happen when the target population is small and more frequently at the employment size class level. Grossing-up strata may be less detailed than the "activity x employement size class" breakdown requested by Eurostat. It should be noted that the CV for variables that can take negative values (e.g. variable "Value added") may not necessarily the most appropriate indicator to assess the sampling error. |
|||
| 13.3. Non-sampling error | |||
1. Non-sampling error Measurement errors can be frequent but are most often of minor importance. Most measurement errors are in relation with NACE reclassifications and can lead to local breaks in series. In recent years, some globalisation phenomena observed through multinational enterprises have become the source of some very significant interpretation difficulties and therefore potential error. This is mainly due to a growing importance of flows generated by multinationals as well as vague or absent methodology regarding the proper statistical treatment of these phenomena. As a consequence, Luxembourg has set up a Large Cases Unit, which has been operational since 2018, to centralise information regarding multinationals with the objective to seek consistency across statistical domains regarding their treatment. In case that such errors are observed posterior to SBS publication, impacted cells are subject to relevant quality flags (if available and meaningful, e.g. break in series, unreliable, contributes to EU total only, etc.) until the revision of the impacted reference year(s). 2. Measures to minimize non-response Non-response concerns units for which any of the following characteristics applies:
In rare situations, we enforce statistical obligation on a case-by-case basis by filing a legal complaint against big units which have repeatedly failed to respond with usable data or at all. 3. Imputation methods for dealing with non-response As of reference year 2015, data from the Central Balance Sheet Office are used to impute units which are not part of the sample or which no recent survey data are available. The impact of the data integration is an improvement of the sampling error, potentially traded for an increased measurement error. Alternatively, non-responding units are imputed using the cold-deck ratio imputation. This method consists in applying an individual growth ratio expressed in terms of an adminstrative data indicator (turnover, number of employees, personnel costs) to the latest available survey data for the last 10 years. In some cases, mainly for bigger companies, the ratio is manually adjusted using annual business accounts available for the reference period. This provides an even more precise estimate. If the ratio is abnormally high (compared to other similar units in the stratum) or if there is a weak correlation between the administrative variable and the survey variable, this type of imputation is not performed. If no historical data are available or if those data are deemed outdated, the units are grossed up using the same procedures as for units not covered by the sample or by imputed data. This form of imputation is not used for the family of variables related to investments. However, an administrative source is used to impute this variable. Imputation procedures for employment variables are similar to the general approach. However, for variables "Number of full-time equivalent employees" and "Hours worked by employees", administrative source data as well as variable "Number of employees" are used. 4. Weighted non-response rate The weighted unit response rate is weighted using the variable "Net turnover". The response rate is equal to 100% for the variables "Number of enterprises" and "Number of employees", as they are available in the administrative sources. Overall, the weighted unit response rate is 96% in 2021. However, in some economic activities, the rate can be much lower, more particularly for activity branches in which there is a limited availability of business accounts. Furthermore, the non-response rate itself can also be missing, i.e. if there was no unit in the sample for a given cell and/or no unit in the target population. It should be noted that : • it is often not possible to use the same strata for estimation as those foreseen in the data transmission format. Given the fact that estimated values are imputed on a micro data level (imputation is done based on the relative importance of turnover for each unit), it is nonetheless possible to disclose the results according to the data transmission format ; 5. Bias from non-response and from the estimation method Bias resulting from non-response For the units for which administrative accounting data is available, the bias due to non-response is practically equal to zero. For the units to which the cold-deck ratio imputation method has been applied, the bias is significantly reduced when that ratio is adjusted with observations from the annual business accounts (if available). For most units, such an adjustment is not performed due to limited resources and the limited availability of detailed annual business accounts for small businesses in particular. Nonetheless, the use of adjusted past survey data certainly reduces the bias resulting from non-response. If no historical survey data are available for a given unit, the latter is handled in the same way as any unit which is not included in the sample. The bias would then result from the estimation method. In most cases, this concerns only small businesses, which have a minor impact on the aggregate value of the variables of interest. Given the above, the bias can be evaluated as being small. Bias resulting from the estimation method According to the book reference mentioned in section 13.2, the ratio estimator is biased, the formula of the bias being complex but with an order of magnitude of 1/n. Consequently, the higher n (sample size), the smaller the bias. However, if n was small or if there was a weak linear correlation, the bias of the ratio estimator could be significant. While the bias resulting from the estimation method remains unknown, the estimation method mainly concerns small units. Given the new administative accounting data source and the fact that mainly small units are concerned by estimation, we believe that it has a limited effect in the overall accuracy of the estimate. 6. Coverage error Impact of coverage errors on the key statistics: medium 7. Out-of-scope units Definition The most frequently observed type of out-of scope units are legal units which are incorporated or registered in Luxembourg but which at the same time do not have any non financial economic activity in the Luxembourg economic territory (e.g. real-estate rental activities with buildings in foreign territories only, companies where the activity is done in foreign branches only, some activities related to shipping, group-only special purpose entities, etc.). Another significant type of out-of-scope units relates to non-market activities. Identification Such units are identified and dealt with on a case-by-case basis by the staff involved in national accounts, SBS, business register and balance of payments. This kind of information is also increasingly centralised through the business register. Estimated number of undetected units There is a list of companies which have been excluded from the SBS population for the above reasons. However, we have no estimate of the number of undetected out-of-scope units still lingering in the SBS population. With the extension of the SBS tables in terms of activity coverage, more particularly section K, the risk of undetected out-of-scope units has increased. |
|||
|
|||
| 14.1. Timeliness | |||
Time between end of reference period and national data dissemination: t+22 to t+24 months |
|||
| 14.2. Punctuality | |||
The transmission of reference 2021 data was punctual for the tables covered for national data and delayed by a few weeks for local units tables (regional data). |
|||
|
||||||||||||
| 15.1. Comparability - geographical | ||||||||||||
Not applicable. |
||||||||||||
| 15.2. Comparability - over time | ||||||||||||
Length of comparable time series 1995 - 2002 (KAU concept) 2003 - 2009 (enterprise concept NACE Rev.1.1) 2005 - 2021 (enterprise concept NACE Rev.2) Important events in the time series A revision of SBS data series was completed in summer 2014 for the reference years 2005 to 2010 included. The revision was performed using NACE Rev.2 and included the revision of the profiling of some major players. The impact of the revision was significant for a few activities. As of 2015, data from the Central Balance Sheet Office are used to impute units which are not part of the sample or which no recent survey data are available. The impact of the data integration is an overall improvement of the sampling error, potentially traded for an increased measurement error on the local level. As of 2019 reference year, a rolling revision policy has been introduced. After the official production of reference year T (e.g. 2019) published during the year T+2 (e.g. 2021), a revision for the reference year T data is performed during T+3 (e.g. 2022). The impact of this revision not only removes local breaks in series due to temporary errors in NACE but also introduces a less desirable side-effect: due to the consideration of late VAT data during the revision, there is a potentially significant upward impact on the number of active enterprises (mainly very small entities) and the number of persons employed (excluding employees). As of 2021 reference year, the SBS have been extended to NACE sections P, Q, R and K as well as NACE division S96, in conformity with the EBS regulation. These more recently added activity branches present certain challenges, most of which will be ironed out in the time to come. |
||||||||||||
| 15.2.1. Time series | ||||||||||||
|
||||||||||||
| 15.3. Coherence - cross domain | ||||||||||||
Business demography Timing differences are generally small. Most differences are permanent. Since 2007, business demography more accurately reflects the number of enterprises than SBS for legal activities (NACE code 69.1) because the administrative sources are insufficiently detailed for SBS purposes and thus to maintain internal consistency between all the variables. As long as the administrative sources do not improve, this inconsistency is there to stay. Regarding the differences observed in trade activities, SBS took a different historical path than business demography: the latter assumed that some very small units should be dismissed as inactive, whereas in SBS the said units would be kept in the target population. A project has started in Luxembourg which will explore these differences in more detail and which seeks to have both domains converge. Prodcom Not available in Luxembourg. National accounts Consistency has been officially documented for the variables "Turnover", "Value of output" and "Number of persons employed". Generally, differences arise from diverging methodologies. While SBS is generally based on a bottom-up approach, consisting in aggregating business accounts figures, national accounts integrate other data sources at a more aggregated level (e.g. taxes, other sectors, illegal activities, etc.) - such integration requires the use of balancing procedures, which results in differences with SBS. Timing differences are also possible but generally of low impact. Furthermore, it appears that "Number of hours worked by employees" is generally lower in national accounts figures than for SBS or LCS. Short-term statistics No efforts have been invested so far in analysing the potential or actual data inconsistencies between SBS and STS. However, the latter uses SBS data by KAU for weighting purposes. Labour Cost Survey (LCS) for wages and salaries per employee If we consider only the population of enterprises employing at least 10 persons and only those economic activities which are covered by both statistics at the same time, the figures are similar. |
||||||||||||
| 15.4. Coherence - internal | ||||||||||||
Internal inconsistencies stem most often from rounding errors. |
||||||||||||
|
|||
Burden on enterprises Burden on responding enterprises is minimal (1-2 hours in average per enterprise) due to the following response options: * sending of the raw data (trial balance, business accounts, etc.) to STATEC for processing by our staff; * significant reduction of burden in case a firm files their data according to the standard accounting chart. In case that an enterprise does not make use of any such facilities, the average response burden is 8 hours in average to fill in the complete survey form. One should keep in mind that these average figures do not fully reflect the distribution of burden by company size and other criteria. Additional cost of the NSI due the European SBS production The additional cost for Eurostat deliverables is estimated to roughly 12 full-time equivalent months. |
|||
|
|||
| 17.1. Data revision - policy | |||
As of reference year 2019, a rolling revision policy has been introduced for SBS. This decision was taken to the minimise the need for costly major revisions. After the official production of reference year T (e.g. 2019) published during the year T+2 (e.g. 2021), a revision for the reference year T data is performed during T+3 (e.g. 2022). The impact of this revision does not only remove any local breaks due to temporary errors in NACE but it also introduces a less desirable side-effect: due to the consideration of late VAT data, there is a significant upward impact on the number of active enterprises (mainly very small entities) and the number of persons employed (not employees). This effect does also occur with a major revision, only that in this case parts of the time series will be revised and not just a single reference year. Furthermore, the aforementioned effect has been recently amplified by the fact that official deadlines for filing VAT returns have been increased by another two months ever since Covid-19. Statistical disclosure control is still a considerable bottleneck to any revision policy, given the detailed breakdowns in SBS and the links with other domains (IFATS, ICT, CIS, BERD). However, while SBS are revised, the other statistical domains will most often not follow due to resources constraints. Consequently, cross-domain coherence is impacted by this revision policy. The latest major revision was undertaken in 2014 for the data series 2005 - 2011 included. |
|||
| 17.2. Data revision - practice | |||
Methods for compiling preliminary data Since reference year 2016, Central Balance Sheet Office data for the current reference year are used when available. Before 2016 or in case of no such administrative data, preliminary data series are based on estimates which consist, for the vast majority of cases, of adjusted survey data from the reference year t-1. The adjustment is possible due to the use of up-to-date administrative data sources, using mainly the cold-deck ratio imputation as described in section 13.3. Units for which there is no t-1 survey data are grossed up using the estimation method described in section 18.5. Comments on the differences between final and preliminary estimates There is a consistent underestimation of preliminary data compared to final data. This is because the VAT administrative data are not complete at t+9 or t+10 months, so that the preliminary target population is potentially incomplete for both self-employed businesses and businesses without any employees. The late availability is explained by the final administrative deadline for companies to file their annual VAT declaration (set at t+10 to t+12 months). An adjustment is performed for businesses who have not yet filed their VAT declaration at the compilation date but who employ more than 0 employees in average during the reference year, which reduces the impact. - Number of persons employed In 2021, the preliminary number of persons employed for the total business economy was understated, the final figure being 0.1% above the preliminary figure (2020, non-financial business economy: 1.3%). For 2021, this is in line with expectations, given the incomplete target population and thus an incomplete number of "unpaid" persons employed. For NACE Rev.2 section Q more specifically, a methodological adaptation caused a more significant difference. At the 3-digit NACE level, the relative absolute mean revision was 1.4% (2020 non-financial business economy: 2.1%). This is mainly explained by the aforementioned reasons as well as by changes in NACE codes for some businesses between the preliminary and the final data productions. - Turnover In 2021, the preliminary turnover for the total business economy was understated, the final figure being 3.4% above the preliminary figure (2020 non-financial business economy: 19.4%). In addition to the incomplete target population, the difference is also explained by the structural differences between turnover as per VAT and turnover as per business accounts. Only some of these differences can be smoothened at the preliminary production stage, more particularly through ad-hoc editing and the ratio imputation. In the methodological front, K643 and Q86 were revised more significantly. At the 3-digit NACE level, the relative absolute mean revision was 7.5%, (2020 non-financial business economy: 22.5%). This indicator usually emphasizes the explanations here above and is mainly explained by the aforementioned reasons as well as by changes in NACE codes for some businesses between the preliminary and the final data productions. |
|||
|
||||||||||||||
| 18.1. Source data | ||||||||||||||
Statistical survey combined with administrative sources At the heart of the data collection is the annual structural business survey. The annual sample of the said survey is based on a stratified random sampling design. Using number of employees and turnover thresholds, the sample is divided into several parts: * survey sample: any legal units employing either more than 50 employees or having declared a turnover excluding VAT of more than 12 million EUR per annum are selected every year. Any legal units linked to the aforementioned units (e.g. group and enterprise links) are also selected to form part of the survey every year. To cover the needs of national accounts and SBS, the survey sample size is roughly equal 3000 reporting units; * administrative source sample: the legal units are selected using a stratified random probability sampling design. Units in strata consisting of only one unit are always selected. These units are imputed using detailed administrative accounting data. The reason for sampling is to provide a possibility to use them for grossing up units which have not yet reported their accounting data at the production moment. The stratification used in the sample design does not take into account the size classes defined in the SBS regulation. However, mass imputation procedures exist on a micro data level, so that data can be broken down according to any spanning variable defined a posteriori: * as of 2015, detailed accounting data from the Central Balance Sheet Office are used to impute units which are not part of the sample or which no recent survey data are available (with a sample weight of 1) - this source covers balance sheet and profit & loss data. In 2021, the data source accounts for more than half of the SBS population; * as of 2005, social security data to impute number of employees, personnel costs and number of hours worked by employees; * detailed VAT data to impute investment variables; * VAT and social security key indicators to impute non-respondent units using the cold-deck ratio imputation method. Data sources used for the population frame or target population The statistical business register is the primary source for building the target population. The said register is enriched by key data from social security and VAT, and since 2019 from administrative accounting data. These data are used to determine the activity status of any enterprise. Only active units are retained. There is no threshold on employment and turnover, except that either has to be positive for the reference year in question. In addition, for units having no employment and not covered by either VAT or accounting data source, the survey helps to identify a few active units. They are added to the population frame. NACE classification The difference between principal and secondary activities is directly available in the business register. The approach to identify principal activities is the top-down approach. Stability rules are in place to avoid yearly shifting between principal and secondary activities. The update frequency of the business register is daily. However, for SBS purposes the extract of the business register is frozen at a given date. From that point on, changes in NACE are only performed through a dedicated working area. Relation between the reporting unit and the enterprise In the SBS survey, the reporting unit is the legal unit. However, for a very few legal units, the data are collected separately for the economic subdivisions of the legal unit. Moreover, local unit data are collected at legal unit level. In the administrative sources, the reporting unit is the legal unit. Finally, the statistical unit "enterprise" can be a legal unit or a group of legal units. Enterprises which are formed by a group of legal units are not the general case in Luxembourg but their occurrence is significant, in particular due to many legal units specialized in ancillary activities for other legal units belonging to the same enterprise group. |
||||||||||||||
| 18.1.1. Data sources overview | ||||||||||||||
|
||||||||||||||
| 18.2. Frequency of data collection | ||||||||||||||
Annual data collection. |
||||||||||||||
| 18.3. Data collection | ||||||||||||||
Survey forms are sent out by postal mail due to its complexity. Questionnaires are organised by economic activity, with a total of 7 customised survey forms. Respondents have the following response options: 1. fill in the complete survey form; For procedures pertaining to minimising non-response, please refer to chapter 13.3. Administrative data are accessed mainly through the business register. Some sources are separate available in the form of flat files (e.g. accounting data). There is no direct access to any administrative database. |
||||||||||||||
| 18.4. Data validation | ||||||||||||||
Survey data are subject to an in-depth validation programme. Administrative source data are checked for plausibility for every unit in the sample and on a case-by-case basis with annual business accounts (if available at the Register of Commerce). For the units not covered by the survey, outlier / leverage point tests are performed to avoid any negative impacts on the ratio estimation. Type of controls The test environment underlies an objective-driven risk management strategy. This ensures that the survey data comply with the pre-defined quality standard. The following documentation (in French) describes an old version of framework used to cover non sampling errors for the survey reference year 2005, i.e. in the context of the old regulatory framework. There is no updated version of the report, for it is was published as a working paper and thus is not an official methodological document by STATEC. However, it provides an idea of the type of control environment that we have in place in the area of SBS survey data. PDF Economie et statistiques 29/2009 - Statistiques - Luxembourg (public.lu) The test environment covers both micro-data and tabular data and consists in control activities which cover * completeness (data integrity rules); Errors in the administrative sources Error checking activities in the administrative sources consist in the following: * analysis of the correlation between survey and administrative variables; |
||||||||||||||
| 18.5. Data compilation | ||||||||||||||
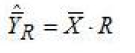
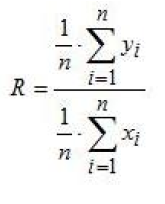
Unit non-response imputation Please refer to chapter 13. Item non-response imputation Given that SBS data are above all quantitative and that they also serve the needs of national accounts, it is very difficult to identify item non-response. This is in particular true for units who are included only once in the sample in a given time series. For the bigger companies, we are able to follow their structure over a larger period and thus to identify item non-response in an easier way. Item non-response is therefore dealt with on a case-by-case basis during editing procedures. Missing or erroneous information in the administrative source For some economic activities, VAT data are not available. No imputation is done on administrative data. If employment data are significant for a given unit, it is very likely included in the survey data. Consequently, the occurrence of missing data in the VAT and social security administrative source is rare and of low impact. In the rare case of missing or the more frequent case of erroneous administrative data, adjustments are performed in a dedicated working area. For the standard chart of accounts data source (available as of 2015), any missing data is imputed using the either cold-deck ratio imputation or hot-deck ratio imputation (grossing up). Grossing up When grossing up survey data, we always take into account ancillary data available in the administrative sources, i.e. the ancillary variables “turnover” and “number of employees”, and not only the sample design. The aforementioned ancillary variables most often have a linear correlation with the variables of interest in SBS. Consequently, the ratio estimator is used for grossing up. With the variable of interest being available only for the sample (y) and with the ancillary variable being available both for the sample (x) and the SBS target population (X), the ratio estimator of the variable of interest , expressed as an average, can be written: The ratio R has been formulated in the following way: If for a given stratum no unit is available in the sample, i.e. neither for the historical periods nor for the reference period, the units in this stratum are grouped together with another stratum for which sample data are available and are then grossed up. Variables "Number of enterprises", "Personnel costs", "Wages", "Social security charges", "Number of employees", "Number of full-time equivalent employees" and "Number of hours worked by employees" are directly derived from administrative source data and therefore do not need to be grossed up (as from reference year 2009). If prior year survey data are available, a cold-deck ratio imputation is performed – this significantly reduces the bias in case there are permanent differences between the admin source and the survey data for a given unit. For the other units, administrative data are simply pasted into the data set. Please also refer to chapter 13. |
||||||||||||||
| 18.6. Adjustment | ||||||||||||||
If the reference period of a company differs from the calendar year, there is no correction to bring it in accordance with the statistical reference period. For each company with a different financial year than the calendar year, we take a decision regarding the SBS reference period. Normally, this decision is taken in such a way that at least 6 full months of the financial year for a given company are included in the corresponding SBS reference period. Once that decision is taken, it is maintained every subsequent year for comparability reasons. |
||||||||||||||
|
|||
No further comments. |
|||
|
|||
|
|||