


1.1. Contact organisation
Statistics Sweden
1.2. Contact organisation unit
Economic Statistics and Analysis
1.3. Contact name
Confidential because of GDPR
1.4. Contact person function
Confidential because of GDPR
1.5. Contact mail address
Statistics Sweden
Att. Nils Adriansson
ESA/NUP/INF
Solna strandväg 86, Solna
SWEDEN
1.6. Contact email address
Confidential because of GDPR
1.7. Contact phone number
Confidential because of GDPR
1.8. Contact fax number
Confidential because of GDPR
2.1. Metadata last certified
14 August 2023
2.2. Metadata last posted
14 August 2023
2.3. Metadata last update
14 August 2023
3.1. Data description
Statistics on higher education R&D (HERD) measure research and experimental development (R&D) performed in the higher education sector, i.e. R&D expenditure and R&D personnel. In line with this objective the target population for the national R&D survey of the higher education sector should consist of all R&D performing institutional units (including all R&D performers – occasional and continuous, known and unknown - in all branches and size classes) belonging to this sector.
The main concepts and definitions used for the production of R&D statistics are given by the OECD (2015), Frascati Manual 2015: Guidelines for Collecting and Reporting Data on Research and Experimental Development, The Measurement of Scientific, Technological and Innovation Activities, which is the internationally recognised standard methodology for collecting R&D statistics and Eurostat’s European Business Statistics Methodological Manual on R&D Statistics(EBS Methodological Manual on R&D Statistics) complements this with guidelines for further harmonisation among EU, EFTA and candidate countries.
Since the beginning of 2021, the collection of R&D statistics is based on Commission Implementing Regulation (EU) No 2020/1197 of 30 July 2020. The Regulation sets the framework for the collection of R&D statistics and specifies the main variables of interest and their breakdowns at predefined level of detail. Statistics on science, technology and innovation were collected until the end of 2020 based on Commission Implementing Regulation (EU) No 2012/995 concerning the production and development of Community statistics on science and technology.
3.2. Classification system
- The local unit for the statistics are compiled at regional level according to NUTS 2 – Nomenclature of Territorial Units for Statistics;
- The distribution by socioeconomic objectives (SEO) are based on Nomenclature for the Analysis and Comparisons of Scientific Programmes and Budgets (NABS);
- The fields of research and development are based on Classification and distribution by Fields of Research and Development (FORD).
3.2.1. Additional classifications
No additional classifications used.
3.3. Coverage - sector
See below.
3.3.1. General coverage
| Definition of R&D | No deviations. |
| Fields of Research and Development (FORD) | No deviations. |
| Socioeconomic objective (SEO by NABS) | No breakdown by socioeconomic objectives is available for the Higher education sector. |
3.3.2. Sector institutional coverage
| Higher education sector | Units belonging to the Higher education sector are identified by the Swedish Higher Education Authority. They provide a list of units identified as higher education institutions that have received funding for R&D for the reference year. Information on the affiliation of higher education institutions is obtained from the Statistical Business Register, which contains information about the ownership status of legal units. |
| Tertiary education institution | Included. |
| University and colleges: core of the sector | Included. |
| University hospitals and clinics | Units that provide training/teaching are included. |
| HES Borderline institutions | No units identified. |
| Inclusion of units that primarily do not belong to HES | No units included that do not belong to HES. |
3.3.3. R&D variable coverage
| R&D administration and other support activities | Included, no deviations from FM15. |
| External R&D personnel | Master students and doctoral students externally employed by business enterprises are not included. |
| Clinical trials | Clinical trials funded by the Higher education sector are included. When trials are funded by actors from other sectors, only the part funded by HES is included. |
3.3.4. International R&D transactions
| Receipts from rest of the world by sector - availability | Available. |
| Payments to rest of the world by sector - availability | Not available for the Higher education sector. |
3.3.5. Extramural R&D expenditures
According to the Frascati Manual, expenditure on extramural R&D (i.e. R&D performed outside the statistical unit) is not included in intramural R&D performance totals (FM, §4.12).
| Data collection on extramural R&D expenditure (Yes/No) | No. |
| Method for separating extramural R&D expenditure from intramural R&D expenditure | No method available for separating extramural R&D expenditure from intramural R&D expenditure for the Higher education sector. |
| Difficulties to distinguish intramural from extramural R&D expenditure | R&D expenditure is derived from data on funding for R&D, thus it is not possible to distinguish between extramural and intramural R&D expenditure. |
3.4. Statistical concepts and definitions
See below.
3.4.1. R&D expenditure
| Coverage of years | Calendar year. |
| Source of funds | R&D expenditure is collected on most of the sources of funds specified in Table 4.3 in FM15. Data is not collected on Higher education sector and Government sector in the Rest of the World, only the EU is included in international organisations. |
| Type of R&D | No divergence from FM15. R&D expenditure by type of R&D is estimated based on data from the time-use survey. The effects of differences in fixed costs associated with different types of R&D are therefore not captured. |
| Type of costs | Current costs are only available as a total, no breakdown by labour costs and other current costs is available. Capital costs are available both as a total and broken down into capital costs for land and buildings and capital costs for machinery and equipment respectively. |
| Defence R&D - method for obtaining data on R&D expenditure | No method is available to identify defence R&D in the Higher education sector. |
3.4.2. R&D personnel
See below.
3.4.2.1. R&D personnel – Head Counts (HC)
| Coverage of years | Calendar year. |
| Function | Only reasearchers and other supporting staff. Function is estimated using a national categorisation of educational staff and the time-use survey, this may in some cases cause divergences from the definitions in FM15. |
| Qualification | ISCED 1-4, 5-7 and 8. Qualifications obtained abroad are not always available in the register on personnel in at higher education institutions from which this variable is collected. |
| Age | No breakdown by age is available for the Higher education sector. |
| Citizenship | No breakdown by citizenship is available for the Higher education sector. |
3.4.2.2. R&D personnel – Full Time Equivalent (FTE)
| Coverage of years | Calendar year. |
| Function | Only researchers and other supporting staff. Function is estimated using a national categorisation of educational staff and a time-use survey, this may in some cases cause divergences from the definitions in FM15. |
| Qualification | ISCED 1-4, 5-7 and 8. Qualifications obtained abroad are not always available in the register on personnel in at higher education institutions from which this variable is collected. |
| Age | No breakdown by age is available for the Higher education sector. |
| Citizenship | No breakdown by citizenship is available for the Higher education sector. |
3.4.2.3. FTE calculation
R&D full-time equivalents are estimated based on the time-use survey. They are calculated by multiplying the percentage of time spent on R&D activities with the extent of employment as a percentage of full-time employment. The extent of employment is based on administrative data provided by the higher education institutions.
3.4.2.4. R&D personnel - Cross-classification by function and qualification
| Cross-classification | Unit | Frequency |
| R&D personnel by sex, function and qualification. | FTE. | Biennially. |
| R&D personnel by sex, function and FORD. | FTE. | Biennially. |
3.5. Statistical unit
The statistical unit is the institutional unit as defined by Council Regulation (EEC) No 1993/696 of 15 March 1993, if there are deviations please explain.
3.6. Statistical population
See below.
3.6.1. National target population
The target population is the population for which inferences are made. The frame (or frames, as sometimes several frames are used) is a device that permits access to population units. The frame population is the set of population units which can be accessed through the frame and the survey data really refer to this population of institutional units.
The objective of the European R&D statistics is to cover all intramural R&D activities. In line with this objective, the target population for the national R&D survey of the HES Sector should consist of all R&D performing institutional units (including known R&D performers or assumed to perform R&D). In practise however, countries in their R&D surveys might have difficulty in identifying R&D activities at the municipality level.
| Target population when sample/census survey is used for collection of raw data | Target population when administrative data or pre-compiled statistics are used | |
| Definition of the national target population | R&D expenditure survey: The target population is all institutional units located in Sweden and belonging to the Higher education sector (as defined by FM15) who performed R&D during the reference period. Time-use survey: The target population is all positions at Swedish higher education institutions that consist to at least 10 per cent of R&D or direct support to R&D activities. |
Time-use survey: The target population is all positions at Swedish higher education institutions that consist to at least 10 per cent of R&D or direct support to R&D activities. |
| Estimation of the target population size | R&D expenditure survey: 39 higher education institutions. Time-use survey: 59 030 positions. |
Time-use survey: 59 030 positions. |
3.7. Reference area
Not requested. R&D statistics cover national and regional data.
3.8. Coverage - Time
Not requested. See point 3.4.
3.9. Base period
Not requested. The base year for the unit Purchasing Power Standard (PPS) and PPS per inhabitant at constant prices is currently 2005. All calculations of non-basic unit (national currencies) are done by Eurostat.
National currency in thousands, head count and full-time equivalents in number.
2021.
6.1. Institutional Mandate - legal acts and other agreements
See below.
6.1.1. European legislation
| Legal acts / agreements | Since the beginning of 2021, the collection of R&D statistics is based on Commission Implementing Regulation (EU) No 2020/1197 of 30 July 2020 laying down technical specifications and arrangements pursuant to Regulation (EU) 2019/2152 of the European Parliament and of the Council on European business statistics repealing 10 legal acts in the field of business statistics. The Regulation sets the framework for the collection of R&D statistics and specifies the main variables of interest and their breakdowns at predefined level of detail. Commission Implementing Regulation (EU) No 2012/995 concerning the production and development of Community statistics on science and technology was in force until the end of 2020. |
| Nature of the “obligations” of responsible national organisations to produce statistics and report to international organisations | Statistics Sweden is the sole producer of R&D statistics for Sweden. |
6.1.2. National legislation
| Existence of R&D specific statistical legislation | No R&D specific legislation at the national level. |
| Legal acts | All statistical data collection and production of official statistics is regulated by the Official Statistics Act (2001:99) and the Official Statistics Ordinance (2001:100). Confidentiality is regulated by the Public Access to Information and Secrecy Act (2009:400). In addition to this, Statistics Sweden has a mandate to regulate on the obligation to provide raw data and administrative data for business enterprises and government units (including higher education institutions). |
| Obligation of responsible organisations to produce statistics (as derived from the legal acts) | Yes. |
| Right of responsible organisations to collect data – obligation of (natural / legal) persons to provide raw and administrative data (as derived from the legal acts) | Individuals are not obligated to respond, however Statistics Sweden has a right to regulate obligations for business enterprises and government units (including higher education institutions) to provide raw data and administrative data. |
| Obligation of responsible organisations to protect confidential information from disclosure (as derived from the legal acts) | Yes. |
| Rights of access of third organisations / persons to data and statistics (as derived from the legal acts) | Microdata is available for research or statistical purposes. An application must be made in which the research project is described and the use of the microdata specified. The system for researchers to access microdata stored at Statistics Sweden is called Microdata Online Access (MONA). Access is only granted if the confidentiality of data can be ensured by the recieving party. |
| Planned changes of legislation | No planned changes of legislation. |
6.1.3. Standards and manuals
- Frascati Manual 2015, Guidelines for Collecting and Reporting Data on Research and Experimental Development
- European Business Statistics Methodological Manual on R&D Statistics
6.2. Institutional Mandate - data sharing
Not requested.
7.1. Confidentiality - policy
Confidentiality, being one of the process quality components, concerns the privacy of data providers (households, enterprises, administrations and other respondents), the confidentiality of the information they provide and the extent of its use for statistical purposes.
A property of data indicating the extent to which their unauthorised disclosure could be prejudicial or harmful to the interest of the source or other relevant parties.
a) Confidentiality protection required by law: The major policy in place to ensure confidentiality and prevent unauthorised disclosure of data that identify a person or economic entity is the Public Access to Information and Secrecy Act (2009:400). There are also specific conditions concerning the confidentiality of official statistics in the Official Statistics Act (2001:99).
b) Confidentiality commitments of survey staff: Statistics Sweden has a confidentiality policy to which all survey staff must adhere. It contains guidance on the practical application of the legal acts stated above.
Annexes:
Statistics Sweden's confidentiality policy (available in Swedish only)
7.2. Confidentiality - data treatment
For aggregate outputs, primary cell suppression is used as a general rule to ensure no confidential information is disclosed. To ensure that the information cannot be calculated using data in other cells, secondary cell suppression is used. For R&D statistics concerning the Higher education sector this applies to all R&D personnel statistics. For statistics on R&D expenditure, microdata is made publicly available. This is because data on government agencies should be publicly available as per the Public Access to Information and Secrecy Act (2009:400). Private higher education institutions must give Statistics Sweden their permission before microdata can be disclosed.
Any disclosure of microdata from the time-use survey must be tried. It can be disclosed only for research or statistical purposes and only to such entities that are deemed able to ensure confidentiality protection of the data.
8.1. Release calendar
The release policy and the release calendar are publicly available at Statistics Sweden's website.
8.2. Release calendar access
The publication calendar is available on Statistics Sweden's website.
Annexes:
Release calendar
8.3. Release policy - user access
Statistics Sweden's release policy states that all statistics must be made available to all users equally and at the same time. Statistics are always released at 8.00 am on weekdays. Users are also informed of the availability of new statistics by news releases on Statistics Sweden's website. It is possible for users to subscribe to get e-mail notifications when new statistics within a certain subject area are released. Statistics are released by being made available in the statistical database. The release policy is available on Statistics Sweden's website.
Annexes:
Release calendar
Annually.
10.1. Dissemination format - News release
See below.
10.1.1. Availability of the releases
| Availability (Y/N)1 | Content, format, links, ... | |
| Regular releases | Y. | The statistical database is updated and a news release is published on Statistics Sweden's website in October. This is followed by online articles on R&D in the Higher education sector. All content is made publicly available, free of charge. |
| Ad-hoc releases | N. |
1) Y - Yes, N – No
10.2. Dissemination format - Publications
See below.
10.2.1. Availability of means of dissemination
| Means of dissemination | Availability (Y/N)1 | Content, format, links, ... |
| General publication/article (paper, online) |
Y. | The general publication on R&D in Sweden consists of statistical database tables and a news release. The variables reported in the database tables are R&D expenditure and R&D personnel (both as headcount and full-time equivalents). Intramural R&D expenditures are reported by region, type of cost, source of funds, while extramural R&D expenditure are reported on by recipient. Statistics on R&D personnel are broken down by sex, function, type of personnel and region. All publications are made available online only. |
| Specific paper publication (e.g. sectoral provided to enterprises) (paper, online) |
Y. | Details on all publications are available on Statistics Sweden's website: Research and development in Sweden (scb.se). Brief descriptions of the contents are available in English. |
1) Y – Yes, N - No
Annexes:
Statistical database, R&D in Sweden
10.3. Dissemination format - online database
An online statistical database is available on Statistics Sweden's website (see link in Annex). During 2022, the R&D tables in the database were accessed 3 431 times.
Annexes:
Statistical database, R&D in Sweden
10.3.1. Data tables - consultations
Not requested.
10.4. Dissemination format - microdata access
See below.
10.4.1. Provisions affecting the access
| Access rights to the information | Microdata is available for research or statistical purposes. An application must be made in which the research project is described and the use of the microdata specified. The system for researchers to access microdata stored at Statistics Sweden is called Microdata Online Access (MONA). Access is only granted if the confidentiality of data can be ensured by the recieving party. |
| Access cost policy | Statistics Sweden applies the principle of full cost coverage, i.e. the charge covers the actual cost of processing and producing the microdata requested. |
| Micro-data anonymisation rules | All microdata is anonymised. Statistics Sweden can use a common anonymisation key when microdata from several sources is requested at the same time. |
10.5. Dissemination format - other
See below.
10.5.1. Metadata - consultations
Not requested.
10.5.2. Availability of other dissemination means
| Dissemination means | Availability (Y/N)1 | Micro-data / Aggregate figures | Comments |
| Internet: main results available on the national statistical authority’s website | Y. | Both microdata and aggregate figures. | Data are available in the online statistical database on Statistic Sweden’s website. Microdata are only available in R&D expenditure in the Higher education sector. Other variables are available as aggregate figures for confidentiality reasons. |
| Data prepared for individual ad hoc requests | Y. | Both microdata and aggregate figures. | Access to microdata is only granted for research or statistical purposes. All ad hoc requests are priced at full cost coverage. |
| Other | N. |
1) Y – Yes, N - No
10.6. Documentation on methodology
The main documentation on methodology is titled Statistikens framställning (translates to Statistical production) which is updated when new statistics are published. There is a common document covering all sectors for the R&D statistics in which the specific methodology for each sector is described. This documentation is only available in Swedish.
Annexes:
Methodology documentation (available in Swedish only)
10.6.1. Metadata completeness - rate
Not requested.
10.7. Quality management - documentation
See below.
10.7.1. Documentation and users’ requests
| Type(s) of data accompanying information available (metadata, graphs, quality reports, etc.) | Statistical data is always accompanied by a quality report and a methodolgy report. These reports are available online on Statistics Sweden's website and follows a common standard for all official statistics in Sweden. Statistical database tables also contain footnotes in case there is important information about the data that users need to be aware of when using the data. |
| Request on further clarification, most problematic issues | Few users provide feedback on clarity. One issue that has been raised, however, is the difficulty in understanding the differences between R&D statitics concerning the Higher education sector and other statistics on higher education provided by the Swedish Higher Education Authority. |
| Measure to increase clarity | Statistics Sweden works continuosly with improving the clarity in the documentation. |
| Impression of users on the clarity of the accompanying information to the data | The overall impression of users is that clarity is good. |
11.1. Quality assurance
The quality management process at Statistics Sweden is described in a Quality policy. There is also a handbook on quality in official statistics which provides guidance concerning quality management and definitions and guidance on the quality criteria. The following quality criteria for official statistics are regulated by the Official Statistics Act (2001:99) and are the same as are reported in this document:
- Relevance
- Accuracy
- Timeliness
- Punctuality
- Availability and clarity
- Comparability
- Coherence
The framework for quality assurance set out in the Quality policy is a cyclic process with four steps. First is understanding legal requirements and user needs. Second is ensured processes. The third step is evaluation and analysis followed by improvement and development as the fourth step. The first step requires a good dialog with users of the statistics. One forum for such dialog is the User Council for R&D statistics. The second step is based on standardised, efficient, and secure processes which are ensured partly by automatization and digitalisation, partly by following the standardised methods, tools and processes set up for statistical production and found in Statistikproduktionsstödet (translates to the Statistical Production Guide). The third step means that the production processes continuously need to be evaluated. One way in which this done is by a yearly survey to all producers of official statics in which they evaluate the quality of the statistics produced or published during the year. Based on the results of the evaluations, decisions are made concerning which improvement and development activities are to be prioritised over the coming period, constituting the fourth and final step before the process begins again at the first step.
11.2. Quality management - assessment
The quality of the statistics is assessed regularly, and the R&D statistics meet the quality requirements. Measurement error is considered the most important source of error in the statistics as a result of the relatively complex concepts involved in R&D statistics and that respondents are required to report on. Yet, the quality is considered appropriate in relation to such legal requirements and user needs as have been identified. For the time-use survey, object non-response is also a mounting challange. Statistics Sweden has faced declining response rates for several years which has a negative effect on the quality of the statistics. For the survey on R&D expenditure however, there are no non-response issues. As it is a census there are neither any issues concerning sampling or coverage. Results are presented in more detail in sections 12 to 15 below.
12.1. Relevance - User Needs
See below.
12.1.1. Needs at national level
| Users’ class1 | Description of users | Users’ needs |
| 1 - Institutions | Among the most important users in this class are the European Commission (through Eurostat), the Ministry of Enterprise and Innovation, the Ministry of Education, the Swedish Higher Education Authority and the Swedish Research Council. Regional and local government, as well as higher education institutions are also users of R&D statistics concerning the Higher education sector. | Comparability over time is one of the most important requirements. The Ministry of Education in particular also require a high degree of timeliness as the statistics are used when formulating the state budget. Comparability between R&D statistics concerning the Higher education sector and other statistics regarding higher education is also required by users. This requires coherence and coordination in the use of classifications between Statistics Sweden and the Swedish Higher Education Authority. For the European Commission, comparability between member states is a priority. Some of the most important breakdowns of the statistics required by these users are: - Field of Research and Development (FORD) |
| 2 - Social actors | Trade associations such as Teknikföretagen (a trade association for the Swedish industry sector) and the Swedish Association of Local Authorities and Regions are identified as some of the most important users in this class. | Comparability between groups is an important quality aspect for these users. They tend to have specific interests and want to be able to compare the development in those industries or sectors that they represent with other industries or sectors. Breakdown by region is the most requested by this group of users. |
| 3 - Media | Trade media is considered to be the most important users in this class. | Timeliness and accessibility are important aspects to this group of users. Press releases containing citations from experts on the statistics at the time of publication is one measure taken to better accommodate the needs of the news media. |
| 4 - Researchers and students | Researchers and students at higher education institutions and research institutes such as RISE and the Research Institute of Industrial Economics are the most important users in this class. | Accuracy is an important quality aspect for this user class as well as comparability both over time, between groups and with other statistics. This is also a group of users who request detailed data and often microdata. Access to microdata and the possibility to make ad-hoc requests for data on other breakdowns than those that are openly available is therefore important to this group. |
| 5 - Enterprises or businesses | No mapping has been done to identify the most important users among enterprises and businesses. | |
| 6 - Other | Other important users are the public. | Clarity is among the most important aspects for the general public. This user class cannot be expected to have a detailed knowledge about the concepts and definitions used in the R&D statistics which makes clarity in the documentation and in other publications important. |
1) Users' class codification
1- Institutions:
• European level: Commission (DGs, Secretariat General), Council, European Parliament, ECB, other European agencies etc.
• in Member States, at the national or regional level: Ministries of Economy or Finance, other ministries (for sectoral comparisons), National Statistical Institutes and other statistical agencies (norms, training, etc.), and
• International organisations: OECD, UN, IMF, ILO, etc.
2- Social actors: Employers’ associations, trade unions, lobbies, among others, at the European, national or regional level.
3- Media: International or regional media – specialized or for the general public – interested both in figures and analyses or comments. The media are the main channels of statistics to the general public.
4- Researchers and students (Researchers and students need statistics, analyses, ad hoc services, access to specific data.)
5- Enterprises or businesses (Either for their own market analysis, their marketing strategy (large enterprises) or because they offer consultancy services)
6- Other (User class defined for national purposes, different from the previous classes.)
12.2. Relevance - User Satisfaction
The views and opinions from users are primarily collected through the User council for statistics on research and development which meets twice yearly. The user council consists of representatives from the Ministry of Enterprise, the Ministry of Education, the Swedish Higher Education Authority, the Swedish Research Council, Vinnova (Sweden's innovation agency), RISE, the Swedish Association of Local Authorities and Regions, the Swedish Agency for Growth Policy Analysis, the Research Institute of Industrial Economics, Lund University and Teknikföretagen (the trade association for the Swedish industry sector). Minutes from the last meeting of the user council are available in Swedish at Statistics Sweden's website.
12.2.1. National Surveys and feedback
| Conduction of a user satisfaction survey or any other type of monitoring user satisfaction | No user satisfaction survey has been conducted. User satisfaction is mainly monitored through user councils. |
| User satisfaction survey specific for R&D statistics | No specific user satisfaction survey for R&D statistics has been conducted. There is, however, a specific user council for R&D statistics. |
| Short description of the feedback received | Overall user satisfacation is high. One issue that has recently been discussed is that comparability over time is very important, espacially in the light of the upcoming implementation of the statistical unit "enterprise". |
12.3. Completeness
See below.
12.3.1. Data completeness - rate
62 percent (100 percent for mandatory variables and 42 percent for voluntary variables).
12.3.2. Completeness - overview
Completeness is assessed via comparison of the data delivered against the requirements of Commission Implementing Regulation (EU) No 2020/1197. The Regulation (EU) stipulates periodicity of variables that should be provided, breakdowns and if they should be provided mandatory or on voluntary basis.
| 5 (Very Good) |
4 (Good) |
3 (Satisfactory) |
2 (Poor) |
1 (Very poor) |
Reasons for missing cells |
|
| Preliminary variables | X | |||||
| Obligatory data on R&D expenditure | X | |||||
| Optional data on R&D expenditure | X | Due to limited resources it has not been possible to assemble data on any of the optional data on R&D expenditure added in the Commission Implementing Regulation (EU) No 2020/1197 of 30 July 2020. | ||||
| Obligatory data on R&D personnel | X | |||||
| Optional data on R&D personnel | X | |||||
| Regional data on R&D expenditure and R&D personnel | X |
Criteria:
A) Obligatory data. Only 'Very Good' = 100%, Poor' >95%; 'Very Poor' <100% apply.
B) Optional data. 'Very Good' = 100%; 'Good' = >75%; 'Satisfactory' 50 to 75%%; 'Poor' 25 to 50%; 'Very Poor' 0 to 25%.
12.3.3. Data availability
See below.
12.3.3.1. Data availability - R&D Expenditure
| Availability1 | Frequency of data collection | Gap years – years with missing data | Modifications - Description | Modifications - Year of introduction | Modifications - Reasons | |
| Source of funds | 1981 | Biennially. | Even years since start year. | |||
| Type of R&D | 2021 | Biennially. | ||||
| Type of costs | 1981 | Biennially. | Even years since start year. | |||
| Socioeconomic objective | N. | |||||
| Region | 2003 | Biennially. | Even years since start year. | |||
| FORD | 1981 | Biennially. | Even years since start year. | The national nomenclature for classification according to field of research was revised to better follow the FORD classification. | 2011 | Improving international comparability. |
| Type of institution | N. |
1) Y-start year, N – data not available
12.3.3.2. Data availability - R&D Personnel (HC)
| Availability1 | Frequency of data collection | Gap years – years with missing data | Modifications - Description | Modifications - Year of introduction | Modifications - Reasons | |
| Sex | 1999 | Biennially. | Even years since start year. | |||
| Function | 1997 | Biennially. | Even years since start year. | |||
| Qualification | 2017 | Biennially. | Even years since start year. | |||
| Age | N. | |||||
| Citizenship | N. | |||||
| Region | 1993 | Biennially. | Even years since start year. | |||
| FORD | 1999 | Biennially. | Even years since start year. | The national nomenclature for classification according to field of research was revised to better follow the FORD classification. | 2011 | Improving international comparability |
| Type of institution | N. |
1) Y-start year, N – data not available
12.3.3.3. Data availability - R&D Personnel (FTE)
| Availability1 | Frequency of data collection | Gap years – years with missing data | Modifications - Description | Modifications - Year of introduction | Modifications - Reasons | |
| Sex | 1997 | Biennially. | Even years since start year. | |||
| Function | 1981 | Annually. | Even years between 1982-2002. | |||
| Qualification | 1995 | Biennially. | Even years since start year. | |||
| Age | N. | |||||
| Citizenship | N. | |||||
| Region | 1993 | Biennially. | Even years since start year. | |||
| FORD | 1981 | Biennially. | Even years since start year. | The national nomenclature for classification according to field of research was revised to better follow the FORD classification. | 2011 | Improving international comparability. |
| Type of institution | N. |
1) Y-start year, N – data not available
12.3.3.4. Data availability - other
| Additional dimension/variable available at national level1) | Availability2 | Frequency of data collection | Breakdown variables |
Combinations of breakdown variables | Level of detail |
1) This question is optional. It refers to variables and breakdowns NOT asked by the Commission Implementing Regulation (EU) No 2020/1197 (neither as 'optional').
2) Y-start year
13.1. Accuracy - overall
Accuracy in the statistical sense denotes the closeness of computations or estimates to the exact or true values. Statistics are not equal with the true values because of variability (the statistics change from implementation to implementation of the survey due to random effects) and bias (the average of the possible values of the statistics from implementation to implementation is not equal to the true value due to systematic effects).
Several types of statistical errors occur during the survey process. The following typology of errors has been adopted:
1. Sampling errors. These only affect sample surveys. They are due to the fact that only a subset of the population, usually randomly selected, is enumerated.
2. Non-sampling errors. Non-sampling errors affect sample surveys and complete enumerations alike and comprise:
a) Coverage errors,
b) Measurement errors,
c) Non response errors and
d) Processing errors.
Model assumption errors should be treated under the heading of the respective error they are trying to reduce.
13.1.1. Accuracy - Overall by 'Types of Error'
| Sampling errors | Non-sampling errors1) | Model-assumption Errors1) | Perceived direction of the error2) | ||||
| Coverage errors | Measurement errors | Processing errors | Non response errors | ||||
| Total intramural R&D expenditure | - | - | 1 | 3 | - | 2 | + |
| Total R&D personnel in FTE | 3 | 2 | 5 | 1 | 4 | +/- | |
| Researchers in FTE | 3 | 2 | 5 | 1 | 4 | +/- | |
1) Ranking of the type(s) of errors that result in over/under-estimation, from the most important source of error (1) to the least important source of error (5). In the event that errors of a particular type do not exist, is used the sign ‘-‘.
2) The perceived direction of the ‘overall’ error using the signs “+” for over estimation, “-” for under estimation and “+/-” when assumption of the direction of the error cannot be made for R&D.
13.1.2. Assessment of the accuracy with regard to the main indicators
| Indicators | 5 (Very Good)1 |
4 (Good)2 |
3 (Satisfactory)3 |
2 (Poor)4 |
1 (Very poor)5 |
| Total intramural R&D expenditure | X | ||||
| Total R&D personnel in FTE | X | ||||
| Researchers in FTE | X |
1) 'Very Good' = High level of coverage (annual rate of substitution in the target population lower than 5%). High average rates of response (>80%) in census and sample surveys. Full data consistency with reference to totals and relationships between variables in the dataset sent to Eurostat.
2) 'Good' = In the event that at least one out of the three criteria above described would not be fully met.
3) 'Satisfactory' = In the event that the average rate of response would be lower than 60% even by meeting the two remaining criteria.
4) 'Poor' = In the event that the average rate of response would be lower than 60% and at least one of the two remaining criteria would not be met.
5) 'Very Poor' = If all the three criteria are not met.
13.2. Sampling error
That part of the difference between a population value and an estimate thereof, derived from a random sample, which is due to the fact that only a subset of the population is enumerated.
13.2.1. Sampling error - indicators
The main indicator used to measure sampling errors is the coefficient of variation (CV).
Definition of coefficient of variation:
CV= (Square root of the estimate of the sampling variance) / (Estimated value)
13.2.1.1. Variance Estimation Method
The variance is estimated using Horvitz-Thompson estimation as follows:
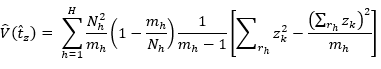
Where;
tz is an estimated variable,
h is an index for strata (h = 1, 2, 3,..., H),
k is an index for observations (k = 1, 2, 3,..., K),
zk is the observed value for the observation k,
Nh is the number of objects in stratum h,
mh is the number of responses in stratum h in the sample, and
rh is the number of responses in stratum h
13.2.1.2. Confidence interval for R&D expenditure by source of funds
| Source of funds | R&D expenditure |
| Business enterprise | No variation because R&D expenditure is collected by a census survey. |
| Government | No variation because R&D expenditure is collected by a census survey. |
| Higher education | No variation because R&D expenditure is collected by a census survey. |
| Private non-profit | No variation because R&D expenditure is collected by a census survey. |
| Rest of the world | No variation because R&D expenditure is collected by a census survey. |
| Total | No variation because R&D expenditure is collected by a census survey. |
13.2.1.3. Confidence interval for R&D personnel by occupation and qualification
| R&D personnel (FTE) | ||
| Function | Researchers | 0.020 |
| Technicians | Not applicable, breakdown into technicians and other support staff is not collected. | |
| Other support staff | Not applicable, breakdown into technicians and other support staff is not collected. | |
| Qualification | ISCED 8 | 0.034 |
| ISCED 5-7 | 0.046 | |
| ISCED 4 and below | 0.523 |
13.3. Non-sampling error
Non-sampling errors occur in all phases of a survey. They add to the sampling errors (if present) and contribute to decreasing overall accuracy. It is important to assess their relative weight in the total error and devote appropriate resources for their control and assessment.
13.3.1. Coverage error
Coverage errors are due to divergences between the target population and the frame population. The frame population is the set of target population members that has a chance to be selected into the survey sample. It is a listing of all items in the population from which the sample is drawn that contains contact details as well as sufficient information to perform stratification and sampling.
a) Description/assessment of coverage errors:
R&D expenditure survey: There are no coverage errors in this survey. The population consists of all Swedish universities and colleges providing tertiary level education. All higher education institutions that receive funding for research and doctoral education are included in the census survey on R&D expenditure.
Time-use survey: External R&D personnel is not included in the frame for the time use survey. The register used to create the frame only covers persons employed by a Swedish higher education institution which means external personnel is not included. Over-coverage also occurs due to difficulties in excluding non R&D personnel from the frame.
b) Measures taken to reduce their effect:
The issue of under-coverage in the time-use survey is amended by estimating R&D performed by external personnel using coefficients from the time-use survey and administrative data on doctoral students that are not employed by the higher education institution where they perform their research.
To mitigate the issues of over-coverage a small survey conducted among the higher education institutions where they are asked to identify which professions among those belonging to the technical or administrative staff and where information on field of research and development is missing for a majority of the individuals in the register are relevant to include in the time-use survey.
13.3.1.1. Over-coverage - rate
R&D expenditure survey: 0 percent.
Time-use survey: 3 percent.
13.3.1.2. Common units - proportion
Not requested.
13.3.2. Measurement error
Measurement errors occur during data collection and generate bias by recording values different than the true ones (e.g. difficulty to distinguish intramural from extramural R&D Expenditure). The survey questionnaire used for data collection may have led to the recording of wrong values, or there may be respondent or interviewer bias.
a) Description/assessment of measurement errors:
Measurement errors are deemed to be the most important source of error for the Higher education sector. R&D is a complex concept which may lead to misinterpretation by respondents. Lack of information on the allocation of funds within the organisation can also cause errors of this kind.
b) Measures taken to reduce their effect:
The questionnaire is tested at regular intervals by an expert on questionnaire construction and the instructions to fill in the questionnaire are reviewed before each survey year. The online questionnaire also includes checks to make sure that responses are logically consistent. For the survey on R&D expenditure, checks are also conducted manually when the units have responded to the survey. If any suspect values are found, the respondent is contacted to either confirm or revise their response.
13.3.3. Non response error
Non-response occurs when a survey failed to collect data on all survey variables from all the population units designated for data collection in a sample or complete enumeration.
There are two elements of non-response:
-Unit non-response which occurs when no data (or so little as to be unusable) are collected on a designated population unit.
-Item non-response which occurs when data only on some, but not all survey variables are collected on a designated population unit.
The extent of response (and accordingly of non response) is also measured with response rates.
13.3.3.1. Unit non-response - rate
The main interest is to judge if the response from the target population was satisfactory by computing the un-weighted response rate.
Definition: Eligible are the survey units which indeed belong to the target population. Frame imperfections always leave the possibility that some units may not belong to the target population. Moreover, when there is no contact with certain units and no other way to establish their eligibility they are characterised as ‘unknown eligibility units’.
Un-weighted Unit Non- Response Rate = 1 - (Number of units with a response) / (Total number of eligible and unknown eligibility units in the survey)
13.3.3.1.1. Un-weighted unit non-response rate
| Number of units with a response in the survey | Total number of units in the survey | Unit non-response rate (Un-weighted) |
| R&D expenditure survey: 39 Time-use survey: 5 044 |
R&D expenditure survey: 39 Time-use survey: 13 068 |
R&D expenditure survey: 0 percent Time-use survey: 61 percent |
13.3.3.2. Item non-response - rate
Definition:
Un-weighted Item Non-Response Rate (%) = 1-(Number of units with a response for the item) / (Total number of eligible , for the item, units in the sample) * 100
13.3.3.2.1. Un-weighted item non-response rate
| R&D variable/breakdown | Item non-response rate (un-weighted) (%) | Comments |
| R&D expenditure | 0 % | |
| R&D personnel (FTE) | 62 % | |
| Researchers (FTE) | 62 % |
13.3.3.3. Measures to increase response rate
R&D expenditure survey: Two reminders were sent out via email.
Time-use survey: Four reminders were sent out by mail. The second reminder also enclosed the survey on paper in order to increase response rates among respondents that do not wish to respond online.
13.3.4. Processing error
Between data collection and the beginning of statistical analysis, data must undergo a certain processing: coding, data entry, data editing, imputation, etc. Errors introduced at these stages are called processing errors. Data editing identifies inconsistencies or errors in the data.
13.3.4.1. Identification of the main processing errors
| Data entry method applied | R&D expenditure survey: Responses through electronic submission of an Excel form. Time-use survey: Responses through electronic online questionnaires and scanning. |
| Estimates of data entry errors | No error estimates available. |
| Variables for which coding was performed | Not applicable, no coding performed for the Higher education sector. |
| Estimates of coding errors | Not applicable, no coding performed for the Higher education sector. |
| Editing process and method | Not applicable, data are not edited. |
| Procedure used to correct errors | R&D expenditure survey: If suspected errors are found in the data, respondents are re-contacted to either confirm or revise the data. Time-use survey: Imputation to correct for logical inconsistencies. |
13.3.5. Model assumption error
Not requested.
14.1. Timeliness
Timeliness and punctuality refer to time and dates, but in a different manner: the timeliness of statistics reflects the length of time between their availability and the event or phenomenon they describe. Punctuality refers to the time lag between the release date of the data and the target date on which they should have been delivered, with reference to dates announced in the official release calendar.
14.1.1. Time lag - first result
Time lag between the end of reference period and the release date of the results:
Indicator: (Release date of provisional/ first results) - (Date of reference for the data)
a) End of reference period: 2021-12-31
b) Date of first release of national data: 2022-07-14
c) Lag (days): 195
14.1.2. Time lag - final result
a) End of reference period: 2021-12-31
b) Date of first release of national data: 2022-10-27
c) Lag (days): 300
14.2. Punctuality
Punctuality refers to the time lag between the release date of data and the target date on which they were scheduled for release as announced officially.
14.2.1. Punctuality - delivery and publication
Punctuality of time schedule of data release = (Actual date of the data release) - (Scheduled date of the data release)
14.2.1.1. Deadline and date of data transmission
| Transmission of provisional data | Transmission of final data | |
| Legally defined deadline of data transmission (T+_ months) | 10 | 18 |
| Actual date of transmission of the data (T+x months) | 10 | 18 |
| Delay (days) | 0 | 0 |
| Reasoning for delay |
15.1. Comparability - geographical
See below.
15.1.1. Asymmetry for mirror flow statistics - coefficient
Not requested.
15.1.2. General issues of comparability
International comparability is generelly deemed to be good. One issue to be noted concerns external personnel. Due to issues with measurement error and under-coverage error, international comparability is low. For the Higher education sector, the approach to obtaining headcount and full-time equivalent data diverges from the Frascati Manual on the issue of excluding individuals spending less than 0.1 FTE on R&D. This also affects international comparability. However, the contribution of these individuals to the total estimates on HC and FTE is small and thus its effect on international comparability is limited.
15.1.3. Survey Concepts Issues
The following table lists a number of key survey concepts and conceptual issues; it gives reference to the Commission Implementing Regulation (EU) No 2020/1197 or Frascati manual and EBS Methodological Manual on R&D Statistics paragraphs with recommendations about these concepts/issues.
| Concept / Issues | Reference to recommendations | Deviation from recommendations | Comments on national definition / Treatment – deviations from recommendations |
| R&D personnel | FM2015 Chapter 5 (mainly paragraph 5.2). | Yes, deviation concerning the recommendation to exclude individuals spending less than 0.1 FTE on R&D from the R&D personnel. | No exclusion of individuals spending less than 0.1 FTE on R&D. All individuals reporting R&D or direct support to R&D activities are included in the R&D personnel. The contribution to the total estimate of these observations is very small. |
| Researcher | FM2015, § 5.35-5.39. | Yes, deviation from the recommendation to identify researchers based on the nature of their R&D activities. | Researchers are classified based on employment title. There is no way to distinguish if an individual has engaged in R&D or only in direct supprt to R&D activities in the time-use survey. |
| Approach to obtaining Headcount (HC) data | FM2015, § 5.58-5.61 (in combination with Eurostat'EBS Methodological Manual on R&D Statistics). | Yes, deviation concerning the recommendation to exclude individuals spending less than 0.1 FTE on R&D from the R&D personnel. | No exclusion of individuals spending less than 0.1 FTE on R&D. All individuals reporting R&D or direct support to R&D activities are included in the R&D personnel headcount data. The contribution to the total estimate of these observations is very small. |
| Approach to obtaining Full-time equivalence (FTE) data | FM2015, § 5.49-5.57 (in combination with Eurostat's EBS Methodological Manual on R&D Statistics). | Yes, deviation concerning the recommendation to exclude individuals spending less than 0.1 FTE on R&D from the R&D personnel. | No exclusion of individuals spending less than 0.1 FTE on R&D. All individuals reporting R&D or direct support to R&D activities are included in the R&D personnel full-time equivalence data. |
| Reporting data according to formula: Total R&D personnel = Internal R&D personnel + External R&D personnel | FM2015, §5.25 | Yes, deviation from the definition of external R&D personnel. | External R&D personnel is defined as doctoral students funded by a stipend, an educational grant or lacking funding. Doctoral students externally employed by the business enterprise sector and master students are not included in the external R&D personnel. |
| Intramural R&D expenditure | FM2015, Chapter 4 (mainly paragraph 4.2). | No deviations. | |
| Statistical unit | FM2015 §3.70 (in combination with Eurostat's EBS Methodological Manual on R&D Statistics). | No deviations. | |
| Target population | FM2015 §9.6 (in combination with Eurostat's EBS Methodological Manual on R&D Statistics). | No deviations. | |
| Sector coverage | FM2015 §3.67-3.69 (in combination with Eurostat's EBS Methodological Manual on R&D Statistics). | No deviations. | |
| Post-secondary (non university / college) education institutions | FM2015 §9.12 (in combination with Eurostat's EBS Methodological Manual on R&D Statistics). | No deviations. | |
| Hospitals and clinics | FM2015 §9.13-9.17, §9.109-9.112 (in combination with Eurostat's EBS Methodological Manual on R&D Statistics). | No deviations. | |
| Borderline research institutions | FM2015 §9.13-9.17, §9.109-9.112 (in combination with Eurostat's EBS Methodological Manual on R&D Statistics). | No deviations. | |
| Major fields of science and technology coverage and breakdown | Reg. 2020/1197 : Annex 1, Table 18 | No deviations. | |
| Reference period | Reg. 2020/1197 : Annex 1, Table 18 | No deviations. |
15.1.4. Deviations from recommendations
The following table lists a number of key methodological issues, which may affect the international comparability of national R&D statistics. The table gives the references in the Frascati manual, where related recommendations are made. Countries are asked to report on the existence of any deviations from existing recommendations and comment upon.
| Methodological issues | Deviation from recommendations | Comments on national treatment / treatment deviations from recommendations |
| Data collection method | No. | A census survey collecting data on R&D funds from all higher education institutions in Sweden is complemented by a time-use sample survey in order to derive R&D coefficients and collect data on the R&D personnel. |
| Survey questionnaire / data collection form | No. | Direct data collection is conducted by two seperate surveys. Data on R&D expenditure is collected by a web-based questionnaire while the time-use survey uses both a web-based and a paper questionnaire as a measure to mitigate object non-response. The web-based versions of the questionnaires contain checks that help respondents avoid logical inconcistencies and other reporting errors. Questionnaires are also revised by experts on questionnaire design to ensure that instructions are clear and easy to find, that the questions are easy to understand and that they arranged in a logical order. |
| Cooperation with respondents | No. | During the data collection period, respondents can communicate with Statistics Sweden in case they are unable to provide data at the requested date. In such cases, repondents can be allowed a deferment. Communication can also occur in case respondents need further directions on definitions or other issues on how the quetionnaire should be answered. |
| Coverage of external funds | No. | Detailed information on external funds are collected by the Swedish Higher Education Authority and are classified according to FORD in the census survey on R&D expenditure. The methodology follows the recommended principle of performer-based reporting. |
| Distinction between GUF and other sources – Sector considered as source of funds for GUF | No. | The data collected on funding by the Swedish Higher Education Authority distinguishes GUF from other sources of funds. |
| Data processing methods | No. | Data is processed to ensure that it does not contain any logical inconsistencies. In the census on R&D expenditure, issues with potential logical inconsistency are handled by contacting the repondents to either confirm or correct the data. In the time-use survey, data is edited according to predetermined rules in case repondents have reported in a logically inconsistent manner. |
| Treatment of non-response | No. | The census on R&D expenditure has no non-response. In the time-use survey, design weights are adjusted to account for non-response. This method is based on the assumption that units within the same stratum share similar characteristics. No imputation is used for either object non-response or item non-response. |
| Variance estimation | No. | Taylor Series Variance Estimation is used for the sample survey on R&D personnel. |
| Method of deriving R&D coefficients | No. | R&D coefficients are derived from time-use data. See section 18.5.3 for a description of the method. |
| Quality of R&D coefficients | No. | R&D coefficients are updated biennially. |
| Data compilation of final and preliminary data | No. | Both preliminary and final data are compiled on the main indicators annually. |
15.2. Comparability - over time
See below.
15.2.1. Length of comparable time series
See below.
15.2.2. Breaks in time series
| Length of comparable time series | Break years1 | Nature of the breaks | |
| R&D personnel (HC) | 2005-2021 | 2021, 2017, 2005, 2001, 1993 | 2021: The Swedish Institute of Space Physics is reclassified as belonging to the Government sector. 2017: Methodological change concerning the calculation of R&D personnel as headcount. The new method utilises both administrative data on employment category and survey data from the time-use survey to identify R&D personnel. The previous method was based only on administrative data which meant that individuals were included in the headcount even if they had not engaged in R&D according to their responses in the time-use survey. 2005: Change in data collection method. Introduction of a time-use survey replacing the previous survey that collected data on R&D personnel from the faculties. External R&D personnel is not included in the total R&D personnel. 2001: External R&D personnel, i.e. researchers and teachers not employed by the higher education institution are included in total R&D personnel. 1993: R&D personnel employed in hospitals administered by local government were not included. However, doctoral students performing R&D funded by educational grants were included for the first time. |
| Function | 2019-2021 | 2019 | 2019: A new classification for employment category is implemented. This classification is used in order to classify individuals according to function. |
| Qualification | |||
| R&D personnel (FTE) | 2005-2021 | 2021, 2017, 2005, 2001, 1993 | 2021: The Swedish Institute of Space Physics is reclassified as belonging to the Government sector. 2005: Change in data collection method. Introduction of a time-use survey replacing the previous survey that collected data on R&D personnel from the faculties. External R&D personnel is not included in the total R&D personnel. 2001: External R&D personnel, i.e. researchers and teachers not employed by the higher education institution are included in total R&D personnel. 1993: R&D personnel employed in hospitals administered by local government were not included. However, doctoral students performing R&D funded by educational grants were included for the first time. |
| Function | 2019-2021 | 2019 | 2019: A new classification for employment category is implemented. This classification is used in order to classify individuals according to function. |
| Qualification | |||
| R&D expenditure | 1997-2021 | 2021, 2019, 2005, 1995 | 2021: The Swedish Institute of Space Physics is reclassified as belonging to the Government sector. 2021: A new method for excluding costs for doctoral education is implemented. As recommended in FM15, data from the time-use survey is used to calculate R&D coefficients. 2019: Prior to reference year 2019 R&D financed by the Swedish ALF funds (the "Agreement on Medical Training and Research") were included in HES and excluded from GOV. As of 2019 R&D financed by ALF funds are included in GOV and therefore excluded from HES, i.e. the opposite relationship. The main reason for this change is that R&D financed by ALF funds should be represented in the sector where the funding is consumed, which is within the regional government sub-sector that is a part of GOV. The change results in a large increase in total GOVERD, but also a decrease in total HERD. 2005: A new method for excluding costs for doctoral education is implemented. Administrative data on salaries, over head costs and other relatade costs are used to estimate the costs of education within the doctral programe. 1995: Capital expenditure for R&D in higher education is excluded; consequently, all 1995 data concerning HERD are underestimated and not comparable to corresponding data for previous or following years. |
| Source of funds | 2019, 1985 | 2019: ALF funds are excluded from general university funds (GUF). The main reason for this change is that R&D financed by ALF funds should be represented in the sector where the funding is consumed, which is within the regional sector that is a part of GOV. The change results in a large increase in total GOVERD, but also a decrease in total HERD. 1985: The University of Agricultural Sciences' own funds have been estimated at a higher level than before as a result of improved information from the accounting system. |
|
| Type of costs | 1997-2021 | 1995 | 1995: Capital costs were not reported for the reference year.2021: Data collection on R&D expenditure by type of R&D is conducted for the first time. |
| Type of R&D | 2021: Data collection on R&D expenditure by type of R&D is conducted for the first time. | ||
| Other | 2015, 2011 | 2015: Modified methodology for the sample design for the time-use survey. A pre-survey to the higher education institutions was introduced to decrease the number surveys to non-R&D personnel. 2015: Modified calculation of salaries for the exclusion of education. 2011: R&D expenditure is collected accordning to two classifications of field of science. From 2013 and onwards only the new classification will be used. This corresponds to the FORD classification of FM15. |
1) Breaks years are years for which data are not fully comparable to the previous period.
15.2.3. Collection of data in the even years
For even reference years data is not collected using surveys. Funding for R&D in the Higher education sector is collected from the Swedish Higher Education Authority and R&D expenditure is estimated using R&D coefficients for the previous odd reference year. To estimate R&D personnel, data from the Registry of the Employees in Higher Education is used to update the population. This information, combined with data from the previous years survey, is used to estimate R&D personnel.
15.3. Coherence - cross domain
This part deals with any national coherence assessments which may have been undertaken. It reports results for variables which are the same or relevant to R&D statistics, from other national surveys and / or administrative sources and explains and comments on their degree of agreement with R&D statistics. The education statistics (UNESCO/OECD/Eurostat (UOE)) include R&D expenditure in tertiary educational institutions and follow the recommendations of the Frascati manual regarding the definition of R&D expenditure. Due to the differences in the coverage some differences in the two datasets (UOE questionnaire and the R&D HES surveys) are expected. However, there is a need to ensure that a harmonised approach is used for compiling data in the two domains. The two statistical domains should aim for a consistent use of R&D coefficients for splitting teaching and research time.
15.3.1. Coherence - sub annual and annual statistics
Not requested.
15.3.2. Coherence - National Accounts
Not available, no analysis of coherence has been conducted.
15.3.3. National Coherence Assessments
| Variable name | R&D Statistics - Variable Value | Other national statistics - Variable value | Other national statistics - Source | Difference in values (of R&D statistics) | Explanation of / comments on difference |
15.3.4. Coherence – Education statistics
The main difference between R&D statistics and education statistics is that the population differs. R&D statistics include research institutes whose R&D is controlled by HEIs while the education statistics do not. R&D expenditure reported in the R&D statistics and the education statistics may, therefore, vary even though they are based on the same data.
15.4. Coherence - internal
See below.
15.4.1. Comparison between preliminary and final data
This part compares key R&D variables as preliminary and final data.
| Total R&D expenditure – HERD (in 1000 of national currency) | Total R&D personnel (in FTEs) | Total number of researchers (in FTEs) | |
| Preliminary data (delivered at T+10) | 42 981 | 20 992 | 18 284 |
| Final data (delivered T+18) | 42 981 | 20 992 | 18 284 |
| Difference (of final data) | 0 | 0 | 0 |
15.4.2. Consistency between R&D personnel and expenditure
| Average remuneration (cost¨in national currency) | |
| Consistency between FTEs of internal R&D personnel and R&D labour costs (1) | Not applicable, R&D labour costs are not collected for the Higher education sector. |
| Consistency between FTEs of external R&D personnel and other current costs for external R&D personnel (2) | Not applicable, other current costs for external R&D personnel is not collected for the Higher education sector. |
(1) Calculate the average remuneration (cost) of individuals belonging to the internal R&D personnel, excluding those who are only formally ‘employees’ (university students, grant holders, etc.).
(2) Calculate the average remuneration (cost) of individuals belonging to the external R&D personnel (FTEs/other current R&D costs for external R&D personnel).
The assessment of costs associated with a statistical product is a rather complicated task since there must exist a mechanism for appointing portions of shared costs (for instance shared IT resources and dissemination channels) and overheads (office space, utility bills etc). The assessment must become detailed and clear enough so that international comparisons among agencies of different structures are feasible.
16.1. Costs summary
| Costs for the statistical authority (in national currency) | % sub-contracted1) | |
| Staff costs | No sub-contracting. | |
| Data collection costs | No sub-contracting. | |
| Other costs | No sub-contracting. | |
| Total costs | No sub-contracting. | |
| Comments on costs | ||
| Not available, costs are not reported on such detailed level. | ||
1) The shares of the figures given in the first column that are accounted for by payments to private firms or other Government agencies.
16.2. Components of burden and description of how these estimates were reached
| Value | Computation method | |
| Number of Respondents (R) | R&D expenditure survey: 39 respondents. Time-use survey: 5 044 respondents. |
|
| Average Time required to complete the questionnaire in hours (T)1 | Not available, information on the time required to complete thre questionnaire is not collected either for the time-use survey or the census survey on R&D expenditure. | |
| Average hourly cost (in national currency) of a respondent (C) | R&D expenditure survey: SEK 753 Time-use survey: Not available, the avereage hourly cost of a respondent is not computed for individuals. |
|
| Total cost | Not available, information on the time required to complete thre questionnaire is not collected either for the time-use survey or the census survey on R&D expenditure. |
1) T = the time required to provide the information, including time spent assembling information prior to completing a form or taking part in interview and the time taken up by any subsequent contacts after receipt of the questionnaire (‘Re-contact time’)
17.1. Data revision - policy
Not requested.
17.2. Data revision - practice
Not requested.
17.2.1. Data revision - average size
Not requested.
18.1. Source data
Several separate activities are used for the collection of raw data or pre-compiled administrative data and statistics related to R&D. For simplicity, we call them surveys irrespective of whether they are sample surveys, censuses, collections of administrative data/pre-compiled statistics. This section presents the names of the surveys by sector of performance as well as methodological information for each survey. Depending on the type of survey and sector of performance, only the sections corresponding to that survey and sector are filled in.
18.1.1. Data source – general information
| Survey name | R&D in the Higher education sector. |
| Type of survey | R&D expenditure survey: Census survey. Time-use survey: Sample survey. |
| Combination of sample survey and census data | The data collection on R&D in the Higher education sector is divided into two surveys. The survey on R&D expenditure is a census survey. The time-use survey (to estimate R&D personnel) is a sample survey. Data on the share of working hours spent on R&D activities collected in the time-use survey are used to estimate R&D coefficients. These R&D coefficients are then applied to the economic data collected in the census survey in order to exclude costs of education within the doctoral programme. Data collected in the time-use survey is complemented by administrative data from a register on personnel in the Higher education sector in order to enable breakdown by FORD, function and qualification. |
| Combination of dedicated R&D and other survey(s) | Not applicable. The dedicated R&D surveys are not combined with other surveys. |
| Sub-population A (covered by sampling) | R&D expenditure survey: Not applicable, no sampling used in this survey. Time-use survey: No sub-population used, the population is covered by sampling. |
| Sub-population B (covered by census) | R&D expenditure survey: No sub-population used, the population is covered by the census. Time-use survey: Not applicable, the population is covered by sampling. |
| Variables the survey contributes to | R&D expenditure by source of funds, FORD, type of costs and type of R&D. R&D personnel by sex, region, function, qualification and employment category. |
| Survey timetable-most recent implementation | Both surveys were sent out in April, data collection ended on 31 August and data were published on 27 October. |
18.1.2. Sample/census survey information
| Stage 1 | Stage 2 | Stage 3 | |
| Sampling unit | R&D expenditure survey: Legal units categorised as higher education institutions. Time-use survey: Position at a higher education institution. |
||
| Stratification variables (if any - for sample surveys only) | Time-use survey: sex, employment category, FORD, higher education institution. | ||
| Stratification variable classes | Employment category: professors, postdoctoral researchers, associate senior lecturers and postdoctoral research fellows, senior lecturers, lecturers, other research and teaching staff, doctoral students, and administrative and technical personnel. Higher education institution: Blekinge Institute of Technology, Chalmers University of Technology, Ersta Sköndal Bräcke University College, Swedish National Defence College, University of Gothenburg, Stockholm School of Economics, Dalarna Univeristy, University of Borås, University of Gävle, Halmstad University, Jönköping University, University of Skövde, Kristianstad University, University West, Karlstad University, Karolinska Institutet, KTH Royal Institute of Technology, Linköping University, Linnaeus University, Luleå University of Technology, Lund University, Malmö University, Mid Sweden University, Mälardalen Univeristy, The Red Cross University College, Sophiahemmet University, Stockholm University, Swedish University of Agricultural Sciences, Södertörns University, Umeå University, Uppsala University, and Örebro University. |
||
| Population size | R&D expenditure survey: 39 legal units. Time-use survey: 59 030 positions. |
||
| Planned sample size | Time-use survey: A minimum planned sample size of 7 positions per stratum. | ||
| Sample selection mechanism (for sample surveys only) | Time-use survey: Systematic stratified sample. | ||
| Survey frame | R&D expenditure survey: All legal units categorised as higher eduation institutions that received funds for research and development during the referenceperiod. Time-use survey: Positions that are classified according to FORD or classified as researchers in The Registry of the Employees in Higher Education. A pre-survey is conducted to limit the number of positions that are neither classified according to FORD nor classified as researchers. Only positions that are deemed likely to belong to the R&D personnel are included. |
||
| Sample design | Time-use survey: Stratified systematc sample. The frame is ordered by the stratification variables and every position at a fixed interval is sampled. | ||
| Sample size | R&D expenditure survey: 39 legal units. Time-use survey: 13 064 positions. |
||
| Survey frame quality | R&D expenditure survey: The quality of the frame is good. There is no coverage error in this survey. Time-use survey: The quality of the frame is good. There may be some undercoverage since the frame only captures positions at a certain date. Such positions as ended before this date or started after it but were still relevant for the reference period are thus not covered by the frame. There is also over coverage due to imperfect information on which positions belong to the R&D personnel. |
18.1.3. Information on collection of administrative data or of pre-compiled statistics
| Source | The Registry of the Employees in Higher Education compiled by Statistics Sweden. |
| Description of collected data / statistics | Data on all employed individuals and their positions at higher education institutions in Sweden. |
| Reference period, in relation to the variables the survey contributes to | Calendar year, the reference period is the same as for the variables the survey contributes to. |
18.2. Frequency of data collection
See 12.3.3.
18.3. Data collection
See below.
18.3.1. Data collection overview
| Information provider | R&D expenditure survey: The data collected consist of funding for R&D and the doctoral programme allocated by source of funds and FORD (3 digit level) as well as capital costs and depreciations connected to R&D and the doctoral programme allocated by FORD (1 digit level). Time-use survey: Collected data consist of allocation of work hours in percent to a range of acitvities; R&D activities including direct support, applying for funding for R&D activities including direct support, teaching at bachelor's level and master's level including direct support, teaching at doctoral level including direct support, participation in education/courses within ones own doctoral education, administration not directly related to R&D or teaching, expert or advisory tasks pertaining to the position, other activities pertaining the positition. |
| Description of collected information | R&D expenditure survey: Data on funding for R&D allocated by FORD (3-digit level) and source of funds is collected for each higher education institution. Capital costs and depreciations are also collected allocated by FORD (1-digit level). Time-use survey: Data on the allocation of working time in percent is collected. The activities the respondents are asked to allocate their time between are the following:
The time-use survey also collects information on the allocation of research time between basic research, applied research and experimental development. |
| Data collection method | R&D expenditure survey: The questionnaire used is an Excel file that is downloaded from and uploaded to Statistics Sweden's online survey tool, SIV. There is a unique file for every higher education institution which contains total funding for R&D and the doctoral programme by source of funds as well as total depreciations for R&D and the doctoral programme. These data are collected from the Swedish Higher Education Authority and pre-printed in the Excel file for each higher education institution. The responent is asked to allocate the funding by FORD and enter capital costs. When the file is uploaded it is automcatically checked for potential errors such as if the respondent has not entered any captial costs or if the allocated funding do not sum up to the pre-printed totals. Time-use survey: The primary data collection method is an online questionnaire, implemented in Statistics Sweden's online survey tool, SIV. This questionnaire contains automated checks that ensure that the respondent cannot answer in a way that is logically inconsistent. It is also tested by an expert in survey design to ensure that the order of the questions is logical, that instructions are clear and relevant, and that questions are worded in a way to avoid misunderstanding. As a measure to avoid a systematically skewed non-response it is also possible to respond to the survey on paper. The paper questionnaire is sent out by mail to all those who have not yet responded by the second remainder. In total, four reminders are sent out by mail. |
| Time-use surveys for the calculation of R&D coefficients | See description of information provider, collected information and collection method for the time-use survey above. |
| Realised sample size (per stratum) | The realised sample size for the time-use survey for the reference year 2021 was 13 078 units. |
| Mode of data collection (face-to-face interviews; telephone interviews; postal surveys, etc.) | See description of data collection method for the time-use survey above. |
| Incentives used for increasing response | No incentives are used for increasing reponse. |
| Follow-up of non-respondents | No follow-up of non-respondents. |
| Replacement of non-respondents (e.g. if proxy interviewing is employed) | No replacement of non-respondents. |
| Response rate (ratio of completed "interviews" over total number of eligible enterprises or enterprises of unknown eligibility) | The response rate for the time-use survey regarding the reference year 2021 was 41 percent. |
| Non-response analysis (if applicable -- also see section 18.5. Data compilation - Weighting and Estimation methods) | No non-response analysis conducted. |
18.3.2. Questionnaire and other documents
| Annex | Name of the file |
| R&D national questionnaire and explanatory notes in English: | Time-use survey: Time-use survey questionnaire (in English). |
| R&D national questionnaire and explanatory notes in the national language: | R&D expenditure survey: R&D expenditure survey questionnaire. Time-use survey: Time-use survey questionnaire (in Swedish). |
| Other relevant documentation of national methodology in English: | No documentation available in English. |
| Other relevant documentation of national methodology in the national language: | Methodology documentation. |
Annexes:
R&D expenditure survey questionnaire
Time-use survey questionnaire (in Swedish)
Time-use survey questionnaire (in English)
Methodology documentation (available in Swedish only)
18.4. Data validation
R&D expenditure survey: Data are validated both at micro and macro level. The validation at micro level consists of comparing the allocation of funds by FORD for each higher education insitution with the data provided two years previous. In case of major differences in the reporting, the respondent is contacted to confirm or revise their answer. At the macro level the data validation focuses on numeric consistency; e.g. making sure that corresponding sums in different statistical tables are the same and that there is consistency between sums and their respecitve parts. This validation helps ensure that no processing errors have occurred.
Time-use survey: Data validation at the micro level for this survey focuses on ensuring logical consistency in the data by editing data where such inconsistencies occur. Pre-established rules are used to edit micro data for logical inconsistencies such as if the respondent has responded both online and on paper and the responses do not match. The online questionnaire contains checks that ensure that a respondent cannot answer in a way that is logically inconsistent. However, in the paper questionnaire this is not possible. For these respondents it is therefore sometimes necessary to edit micro data to make it logically consistent. As with the census on R&D expenditure, the data validation at the macro level focuses on numeric consistency to make sure no processing errors have occurred.
18.5. Data compilation
See below.
18.5.1. Imputation - rate
Not applicable, imputation is not used for the Higher education sector.
18.5.2. Data compilation methods
| Data compilation method - Final data (between the survey years) | R&D expenditure survey: R&D funding by source of funds are collected from the Swedish Higher Education Authority. R&D coefficients from the latest time-use survey are used to exclude costs for education within the doctoral programme. Breakdown by FORD is estimated by using the same allocation as the previous year for each individual higher education institution. Time-use survey: Auxiliary administrative data from The Registry of the Employees in Higher Education is used to make a projection based on the previous years estimations. |
| Data compilation method - Preliminary data | No preliminary data is published for gap years. |
18.5.3. Methodology for derivation of R&D coefficients
| National methodology for their derivation. | The method for deriving R&D coefficients utilises data from the time-use survey on R&D personnel in the Higher education sector. Through the time-use survey data is collected on how R&D personnel allocate their working hours between different activities, such as R&D or direct support to R&D activities, teaching, participation in courses within one’s own doctoral education and administration not directly related to R&D. Because the funding to which the R&D coefficients are applied only cover research and the doctoral programme, the purpose of the R&D coefficient is to exclude costs connected to the educational part of the doctoral programme so as to isolate R&D expenditure. Therefore, it is only necessary to take into account time spent either on R&D or on participation in courses within one’s own doctoral education when deriving the R&D coefficients. Using the time-use data, a R&D ratio can be calculated for each respondent. Respondents that are not doctoral students, and thus do not allocate any time to participation in such courses, get a ratio of 1, while those who are doctoral students get a ratio between 0 and 1 according to the following formula: R&D ratio = R&D / (R&D + participation in doctoral education) The R&D coefficient is the estimated average R&D ratio for each cross-classification by higher education institution and FORD. Hence, in case there are no doctoral students in a cross-classification, it will have an R&D coefficient of 1. |
| Revision policy for the coefficients | R&D coefficients are revised biennially. |
| Issues that affect their quality (e.g. date of last update, aggregation level at which they are computed, etc). | Since R&D coefficients are estimated based on data from the time-use survey, their quality is affected by the response rate and other quality aspects of the survey. |
18.5.4. Measurement issues
| Method of derivation of regional data | R&D expenditure and R&D personnel are distributed regionally based on data on the work location for the personnel. Subsequently, if 10 percent of the personnel works in a region, then 10 percent of the higher education institution's R&D expenditures are allocated to that region. |
| Coefficients used for estimation of the R&D share of more general expenditure items | Data on R&D funds collected in the survey contains both funds for research and for the doctoral programme. Since costs for education within the doctoral programme should not be included in R&D expenditure according to FM15, R&D coefficients are used to distinguish R&D expenditure from the educational costs. See section 18.5.3. for a description of the methodology for deriving the R&D coefficients. |
| Inclusion or exclusion of VAT and provisions for depreciation in the measurement of expenditures | Higher education insititutions are exempt from VAT, thus no measures need to be taken to exclude VAT from R&D expenditure. Data on depreciations are collected from the higher education institutions and subtracted from R&D expenditure. |
| Treatment and calculation of GUF source of funds / separation from “Direct government funds” | Data on R&D funds collected from The Swedish Higher Education Authority is detailed enough to separate general university funds (GUF) from direct government funding. |
| Differences between national and Frascati Manual classifications not mentioned above and impact on national statistics | No additional differences. |
18.5.5. Weighting and estimation methods
| Description of weighting method | R&D expenditure survey: No weighting is applied as R&D expenditure are measured by a census survey. Time-use survey: Weights are adjusted to compensate for object non-response. They are calculated by dividing the number of units in the population by the number of respondents for each stratum. No further calibration based in auxiliary information is performed to compensate for non-response. |
| Description of the estimation method | R&D expenditure survey: Expenditure is derived from R&D funding by subtracting depreciations and costs associated with the education within the doctoral programme. Depreciations are subtracted by multiplying R&D funds by source of funds and FORD (3 digit level) with a depreciation ratio calculated as follows: Depreciation ratio = depreciations (by higher education insitution and FORD (1 digit level)) / total funding (by higher education insitution and FORD (1 digit level)). Costs associated with education within the docotral programme are subtracted in a similar manner by multiplying the funding from which depreciations have been subtracted with an R&D coefficient. For more details on the method for deriving R&D coefficients see 18.5.3. Methodology for derivation of R&D coefficients. Time-use survey: The estimation method used is Taylor Series Variance Estimation. |
18.6. Adjustment
Not requested.
18.6.1. Seasonal adjustment
Not requested.
Statistics on higher education R&D (HERD) measure research and experimental development (R&D) performed in the higher education sector, i.e. R&D expenditure and R&D personnel. In line with this objective the target population for the national R&D survey of the higher education sector should consist of all R&D performing institutional units (including all R&D performers – occasional and continuous, known and unknown - in all branches and size classes) belonging to this sector.
The main concepts and definitions used for the production of R&D statistics are given by the OECD (2015), Frascati Manual 2015: Guidelines for Collecting and Reporting Data on Research and Experimental Development, The Measurement of Scientific, Technological and Innovation Activities, which is the internationally recognised standard methodology for collecting R&D statistics and Eurostat’s European Business Statistics Methodological Manual on R&D Statistics(EBS Methodological Manual on R&D Statistics) complements this with guidelines for further harmonisation among EU, EFTA and candidate countries.
Since the beginning of 2021, the collection of R&D statistics is based on Commission Implementing Regulation (EU) No 2020/1197 of 30 July 2020. The Regulation sets the framework for the collection of R&D statistics and specifies the main variables of interest and their breakdowns at predefined level of detail. Statistics on science, technology and innovation were collected until the end of 2020 based on Commission Implementing Regulation (EU) No 2012/995 concerning the production and development of Community statistics on science and technology.
14 August 2023
See below.
The statistical unit is the institutional unit as defined by Council Regulation (EEC) No 1993/696 of 15 March 1993, if there are deviations please explain.
See below.
Not requested. R&D statistics cover national and regional data.
2021.
Accuracy in the statistical sense denotes the closeness of computations or estimates to the exact or true values. Statistics are not equal with the true values because of variability (the statistics change from implementation to implementation of the survey due to random effects) and bias (the average of the possible values of the statistics from implementation to implementation is not equal to the true value due to systematic effects).
Several types of statistical errors occur during the survey process. The following typology of errors has been adopted:
1. Sampling errors. These only affect sample surveys. They are due to the fact that only a subset of the population, usually randomly selected, is enumerated.
2. Non-sampling errors. Non-sampling errors affect sample surveys and complete enumerations alike and comprise:
a) Coverage errors,
b) Measurement errors,
c) Non response errors and
d) Processing errors.
Model assumption errors should be treated under the heading of the respective error they are trying to reduce.
National currency in thousands, head count and full-time equivalents in number.
See below.
Several separate activities are used for the collection of raw data or pre-compiled administrative data and statistics related to R&D. For simplicity, we call them surveys irrespective of whether they are sample surveys, censuses, collections of administrative data/pre-compiled statistics. This section presents the names of the surveys by sector of performance as well as methodological information for each survey. Depending on the type of survey and sector of performance, only the sections corresponding to that survey and sector are filled in.
Annually.
Timeliness and punctuality refer to time and dates, but in a different manner: the timeliness of statistics reflects the length of time between their availability and the event or phenomenon they describe. Punctuality refers to the time lag between the release date of the data and the target date on which they should have been delivered, with reference to dates announced in the official release calendar.
See below.
See below.
