|
 |
| For any question on data and metadata, please contact: Eurostat user support |
|
|||
| 1.1. Contact organisation | Statistical Service of Cyprus (CYSTAT) |
||
| 1.2. Contact organisation unit | National Accounts, Public Finance, Foreign Trade, Agriculture, Business Statistics, Energy, Environment, Science and Technology, International Cooperation, Programming, Methodology and Quality Management, Statistical Dissemination, Prices, Labour, ICT Surveys, Demography, Social Statistics, Tourism. |
||
| 1.5. Contact mail address | Statistical Service of Cyprus CY-1444 Nicosia Cyprus |
||
|
|||
| 2.1. Metadata last update | 26/01/2024 | ||
| 2.2. Metadata last certified | 26/01/2024 | ||
| 2.3. Metadata last posted | 26/01/2024 | ||
|
|||
| 3.1. Data description | |||
The House Price Index (HPI) measures changes in the selling prices of dwellings (including the value of land) purchased by households. Both newly built and existing dwellings are covered. The land component of the residential property is included. |
|||
| 3.2. Classification system | |||
The HPIs are classified according to the following categories: H.1. Purchases of dwellings H.1.1. Purchases of newly built dwellings H.1.2. Purchases of existing dwellings |
|||
| 3.3. Coverage - sector | |||
ESA 2010 Sector S.14 (Household Sector). |
|||
| 3.4. Statistical concepts and definitions | |||
The following data are available: - Index HPI 2015=100 - Percentage change compared to same quarter of the previous year. - Percentage change compared to the previous quarter of the same year. HPI measures the price change of residential dwellings in the reference period compared to the base period. All transactions of residential dwellings are included. Non-marketed prices (e.g., self-built dwellings) are excluded. Residential dwellings bought for uses other than owner-occupancy are included (e.g., to rent it out). New and old dwellings are included. Index figures for purchases of dwellings are compiled on the basis of full transaction price which includes the value of land. HPI is a Laspeyre’s type index as the Harmonized Index of Consumer Prices. Annual weights are the expenditure shares of strata in the previous year. |
|||
| 3.5. Statistical unit | |||
Residential property transactions. |
|||
| 3.6. Statistical population | |||
All transactions of residential dwellings. |
|||
| 3.7. Reference area | |||
Government controlled areas of the Republic of Cyprus. |
|||
| 3.8. Coverage - Time | |||
Data are available since the first quarter of 2010. |
|||
| 3.9. Base period | |||
2015=100. |
|||
|
|||
Index figures can be interpreted as follows: Index equals 100 in the base period. For any other period the index represents the amount that the buyer would have to spend on average in that period to buy a residential property having a value of 100 in the base period. |
|||
|
|||
HPI is compiled quarterly. |
|||
|
|||
| 6.1. Institutional Mandate - legal acts and other agreements | |||
Article 3 of the national Official Statistics Law, No. 25(I) of 2021 defines the functions of the Statistical Service of Cyprus regarding the production and dissemination of official statistics. Moreover, Article 13, explicitly stipulates the mandate for data collection and introduces a mandatory response to statistical enquiries by stipulating the obligation of respondents to reply to surveys and provide the data required. This relates not only to national but also to European statistics which, by virtue of Article 8 of the said Law, are incorporated in the annual and multiannual programmes of work without any further procedure.
|
|||
| 6.2. Institutional Mandate - data sharing | |||
Not available. |
|||
|
|||
| 7.1. Confidentiality - policy | |||
Official statistics are released in accordance to all confidentiality provisions of the following:
|
|||
| 7.2. Confidentiality - data treatment | |||
The treatment of confidential data is regulated by CYSTAT's Code of Practice for the Collection, Publication and Storage of Statistical Data. |
|||
|
|||
| 8.1. Release calendar | |||
Notifications about the dissemination of statistics are published in the release calendar, which is available on CYSTAT’s website. The annual release calendar, announced during the 4th quarter of the each year, includes provisional dates which are finalised the week before publication. |
|||
| 8.2. Release calendar access | |||
| 8.3. Release policy - user access | |||
According to the Dissemination and Pricing Policy of the Statistical Service of Cyprus (section 2.3) CYSTAT΄s main channel for dissemination of statistics is the web portal, which offers the same conditions to everyone and is updated at the same time every working day (12:00 noon). No privileged pre-released access is granted. In addition to the annual release calendar, users are informed of the various statistical releases through the “Alert” service provided by CYSTAT. |
|||
|
|||
Quarterly. |
|||
|
|||
| 10.1. Dissemination format - News release | |||
CYSTAT prepares a monthly press release and relevant tables that include the HPI. |
|||
| 10.2. Dissemination format - Publications | |||
Not available. |
|||
| 10.3. Dissemination format - online database | |||
All data concerning HPI is available on the website under the statistical theme Economy and Finance /House Price Index. |
|||
| 10.4. Dissemination format - microdata access | |||
Statistical micro-data from CYSTAT’s surveys are accessible for research purposes only and under strict provisions as described below:
|
|||
| 10.5. Dissemination format - other | |||
The publication of the HPI is also made with an announcement to the media. |
|||
| 10.6. Documentation on methodology | |||
HPI methodology is available on Eurostat’s website, under 'Housing Price Statistics'. |
|||
| 10.7. Quality management - documentation | |||
On CYSTAT's website, an HPI metadata document is published in both Greek and English language. |
|||
|
|||
| 11.1. Quality assurance | |||
The quality of statistics in CYSTAT is managed in the framework of the European Statistics Code of Practice which sets the standards for developing, producing and disseminating European Statistics as well as the ESS Quality Assurance Framework (QAF). CYSTAT endorses the Quality Declaration of the European Statistical System. In addition, CYSTAT is guided by the requirements provided for in Article 11 of the Statistics Law No. 25(I) of 2021 as well as Article 12 of Regulation (EC) No 223/2009 on European statistics, which sets out the quality criteria to be applied in the development, production and dissemination of European statistics. |
|||
| 11.2. Quality management - assessment | |||
The quality of the House Price Index is assessed on the basis of the Technical manual on Owner-Occupied Housing and House Price Indices published by Eurostat. Every effort is made in order to maintain and improve the quality of the House Price Index. |
|||
|
|||
| 12.1. Relevance - User Needs | |||
The HPI interests all the users that follow the developments in the house price market. |
|||
| 12.2. Relevance - User Satisfaction | |||
Since 2008 (with the exception of 2010, 2013 and 2020) CYSTAT carries out an annual online “Users Satisfaction Survey”. The results of the surveys are available on CYSTAT’s website. Overall, there is a high level of satisfaction of the users of statistical data published by CYSTAT. |
|||
| 12.3. Completeness | |||
The HPI and all required sub-indices are transmitted to Eurostat quarterly. |
|||
|
|||
| 13.1. Accuracy - overall | |||
No estimates for overall accuracy of HPI are produced. |
|||
| 13.2. Sampling error | |||
Not applicable. |
|||
| 13.3. Non-sampling error | |||
No estimates of non-sampling errors are produced. |
|||
|
|||
| 14.1. Timeliness | |||
Data are transmitted to Eurostat according to the OOH Regulation (indices: 85 days after the reference period and weightsin June of the year following the year to which the weights relate). |
|||
| 14.2. Punctuality | |||
The HPI data is transmitted to Eurostat according to the transmission calendar and within 85 days after the end of the reference period. |
|||
|
|||
| 15.1. Comparability - geographical | |||
It is possible to compare the Cypriot House Price Index with the House Price Indices of other Member States. |
|||
| 15.2. Comparability - over time | |||
For the period 2010-2014, a proxy for the indicator of luxury dwellings was used. An indicator of luxury dwellings based on real data has been used since the first quarter of 2015. Although it is assumed that the proxy is a good approximation of the indicator, this change may cause a break in the series. |
|||
| 15.3. Coherence - cross domain | |||
The OOHPI may partly overlap the scope of the HPI. The Central Bank of Cyprus (CBC) compiles a Residential Property Price Index based on property valuations. The Royal Institution of Chartered Surveyors in Cyprus publishes a quarterly price index that tracks property across all districts and across all property types in Cyprus. |
|||
| 15.4. Coherence - internal | |||
All figures are checked for internal consistency. |
|||
|
|||
Οnly the cost of employees. |
|||
|
|||
| 17.1. Data revision - policy | |||
A data revision policy is in place at CYSTAT. It is published on CYSTAT’s website, at the following link: |
|||
| 17.2. Data revision - practice | |||
The main reasons for revisions are new or revised datasets, calculation mistakes or revisions of the compilation method. |
|||
|
|||
| 18.1. Source data | |||
See below. |
|||
| 18.1.1. Prices | |||
The administrative data source that is used for newly built dwellings and for existing dwellings - prices and weights - is the Department of Lands and Surveys, Ministry of Interior. |
|||
| 18.1.2. Weights | |||
The administrative data source used for both prices and weights is the Department of Lands and Surveys, Ministry of Interior. |
|||
| 18.1.3. Source data - House Sales indicators | |||
The land's registry data are used. |
|||
| 18.2. Frequency of data collection | |||
Quarterly. |
|||
| 18.3. Data collection | |||
Administrative data are received quarterly from the Department of Lands and Surveys, Ministry of Interior. CYSTAT has allocated staff to the Department of Lands and Surveys in order to collect additional data needed for contracts of sales. CYSTAT has also come to an agreement with the Department of Lands and Surveys to receive all the necessary data regarding sales. |
|||
| 18.4. Data validation | |||
Data are checked for internal consistency.Particularly, a validation file with consistency tests is used to verify that there are no inconsistencies. |
|||
| 18.5. Data compilation | |||
See below. |
|||
| 18.5.1. Calculation and Aggregation | |||
See below. |
|||
| 18.5.1.1. Index formulae | |||
HPI is a Laspeyres-type price index. |
|||
| 18.5.1.2. Aggregation method | |||
In order to calculate the sub-indices for old and newly built dwellings, a Rolling Year Hedonic Regression Model is used. These sub-indices are then aggregated together using transaction-based weights in order to produce the HPI. Therefore, the overall aggregate index is fully consistent with its component indices. |
|||
| 18.5.1.3. Derivation of sub-index and elementary aggregate weights | |||
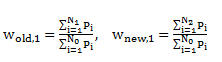
Calculation of weights In order to calculate weights the following method is used: For the 1st quarter of each year, the annual weights of the previous year are used since the base period is the 4th quarter of the previous year. In order to calculate these weights the following formulae are used:
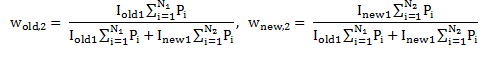
where pi, is the transaction price for dwelling i, N1 is the number of transactions of old dwellings for the previous year and N2 is the number of transactions of new dwellings for the previous year and N0=N1 + N2 is the number of transactions of all dwellings for the previous year. For the 2nd quarter the weights of the previous year are updated to the 1st quarter of the year (which is the base period) in the following way:
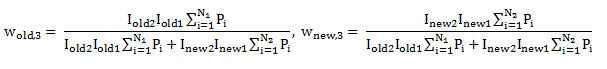
where Iold1 is the HPI for old dwellings in the first quarter and Inew1 is the HPI for new dwellings in the first quarter (with base period the last quarter of the previous year). For the 3rd quarter the weights of the previous quarter are updated to the 2nd quarter of the year (which is the base period) in the following way:
where Iold2 is the HPI for old dwellings in the 2nd quarter and Inew2 is the HPI for new dwellings in the 2nd quarter (with base period the first quarter of the year). For the 4th quarter the weights of the previous quarter are updated to the 3rd quarter of the year (which is the base period) in the following way:
where Iold3 is the HPI for old dwellings in the 3rd quarter and Inew3 is the HPI for new dwellings in the 3rd quarter (with base period the second quarter of the year). |
|||
| 18.5.1.4. Price updating | |||
The weights reference period is t-1. |
|||
| 18.5.1.5. Chaining and linking method | |||
The Rolling Year Hedonic Regression Model which is a Time dummy variable hedonic approach is used for the production of a chain-linked index. |
|||
| 18.5.1.6. Compilation of sub-indices | |||
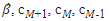
Method of calculation of the index in each stratum In order to calculate the sub-indices for old and newly built dwellings, a hedonic model of the following form is used in each stratum:
where p is the price, X is the matrix of characteristics, It, It-1, It-2 are the time dummy variables for the quarter t and the previous two quarters, respectively and ε are the error terms. The rolling window method uses a rolling window length of M=4 quarters. For the next quarter, a new regression model is estimated where the data consist of the initial data less the data for period (quarter) 1 of 2010 but adding the data for period (quarter) M+1= 5, in our case the 1st quarter of 2011. Appropriate price indices are calculated for this new regression model, but only the rate of increase/decrease of the index from period M to M+1 is used to update the previous sequence of M index values. Given the estimated parameters of the model
This procedure is continued with each successive regression dropping the data of the previous earliest period and adding the data for the next period, with one new update factor being added with each regression. |
|||
| 18.5.1.6.1. Hedonic method | |||
Method of calculation of the index in each stratum In order to calculate the sub-indices for old and new dwellings, a hedonic model of the following form is used in each stratum:
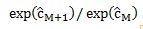
where p is is the price, X is the matrix of characteristics, It, It-1, It-2 are the time dummy variables for the quarter t and the previous two quarters, respectively and ε are the error terms. The rolling window method uses a rolling window length of M=4 quarters. An initial regression model is estimated and the appropriate indices are calculated using data pertaining to the first M=4 quarters of the data set, where M is the window length, i.e. the number of periods used in each regression. In our case, the dataset includes all transactions of dwellings for all quarters from 2010 and the initial regression is based on the first 4 quarters of 2010. For the next quarter, a new regression model is estimated where the data consist of the initial data less the data for period (quarter) 1 of 2010 but adding the data for period (quarter) M+1= 5, in our case the 1st quarter of 2011. Appropriate price indices are calculated for this new regression model, but only the rate of increase/decrease of the index from period M to M+1 is used to update the previous sequence of M index values. Given the estimated parameters of the model the index from period M to M+1 is calculated as the ratio:
This procedure is continued with each successive regression dropping the data of the previous earliest period and adding the data for the next period, with one new update factor being added with each regression. |
|||
| 18.5.1.6.2. SPAR method | |||
not applicable |
|||
| 18.5.1.6.3. Stratification | |||
Strata Existent and newly built dwellings |
|||
| 18.5.2. Other processing issues | |||
See below. |
|||
| 18.5.2.1. Timing for pricing | |||
For newly built dwellings the price is recorded when the binding contract is signed and the contract of sale is deposited to the Department of Lands and Surveys. For second hand dwellings the price is recorded when the contract of sale is signed and deposited to the Department of Lands and Surveys or when the Title Deed is transferred to the new owner. |
|||
| 18.5.2.2. Treatment of VAT | |||
VAT is included in the price of new dwellings. |
|||
| 18.5.2.3. Treatment of other taxes | |||
Taxes other than VAT are not included in the price of dwellings. |
|||
| 18.5.2.4. Treatment of government subsidies | |||
Dwellings purchased with the use of government subsidies are not included in the index compilation. |
|||
| 18.5.2.5. Treatment of land | |||
The price of land is included in both prices and weights. |
|||
| 18.5.2.6. Housing cooperatives | |||
Not applicable. |
|||
| 18.5.2.7. Treatment of non-market transactions | |||
Non-market transactions such as inheritances are not included in the analysis |
|||
| 18.5.2.8. Treatment of multi-object transactions | |||
Transactions that include more than one property are single out by property. |
|||
| 18.5.2.9. Treatment of fractional transactions | |||
Fractional transactions are excluded. |
|||
| 18.5.2.10. Outliers detection | |||
Outliers are detected using Cook's distance method. The Cook's distance is calculated using SPSS (ANALYZE-LINEAR REGRESSION-SAVE-COOK'S) for all the available observations for the four quarters (the current and the three previous quarters) . Observations with Cook's distance greater than 4/n where n is the number of observations are considered as outliers. |
|||
| 18.5.2.11. Treatment of incomplete data source coverage | |||
Since the data for contracts of sales on the excel file are not of good quality, staff is allocated by CYSTAT at the district offices of DLS to collect contracts of sales from physical files. A standard template is used for the collection of data for contracts of sales. |
|||
| 18.6. Adjustment | |||
No adjustments other than quality adjustment are applied to the HPI data. |
|||


 , the index from period M to M+1 is calculated as the ratio:
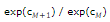

 .
.
|
|||
None. |
|||
|
|||
|
|||