Orchard (orch)

National Reference Metadata in ESS Standard for Orchard survey Quality Report Structure (esqrsor)

Compiling agency: Ministerio de Agricultura, Pesca y Alimentación


Eurostat metadata
Reference metadata
1. Contact
2. Statistical presentation
3. Statistical processing
4. Quality management
5. Relevance
6. Accuracy and reliability
7. Timeliness and punctuality
8. Coherence and comparability
9. Accessibility and clarity
10. Cost and Burden
11. Confidentiality
12. Comment
Related Metadata
Annexes (including footnotes)


For any question on data and metadata, please contact: Eurostat user support

Download


1. Contact Top
1.1. Contact organisation

Ministerio de Agricultura, Pesca y Alimentación

1.2. Contact organisation unit

Subdirección General de Análisis, Coordinación y Estadística

1.5. Contact mail address

Ministerio de Agricultura, Pesca y Alimentación

Despacho EB-8

Paseo Infanta Isabel, 1

CP-28071 MADRID


2. Statistical presentation Top
2.1. Data description

Main characteristics

2.1.1 Describe shortly the main characteristics of the statistics  

Structural orchard statistics provide data on the area, age and density of apple, pear, peach, nectarine, apricot, citrus fruit and olive orchards and vineyards producing table grapes. The statistics are collected from surveys and administrative data sources. Data are collected on national level and for some variables also at NUTS1 level. The data collection concerns countries with more than 1000 ha of area for any single fruit tree type.

2.1.2 Which of the fruit tree types are covered by the data collection?  Dessert apple trees
Apple trees for industrial processing
Dessert pear trees
Pear trees for industrial processing
Dessert peach and nectarine trees
Apricot trees
Peach and nectarine trees for industrial processing (including group of Pavie)
Orange trees
Small citrus fruit trees
Lemon trees
Table grape vines
Olive trees
2.1.3 If Other, please specify


Reference period

2.1.4 Reference period of the data collection 

2017

2.1.5 When was the data collection done (month(s) and year)

May 2017 – December 2017


National legislation

2.1.6 Is there a national legislation covering these statistics?  No
If Yes, please answer all the following questions.   
2.1.7 Name of the national legislation 

n.a.

2.1.8 Link to the national legislation 

n.a.

2.1.9 Responsible organisation for the national legislation 

n.a.

2.1.10 Year of entry into force of the national legislation 
2.1.11 Please indicate which variables required under EU regulation are not covered by national legislation, if any.
2.1.12 Please indicate which national definitions differ from those in the EU regulation, if any. 
2.1.13 Please indicate which additional variables have been collected if compared to Regulation (EU) 1337/2011, if any?
2.1.14 Is there a legal obligation for respondents to reply?  No


Additional comments on data description

2.2. Classification system

Species and variety group classification, age and density classifications available in RAMON

2.3. Coverage - sector

Cultivated land with permanent crops listed in Article 1 of Regulation (EU) No 1337/2011 for market production. Coverage differs from  "Growing of perennial crops (NACE A01.2)" , as the survey is not addressed to farms, but is based on an area frame sampling.

2.4. Statistical concepts and definitions

See: Orchard statistics Handbook

2.4.1 Do national crop item definitions differ from the definitions in the Handbook  (D-flagged data)? No
2.4.2 If Yes, please specify the items and the differences
2.4.3 If the fruits for industrial processing are not separately surveyed, are they included in dessert fruit categories?
2.4.4 If yes, for which fruit tree types?
In case data are delivered for one of the items below, describe the 10 biggest varieties included in the item:   
2.4.5 Other dessert apples n.e.c.

Opal, Buckelle, Cardinal

2.4.6 Other dessert pears n.e.c.

Roma, Castell, Morettini, Giffard, Alexandrine, Leclerc, Cassana

2.4.7 Other oranges n.e.c.

Not classified / rootstocks not grafted

2.4.8 Other small citrus fruits, including hybrids

Ortanike, Clemenvilla, Afourer/Nadorcott, Fortune, Safor, Moncada, Queen, Garbí, Murcott, Volkamericana

2.5. Statistical unit

Utilised agricultural area used for the cultivation of permanent crops mentioned in point 2.1, cultivated by an agricultural holding producing entirely or mainly for the market.

2.6. Statistical population

All agricultural holdings growing entirely or mainly for the market permanent crops mentioned in point 2.1.

2.7. Reference area
2.7.1 Geographical area covered

The entire territory of the country.

2.7.2 Which special Member State territories are included?

Canary Islands

Balearic Islands
2.8. Coverage - Time

Five – year data for the period 2007 - 2017

2.9. Base period


3. Statistical processing Top
3.1. Source data

Overall summary

3.1.1 Total number of different data sources used

1

The breakdown is as follows: 
3.1.2 Total number of sources of the type "Census"

0

3.1.3 Total number of sources of the type "Sample survey"

1

3.1.4 Total number of sources of the type "Administrative source"

0

3.1.5 Total number of sources of the type "Experts"

0

3.1.6 Total number of sources of the type "Other sources"

0


Census

These questions only apply to censuses. If there is more than one census, please describe the main census below and the additional ones in table 3.1 of the annexed Excel file 
3.1.7 Name/Title
3.1.8 Name of Organisation responsible
3.1.9 Main scope
3.1.10 Target fruit tree types
3.1.11 List used to build the frame
3.1.12 Any possible threshold values
3.1.13 Population size
3.1.14 Additional comments


Sample survey

These questions only apply to surveys. If there is more than one survey, please describe the main survey below and the additional ones in table 3.1 of the annexed Excel file 
3.1.15 Name/Title

Survey on plantations of fruit trees, olives and table grapes

3.1.16 Name of Organisation responsible

Ministry of Agriculture, Fisheries and Food

3.1.17 Main scope

Cultivated land with permanent crops listed in Article 1 of Regulation (EU) No 1337/2011 for market production.

3.1.18 Target fruit tree types All
3.1.19 List used to build the frame

The Survey on plantations of fruit trees, olives and table grapes is part of an Area Frame type of survey. The frame is a grid of squares (1 km x 1km) covering the entire territory of the country (except for Ceuta and Melilla). The frame units are stratified using SIGPAC and Corine Land Cover information.

3.1.20 Any possible threshold values

Areas under 100 square meters

3.1.21 Population size

502.831

3.1.22 Sample size

5,284

3.1.23 Sampling basis Area
3.1.24 If Other, please specify
3.1.25 Type of sample design Stratified
3.1.26 If Other, please specify
3.1.27 If Stratified, number of strata

4

3.1.28 If Stratified, stratification criteria Other
3.1.29 If Other, please specify

Type of crops

Crop index (percentage of cultivated area over total area of the unit)
 
Irrigated cropland / Non-irrigated cropland


3.1.30 Additional comments


Administrative source

These questions only apply to administrative sources. If there is more than one administrative source, please describe the main source below and the additional ones in table 3.1 of the annexed Excel file 
3.1.31 Name/Title
3.1.32 Name of Organisation responsible
3.1.33 Contact information (email and phone)
3.1.34 Main administrative scope
3.1.35 Target fruit tree types 
3.1.36 Geospatial Coverage
3.1.37 Update frequency
3.1.38 Legal basis
3.1.39 Are you able to access directly to the micro data?
3.1.40 Are you able to check the plausibility of the data, namely by contacting directly the units?
3.1.41 How would you assess the proximity of the definitions and concepts (including statistical units) used in the administrative source with those required in the EU regulation?
3.1.42 Please list the main differences between the administrative source and the statistical definitions and concepts
3.1.43 Is a different threshold used in the administrative source and statistical data?
3.1.44 If Yes, please specify
3.1.45 Additional comments


Experts

If there is more than one Expert source, please describe the main one below and the additional ones in table 3.1 of the annexed Excel file 
3.1.46 Name/Title
3.1.47 Primary purpose
3.1.48 Target fruit tree types
3.1.49 Legal basis
3.1.50 Update frequency
3.1.51 Expert data supplier
3.1.52 If Other, please specify
3.1.53 How would you assess the quality of those data?
3.1.54 Additional comments


Other sources

If there is more than one other statistical activity, please describe the main one below and the additional ones in table 3.1 of the annexed Excel file 
3.1.55 Name/Title
3.1.56 Name of Organisation
3.1.57 Primary purpose
3.1.58 Target fruit tree types 
3.1.59 Data type
3.1.60 If Other, please specify
3.1.61 How would you assess the quality of those data?
3.1.62 Additional comments
3.2. Frequency of data collection

Every 5 years

3.3. Data collection

Census

These questions only apply to censuses. If there is more than one census, please describe the main census below and the additional ones in table 3.3 of the annexed Excel file 
3.3.1 Name/Title
3.3.2 Methods of data collection
3.3.3 If Other, please specify
3.3.4 If face-to-face or telephone interview, which method is used?
3.3.5 Data entry method, if paper questionnaires?
3.3.6 Please annex the questionnaire used (if very long: please provide the hyperlink)
3.3.7 Additional comments


Sample survey

These questions only apply to surveys. If there is more than one survey, please describe the main survey below and the additional ones in table 3.3 of the annexed Excel file 
3.3.8 Name/Title

Survey on plantations of fruit trees, olives and table grapes

3.3.9 Methods of data collection Other
3.3.10 If Other, please specify

Area frame Field visit

3.3.11 If face-to-face or telephone interview, which method is used?
3.3.12 Data entry method, if paper questionnaires? Manual
3.3.13 Please annex the questionnaire used (if very long: please provide the hyperlink)
3.3.14 Additional comments


Administrative source

These questions only apply to administrative sources. If there is more than one administrative source, please describe the main source below and the additional ones in table 3.3 of the annexed Excel file 
3.3.15 Name/Title
3.3.16 Extraction date
3.3.17 How easy is it to get access to the data?
3.3.18 Data transfer method
3.3.19 Additional comments


Experts

If there is more than one other statistical activity, please describe the main one below and the additional ones in table 3.3 of the annexed Excel file 
3.3.20 Name/Title
3.3.21 Methods of data collection
3.3.22 Additional comments


Annexes:
Questionnaire for Survey on plantations of fruit trees, olives and table grapes
3.4. Data validation
3.4.1 Which kind of data validation measures are in place? Manual
Automatic
3.4.2 What do they target? Completeness
Outliers
Aggregates
Consistency
3.4.3 If Other, please specify
3.5. Data compilation
3.5.1 Describe the data compilation process


Field investigation of sample units by experts is carried on from may to december. Information on species of fruit trees, varieties, plantation density and plantation age is compiled.

3.5.2 Additional comments
3.6. Adjustment

None


4. Quality management Top
4.1. Quality assurance
4.1.1 Is there a quality management system used in the organisation? Yes
4.1.2 If yes, how is it implemented?

Random inspections of field work are carried on.

Data coherence with expected field information and with time series are checked during data treatment.

Aggregates comparison with other statistical sources.

4.1.3 Has a peer review been carried out? No
4.1.4 If Yes, which were the main conclusions?
4.1.5 What quality improvements are foreseen? Improve data validation
4.1.6 If Other, please specify
4.1.7 Additional comments
4.2. Quality management - assessment

Development since the last quality report

4.2.1 Overall quality Stable
4.2.2 Relevance Stable
4.2.3 Accuracy and reliability Stable
4.2.4 Timeliness and punctuality Stable
4.2.5 Comparability Stable
4.2.6 Coherence Stable
4.2.7 Additional comments


5. Relevance Top
5.1. Relevance - User Needs
5.1.1 If certain user needs are not met, please specify which and why
5.1.2 Please specify any plans to satisfy needs more completely in the future

None

5.1.3 Additional comments
5.2. Relevance - User Satisfaction
5.2.1 Has a user satisfaction survey been conducted? Yes
If Yes, please answer all the following questions 
5.2.2 Year of the user satisfaction survey

2015

5.2.3 How satisfied were the users? Satisfied
5.2.4 Additional comments
5.3. Completeness
5.3.1 Data completeness - rate

100%

5.3.2 If not complete, which characteristics are missing?
5.3.3 Additional comments


6. Accuracy and reliability Top
6.1. Accuracy - overall
6.1.1 How good is the accuracy? Good
6.1.2 What are the main factors lowering the accuracy? Sampling error
6.1.3 If Other, please specify
6.1.4 Additional comments
6.2. Sampling error

Sample survey

These questions only apply to surveys. If there is more than one survey, please describe the main survey below and the additional ones in table 6.2 of the annexed Excel file 
6.2.1 Name/Title

Survey on plantations of fruit trees, olives and table grapes

6.2.2 Methods used to assess the sampling error Relative standard error
6.2.3 If Other, please specify
6.2.4 Methods used to derive the extrapolation factor Basic weight
6.2.5 If Other, please specify
6.2.6 If coefficients of variation are calculated, please describe the calculation methods and formulas


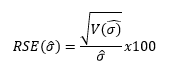
The variance was calculated using the boot strap estimator, i.e. drawing a series of independent samples from sampled observations, using the same sample cdesign as the one by which the initial sample was drawn from the population

6.2.7 Sampling error - indicators

Please provide the coefficients of variation in %

  CV (%)
Dessert apple trees 1,9
Apple trees for industrial processing 1,4
Dessert pear trees 1,5
Pear trees for industrial processing  
Apricot trees 1,4
Dessert peach and nectarine trees 1,5
Peach and nectarine trees for industrial processing (including group of Pavie) 1,6
Orange trees 1,2
Small citrus fruit trees 1,1
Lemon trees 1,3
Olive trees 1,3 
Table grape vines 1,3 
6.2.8 Additional comments
6.3. Non-sampling error

See sections below.

6.3.1. Coverage error

Census

These questions only apply to censuses. If there is more than one census, please describe the main census below and the additional ones in table 6.3 of the annexed Excel file 
6.3.1.1 Name/Title

Encuesta sobre plantaciones de árboles frutales, olivar y uva de mesa. / Survey on plantations of fruit trees, olives and table grapes

Over-coverage
6.3.1.2 Does the sample frame include wrongly classified units that are out of scope?
6.3.1.3 What methods are used to detect the out-of scope units?
6.3.1.4 Does the sample frame include units that do not exist in practice?
6.3.1.5 Over-coverage - rate
6.3.1.6 Impact on the data quality
Under-coverage
6.3.1.7 Does the sample frame include all units falling within the scope of this survey?
6.3.1.8 If Not, which units are not included?
6.3.1.9 How large do you estimate the proportion of those units? (%)
6.3.1.10 Impact on the data quality
Misclassification
6.3.1.11 Impact on the data quality
Common units
6.3.1.12 Common units - proportion
6.3.1.13 Additional comments


Sample survey

These questions only apply to surveys. If there is more than one survey, please describe the main survey below and the additional ones in table 6.3 of the annexed Excel file 
6.3.1.14 Name/Title

Encuesta sobre plantaciones de árboles frutales, olivar y uva de mesa. / Survey on plantations of fruit trees, olives and table grapes

Over-coverage
6.3.1.15 Does the sample frame include wrongly classified units that are out of scope?
6.3.1.16 What methods are used to detect the out-of scope units?

The nature of the survey (area frame survey) prevents out of scope units.

6.3.1.17 Does the sample frame include units that do not exist in practice? No
6.3.1.18 Over-coverage - rate

Not applicable

6.3.1.19 Impact on the data quality None
Under-coverage 
6.3.1.20 Does the sample frame include all units falling within the scope of this survey? Yes
6.3.1.21 If Not, which units are not included?
6.3.1.22 How large do you estimate the proportion of those units? (%)
6.3.1.23 Impact on the data quality
Misclassification
6.3.1.24 Impact on the data quality None
Common units 
6.3.1.25 Common units - proportion

Not applicable

6.3.1.26 Additional comments

Not Applicable


Administrative data

These questions only apply to administrative sources. If there is more than one administrative source, please describe the main source below and the additional ones in table 6.3 of the annexed Excel file 
6.3.1.27 Name/Title of the administrative source
Over-coverage
6.3.1.28 Does the administrative source include wrongly classified units that are out of scope?
6.3.1.29 What methods are used to detect the out-of scope units?
6.3.1.30 Does the administrative source include units that do not exist in practice?
6.3.1.31 Over-coverage - rate
6.3.1.32 Impact on the data quality
Under-coverage
6.3.1.33 Does the administrative source include all units falling within the scope of this survey?
6.3.1.34 If Not, which units are not included?
6.3.1.35 How large do you estimate the proportion of those units? (%)
6.3.1.36 Impact on the data quality
Misclassification 
6.3.1.37 Impact on the data quality
6.3.1.38 Additional comments
6.3.2. Measurement error

Census

These questions only apply to censuses. If there is more than one census, please describe the main census below and the additional ones in table 6.3 of the annexed Excel file 
6.3.2.1 Name/Title
6.3.2.2 Is the questionnaire based on usual concepts for respondents?
6.3.2.3 Number of censuses already performed with the current questionnaire?
6.3.2.4 Preparatory testing of the questionnaire?
6.3.2.5 Number of units participating in the tests? 
6.3.2.6 Explanatory notes/handbook for surveyors/respondents? 
6.3.2.7 On-line FAQ or Hot-line support for surveyors/respondents?
6.3.2.8 Are there pre-filled questions?
6.3.2.9 Percentage of pre-filled questions out of total number of questions
6.3.2.10 Other actions taken for reducing the measurement error?
6.3.2.11 Additional comments


Sample survey

These questions only apply to surveys. If there is more than one survey, please describe the main survey below and the additional ones in table 6.3 of the annexed Excel file 
6.3.2.12 Name/Title

Survey on plantations of fruit trees, olives and table grapes

6.3.2.13 Is the questionnaire based on usual concepts for respondents? Yes
6.3.2.14 Number of surveys already performed with the current questionnaire?

4

6.3.2.15 Preparatory testing of the questionnaire? Yes
6.3.2.16 Number of units participating in the tests? 

100

6.3.2.17 Explanatory notes/handbook for surveyors/respondents?  Yes
6.3.2.18 On-line FAQ or Hot-line support for surveyors/respondents? Yes
6.3.2.19 Are there pre-filled questions? Yes
6.3.2.20 Percentage of pre-filled questions out of total number of questions

90%

6.3.2.21 Other actions taken for reducing the measurement error?

No

6.3.2.22 Additional comments
6.3.3. Non response error

Census

These questions only apply to censuses. If there is more than one census, please describe the main census below and the additional ones in table 6.3 of the annexed Excel file 
6.3.3.1 Name/Title of the survey
6.3.3.2 Unit non-response - rate
6.3.3.3 How do you evaluate the recorded unit non-response rate in the overall context?
6.3.3.4 Measures taken for minimising the unit non-response
6.3.3.5 If Other, please specify
6.3.3.6 Item non-response rate
6.3.3.7 Item non-response rate - Minimum
6.3.3.8 Item non-response rate - Maximum
6.3.3.9 Which items had a high item non-response rate? 
6.3.3.10 Additional comments


Sample survey

These questions only apply to surveys. If there is more than one survey, please describe the main survey below and the additional ones in table 6.3 of the annexed Excel file 
6.3.3.11 Name/Title of the survey

Survey on plantations of fruit trees, olives and table grapes

6.3.3.12 Unit non-response - rate

1.25%

6.3.3.13 How do you evaluate the recorded unit non-response rate in the overall context? Low
6.3.3.14 Measures taken for minimising the unit non-response Follow-up interviews
6.3.3.15 If Other, please specify
6.3.3.16 Item non-response rate

4.23%

6.3.3.17 Item non-response rate - Minimum

1.43% / Variety

6.3.3.18 Item non-response rate - Maximum

2.01% / Density

6.3.3.19 Which items had a high item non-response rate? 

Orchards Age 1.87%

Density of Plantation  2.01%

Variety  1.43%

6.3.3.20 Additional comments
6.3.4. Processing error

Census

These questions only apply to censuses. If there is more than one census, please describe the main census below and the additional ones in table 6.3 of the annexed Excel file 
6.3.4.1 Name/Title
6.3.4.2 Imputation - rate
6.3.4.3 Imputation - basis
6.3.4.4 If Other, please specify
6.3.4.5 Additional comments


Sample survey

These questions only apply to surveys. If there is more than one survey, please describe the main survey below and the additional ones in table 6.3 of the annexed Excel file 
6.3.4.6 Name/Title

Encuesta sobre plantaciones de árboles frutales, olivar y uva de mesa. / Survey on plantations of fruit trees, olives and table grapes

6.3.4.7 Imputation - rate

6,9% of the land cover in agricultural areas, 77,6% of the land cover in non-agricultural areas

6.3.4.8 Imputation - basis Same unit in previous data
6.3.4.9 If Other, please specify
6.3.4.10 How do you evaluate the impact of imputation on Coefficients of Variation? Not important
6.3.4.11 Additionnal comments

Imputation is made mainly in lower crop index strata.

6.3.5. Model assumption error

Not Applicable

6.4. Seasonal adjustment

Not Applicable

6.5. Data revision - policy

Corrections are made when wrong field information on previous surveys are found.

6.6. Data revision - practice
6.6.1 Data revision - average size

No data revisions have been done

6.6.2 Were data revisions due to conceptual changes (e.g. new definitions)  carried out since the last quality report?
6.6.3 What was the main reason for the revisions?
6.6.4 How do you evaluate the impact of the revisions?
6.6.5 Additional comments


7. Timeliness and punctuality Top
7.1. Timeliness
7.1.1 When were  the first  results for the reference period published?

October 2018

7.1.2 When were  the final results for the reference period published?

October 2018

7.1.3 Reasons for possible long production times?
7.2. Punctuality
7.2.1 Were data released nationally according to a pre-announced schedule (Release Calendar)? Yes
7.2.2 If Yes, were data released on the target date? Yes
7.2.3 If No, reasons for delays?
7.2.4 Number of days between the national release date of data and the target date

0


8. Coherence and comparability Top
8.1. Comparability - geographical

To be assessed by Eurostat

8.1.1. Asymmetry for mirror flow statistics - coefficient

Not Applicable

8.2. Comparability - over time
8.2.1 Length of comparable time series

2007 - 2017

8.2.2 Have there been major breaks in the time series? No
8.2.3 If Yes, please specify the year of break and the reason
8.2.4 Additional comments
8.3. Coherence - cross domain
8.3.1 With which other national data sources have the data been compared? Annual crop statistics 2017
8.3.2 If Other, please specify
8.3.3 Describe briefly the results of comparisons

Results should be expressed as percentage deviation from the corresponding areas in the orchard survey.

  Annual Crop Statistics (2017) FSS (2016) IACS Other source
Dessert apple trees  2.03%      
Apple trees for industrial processing -80.99%       
Dessert pear trees -6.64%       
Pear trees for industrial processing        
Apricot trees 12.74%       
Dessert peach and nectarine trees -15.09%       
Peach and nectarine trees for industrial processing (including group of Pavie) -68.13%       
Orange trees -4.01%       
Small citrus fruit trees -7.53%       
Lemon trees -10.16%        
Olive trees  -1.96%      
Table grape vines -14.92%       
8.3.4 If no comparisons have been made, explain why
8.3.5 Additional comments
8.4. Coherence - sub annual and annual statistics

Not Applicable

8.5. Coherence - National Accounts

Annual Crop Statistics is the source for National Accounts. See 8.3.3

8.6. Coherence - internal

Time series and regional figures are coherent for the fruit trees coverd by the survey


9. Accessibility and clarity Top
9.1. Dissemination format - News release
9.1.1 Do you publish a news release? No
9.1.2 If Yes, please provide a link
9.2. Dissemination format - Publications
9.2.1 Do you produce a paper publication? No
9.2.2 If Yes, is there an English version?
9.2.3 Do you produce an electronic publication? Yes
9.2.4 If Yes, is there an English version? No
9.2.5 Please provide a link
9.3. Dissemination format - online database
9.3.1 Data tables - consultations

Not Available

9.3.2 Is an on-line database accessible to users? Yes
9.3.3 Please provide a link

https://www.mapa.gob.es/es/estadistica/temas/estadisticas-agrarias/agricultura/encuestas-plantaciones-arboles-frutales/


9.4. Dissemination format - microdata access
9.4.1 Are micro-data accessible to users? No
9.4.2 Please provide a link
9.5. Dissemination format - other
9.6. Documentation on methodology
9.6.1 Are national reference metadata files available? No
9.6.2 Please provide a link
9.6.3 Are methodological papers available? Yes
9.6.4 Please provide a link

https://www.mapa.gob.es/es/estadistica/temas/estadisticas-agrarias/01018_ENCUESTA%20BASE%20PLANTACIONES%20FRUTALES_tcm30-122675.pdf


9.6.5 Is a handbook available? Yes
9.6.6 Please provide a link

https://www.mapa.gob.es/es/estadistica/temas/estadisticas-agrarias/METODOLOG%C3%8DA%20DE%20LA%20ESYRCE_tcm30-122313.pdf

9.7. Quality management - documentation
9.7.1 Metadata completeness - rate

Not available

9.7.2 Metadata - consultations

Not available

9.7.3 Is a quality report available? No
9.7.4 Please provide a link


10. Cost and Burden Top
10.1 Efficiency gains if compared to the previous quality report Further training
10.2 If Other, please specify
10.3 Burden reduction measures since the previous quality report Other
10.4 If Other, please specify

 There are not personal interviews. The interviewers collect directly the data by direct observation


11. Confidentiality Top
11.1. Confidentiality - policy
11.1.1 Are confidential data transmitted to Eurostat? No
11.1.2 If yes, are they confidential in the sense of Reg. (EC) 223/2009?
11.1.3 Describe the data confidentiality policy in place
11.2. Confidentiality - data treatment
11.2.1 Describe the procedures for ensuring confidentiality during dissemination

 Area frame with no microdata dissemination

11.2.2 Additional comments


12. Comment Top


Related metadata Top


Annexes Top
ESQRS_ANNEX_ES