 |
|
 |
|
| For any question on data and metadata, please contact: EUROPEAN STATISTICAL DATA SUPPORT |
|
|||
| 1.1. Contact organisation | INSEE - Institut National de la Statistique et des Études Économiques |
||
| 1.2. Contact organisation unit | Directorate of Demographic and Social Statistics, Department for Employment and Working Income, Earnings and Working Income Division. |
||
| 1.5. Contact mail address | INSEE 18, Boulevard Adolphe Pinard, F-75675 Paris Cedex 14 |
||
|
|||
| 2.1. Data description | |||
As for the 2008 LCS, the response on the 2012 LCS delivered by the Insee to Eurostat in the summer of 2014 is the result of the concatenation of the data collected by the annual surveys on the labour cost and the earnings structure (ECMOSS) in 2011 and 2012 (labour cost version), after the data collected were updated in 2011. The situation of each employee in the 2011 survey is updated by comparing employees with the same characteristics in 2012. Compared to 2008, the field for the annual surveys was extended to include employees of the local and regional authorities. Apart from these two concatenated surveys, the 2012 LCS file also includes government staff for whom an additional survey was conducted in order to supplement the field in accordance with the Regulation. |
|||
| 2.2. Classification system | |||
Not available. |
|||
| 2.3. Coverage - sector | |||
Not available. |
|||
| 2.4. Statistical concepts and definitions | |||
Not available. |
|||
| 2.5. Statistical unit | |||
Not available. |
|||
| 2.6. Statistical population | |||
Not available. |
|||
| 2.7. Reference area | |||
Not available. |
|||
| 2.8. Coverage - Time | |||
Not available. |
|||
| 2.9. Base period | |||
Not available. |
|||
|
|||
- |
|||
| 3.1. Source data | |||
Variables from administrative sourcesIn order to lighten the response burden on establishments, the INSEE has used the Annual Declarations of Social Data (DADS) as an external source of information. This source is used upstream of the survey to set the number of establishments and employees to be sampled per stratum. It is also used as a sample base for employees (the validity N-1 of the DADS is then used for the validity N of ECMOSS). The DADS provide information at employer and employee level: they contain variables relating to employer establishments, their employees (age, gender, etc.), the characteristics of the jobs and the corresponding pay. In the company, these declarations concern all employees receiving a wage or salary, irrespective of the amount or duration of employment, and are intended primarily for social security institutions and for the tax administration. They allow the tax administration to determine the base of certain taxes on earnings and to check the amount of income declared by employees. The social security institutions use it to calculate certain contributions owed by employers, control the payment of all their contributions and manage the individual accounts of employees in order to determine their entitlement to retirement pensions and to sickness insurance coverage. The INSEE is also the official recipient of these declarations, with a view to developing statistics on employment and earnings. The advantage of this source is that it is practically exhaustive. Furthermore, the information concerning pay is usually of good quality because it serves as a basis for fiscal and social calculations. The DADS source is also used downstream of the survey. Some DADS variables, also present in the survey questionnaire, are in fact used during the correction phase to deal with partial non-response or check the quality of the variables, in particular total gross remuneration, the number of paid hours, the duration of pay in days and the work quota. The validity N of the DADS is then used to correct the validity N of the ECMOSS. Information on benefits in kind is taken from the DADS. Lastly, for trainees, earnings, the number of paid hours, the duration of pay in days and the work quota entered in the 2012 LCS come from the 2012 DADS. Processing of sections O and P of the Civil ServiceThe ECMOSS survey covers the field of regional civil service establishments (FPT, section O). It also includes the private part of the education sector (division 85, section P), which represents a very small part of the education sector in France. The response corresponding to Eurostat for this field is therefore based on a methodology identical to that for the rest of the field. However, the survey does not cover sections O and P of the civil service[9]. With a view to responding to Eurostat's request for the entire section O (public administration) and section P (education), including the majority parts of relating to the civil service, the ECMOSS data have been supplemented by data taken from administrative sources, and from the additional survey of civil service employees in 2010, used to estimate hours worked in the sections O and P of the civil service. Four sources were used to estimate the labour cost in sectors O and P of the civil service: - The pay statements of civil servants (SIASP) for staff numbers, the wage bill, the actual social contributions and paid hours; - The data from the DGAFP and the DGFIP to obtain information on expenditure linked to training, recruitment and social action; - The survey of civil service employees to estimate a ratio of 'hours worked to paid hours'; - The data from the national accounts to estimate subsidies received by the employer. The pay statements for civil servants (SIASP) are the main source for measuring staff numbers, the wage bill and paid hours in the public education sector in 2012. These files can be used to count staff in the entire education system (establishments under the Ministry of Education, teaching establishments under other ministries, public establishments, teachers under contract in the private sector). Contrary to the 2004 and 2008 LCSs, the 2012 LCS provides data on the number of paid hours (variable entered in SIASP) and on the number of hours worked (ratio 'hours worked to paid hours' estimated in the survey of civil servants in 2010) in sections O and P of the civil service. [9] The ECMOSS survey is not organised in a way suitable for questioning civil service establishments. |
|||
| 3.2. Frequency of data collection | |||
[Not requested] |
|||
| 3.3. Data collection | |||
[Not requested] |
|||
| 3.4. Data validation | |||
[Not requested] |
|||
| 3.5. Data compilation | |||
[Not requested] |
|||
| 3.6. Adjustment | |||
[Not requested] |
|||
|
|||
| 4.1. Quality assurance | |||
Not available. |
|||
| 4.2. Quality management - assessment | |||
[Not requested] |
|||
|
|||
- |
|||
| 5.1. Relevance - User Needs | |||
SES and LCS survey match Eurostat request concerning french salary structure and labor cost. |
|||
| 5.2. Relevance - User Satisfaction | |||
[Not requested] |
|||
| 5.3. Completeness | |||
The compulsory variables requested by the Eurostat Regulation have been provided. |
|||
| 5.3.1. Data completeness - rate | |||
[Not requested] |
|||
|
||||||||||||||||||||||||||||||||||||
- |
||||||||||||||||||||||||||||||||||||
| 6.1. Accuracy - overall | ||||||||||||||||||||||||||||||||||||
Sampling of the 2011 and 2012 ECMOSSThe population in question comprises all employees in companies with ten or more employees, established in metropolitan France and working in sections B to S of the NAF, with the exception of non-market education services and civil service employees (taken from the legal category). The method used to take the 2011 and 2012 ECMOSS samples is the same as for the 2007 to 2010 ECMOSS which were used to deliver the 2008 LCS and the 2010 SES. It is a sampling plan stratified into two stages, the first stage comprising establishments and the second comprising employees in these establishments. The aim of stratification is to improve accuracy of the estimate by creating population subsets which differ significantly and which are relatively uniform in themselves in terms of the variable of interest. The ECMOSS sampling plan was optimised in order to minimise the variance of the hourly wage estimator. Indeed, this variable is available in the sampling frame and is strongly correlated to the hourly cost, which would be the ideal stratification variable in ECMOSS, in its LCS dimension. However, this variable is not available in the sampling base. In order to produce this sample plan, it was needed to know the dispersion of the hourly wage over the sub-domains. If the hourly wage is highly dispersed with few individuals sampled, the probability of identifying the real average value is low, since we may have used individuals with hourly wages which differ substantially from each other, thereby making the average very inaccurate. Conversely, if there is little dispersion, a small group of individuals can be used without overly undermining quality. For the 2011 LCS, the sampling frame used is the file of 2010 Annual Declarations of Social Data (DADS, Déclarations Annuelles des Données Sociales). The DADS samples are of those present as at 31/12/2010, which suggests that they will be present at least for part of 2011 in the establishment in question). Likewise, the 2011 DADS used for the 2012 ECMOSS are of those present as at 31/12/2011. The strata chosen in the sampling plan are developed from the crossing of four variables (sector of activity, business size, establishment size and location). The combination of these different classes gives a total of 910 strata. Sector of activity (sub-sections of the NACE Rev. 2 or groups of sub-sections) 'BB' = Extracting industries (section B) 'AT' = Food, beverages, tobacco (sub-section CA) 'TH' = Textiles, clothing, wood, paper (CB+CC) 'RC' = Refining, chemicals, pharmaceutics, plastic, other minerals (CD+CE+CF+CG) 'MM' = Metals, machines - electronics, electrics, IT, automobile (CH+CI+CJ+CK+CL) 'MR' = Furniture, repairs (CM) 'ED' = Electricity, gas, water, sanitation, waste (D+E no distinction is made here between sanitation and depollution of the remaining waste) 'FF' = Construction (F) 'GG' = Trade (G) 'HH' = Post and transport (no communication - H) 'II' = Accommodation, catering (I) 'JJ' = Information, communication (J) 'KK' = Finance (K) 'LL' = Property (L) 'MA' = Legal, accounting, engineering and technical activities (MA+part of MC) 'MB' = Scientific research and development, specialised and veterinary scientific activities (MB+part of MC) 'NN' = Administrative and support service activities (N) 'PP' = Education (P) 'QQ' = Human health and social action (Q) 'SR' = Arts, entertainment (R) 'SR' = Other services (S) Region of location 'IDFR' = Île-de-France (Z1) 'NEST' = North and East (Picardy, Champagne-Ardenne, Bourgogne and Z3 and Z4) 'OUES' = West and South-West (Centre and Normandy and Z5 and Z7) 'SUDE' = Centre East and Mediterranean (Z8 and Z9) Some modalities were grouped into 'TTZT' = all ZEAT, or with the sole distinction Île-de-France ('IDFR') / Other ZEAT ('AUTZ'). Business size 'TEG1' = from 10 to 49 employees 'TEG2' = from 50 to 499 employees 'TEG3' = 500 employees or more Establishment size 'A1' = from 1 to 9 employees 'A2' = from 10 to 19 employees 'A3' = from 20 to 99 employees 'A4' = from 100 to 499 employees 'A5' = 500 employees or more The sample was divided between the strata in such a way as to minimise the variance in the estimator of hourly wage in the strata, with a minimum number of establishments per stratum (Neyman allocation subject to restriction). The procedure is therefore, successively, a calculation of the minimum number of establishments in each stratum with a given precision objective, a Neyman allocation of the number of establishments (1st stage), a calculation of the minimum number of employees to achieve the accuracy objective for each stratum and, lastly, a Newman allocation subject to restrictions as to the number of employees (2nd stage). For employees, the allocation is made by distinguishing executives from non-executives in each pre-defined stratum. Accuracy of the 2012 estimatesThe most important variable of interest in the survey is the hourly labor cost. The most relevant precision calculations and confidence intervals therefore concern this variable of interest, using the two survey years 2011 and 2012, as was the case for the results submitted to Eurostat, to make these estimates more reliable. For submission of the 2012 LCS to Eurostat, data were updated from 2011 to 2012[1] on a fine but aggregate level (NACE cross-referencing by sector of activity, NUTS, sizes of businesses) and not at individual level (establishment or employee level). Data were updated at individual level a posteriori for the precision calculations below. The results submitted to Eurostat pose an additional difficulty for precision calculations because they combine variables available at employee level (234 116 employees in total over the two years), and variables available only at establishment level (26 767 establishments in total over two years). Due to these two difficulties (on the one hand, the need to postpone updating the 2011 data at individual level and on the other hand the combination of data on establishments and employees), we have had to use an estimator of the hourly cost to implement the precision calculation which differs slightly from the one sent to Eurostat. This estimator allows for precision calculations by bootstrap method which were impossible to make using the initial estimator sent to Eurostat. This estimator is calculated using the tables on establishments and not the strata, as is the case for the estimator of the hourly cost sent to Eurostat. It was therefore chosen to estimate precision based on two variables: hourly wage[2], defined as earnings in relation to the hours worked, set out in the file on employees (2011 and 2012) not including trainees, and the global hourly cost, defined as the labour cost related to the hours worked, calculated from the files on employees and the files on establishments from both years (2011 having been updated). To calculate the hourly cost, it was chosen to truncate the tails of distribution of the hourly cost. Indeed, some establishments had hourly costs which were particularly far from the average and could not be corrected. It was therefore chosen to truncate the 0.5% of establishments with the lowest hourly costs and the 0.5% of establishments with the highest hourly costs. This method allows to exclude from the analysis a significant number of establishments for which we have a strong indication of incorrect values[3]. [1] The update method is explained in the Section 'Adjustment rate'. [2] The hourly wage here does not include benefits in kind or payments for days not worked and paid holidays (which are part of the 'establishments' questionnaire), resulting in a marginal difference. [3] The truncation is only for precision calculations. This method does not significantly change the indicators of dispersion of the hourly cost, with the exception of the indicators for the section NACE D. |
||||||||||||||||||||||||||||||||||||
| 6.2. Sampling error | ||||||||||||||||||||||||||||||||||||
Refer to 'Sampling error indicator'. |
||||||||||||||||||||||||||||||||||||
| 6.2.1. Sampling error - indicators | ||||||||||||||||||||||||||||||||||||
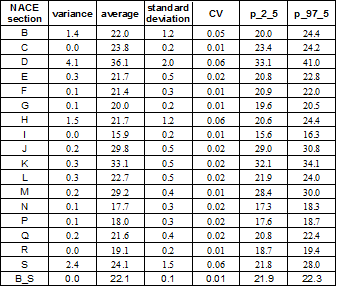
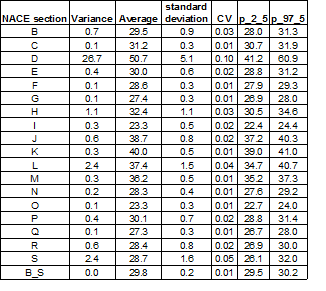
The tables below present empirical precision information obtained by bootstrap with 1 000 replications (where CV = coefficient of variation, p_2_5 and p_97_5 are the percentiles 2.5% and 97.5% respectively of the distribution of the bootstrap estimates, i.e. the lower and upper limits of the 95% confidence intervals). Variance of hourly wage (earnings in relation to hours worked) by sector (not including trainees):
Variance of hourly labour cost (cost in relation to the hours worked), by sector:
|
||||||||||||||||||||||||||||||||||||
| 6.3. Non-sampling error | ||||||||||||||||||||||||||||||||||||
Refer to sub-part of non sampling error for more information. |
||||||||||||||||||||||||||||||||||||
| 6.3.1. Coverage error | ||||||||||||||||||||||||||||||||||||
Firms with less than 10 employees are not covered by the survey. |
||||||||||||||||||||||||||||||||||||
| 6.3.1.1. Over-coverage - rate | ||||||||||||||||||||||||||||||||||||
nothing to declare |
||||||||||||||||||||||||||||||||||||
| 6.3.1.2. Common units - proportion | ||||||||||||||||||||||||||||||||||||
[Not requested] |
||||||||||||||||||||||||||||||||||||
| 6.3.2. Measurement error | ||||||||||||||||||||||||||||||||||||
To avoid measurement and processing errors, the INSEE has integrated a data control software program into the IT application for monitoring the survey. This software program ensures consistency between data, so as to quickly detect outliers. It can be checked automatically, for example, that the elements included in a total amount are lower than that amount. Large-scale orders can also be checked using the data distributions from the previous survey. For instance, it is possible to detect and correct input and scanning errors, the amounts taken from the accounts of the business and not from the establishment, or the calculation errors of the respondents which can even go so far as multiplying or dividing a given amount by 10. |
||||||||||||||||||||||||||||||||||||
| 6.3.3. Non response error | ||||||||||||||||||||||||||||||||||||
Total non-response errorsResponse rate Out of the two ECMOSS surveys in 2011 and 2012, 34 090 establishments received the questionnaires. 28 846 responses were usable, representing a response rate of 84.6%. This figure of 28 846 usable responses from establishments is slightly higher than the number of establishments for which a response is available (26 767) because some of the establishments were questioned in both survey years[4]. Processing operations for total non-response The final weightings for employees are obtained from the initial sample weights and by aligning the structures of the samples of employees and establishments. The total non-response is first removed from the files (the weights are recalculated according to non-respondents). Indeed, where a unit is non-respondent, its weight is reallocated in a uniform manner over the units belonging to the same stratum. The weights are then adjusted to the margins taken from the 2011 and 2012 DADS for each file. For the key variables available in the administrative sources, the total obtained from our files is thus representative of the known total for the exhaustive survey. The files on establishments and employees are aligned and the margins are selected using the same parameters. The margins set are as follows : - business size - sector * Île-de-France/province - public / private Other margins are taken into account for employees: - The cross-referencing of cs * gender (adjustment according to the socioprofessional category of the DADS); The margins in the population are calculated using the DADS file corresponding to the year of survey. They contained all the employees of companies which employed at least ten employees in 2011 and 2012, in the field corresponding to the 2012 ECMOSS. This adjustment to margins was done using the Calmar[5] macro. Partial non-response errorsProcessing operations for partial non-response The data submitted to Eurostat are aggregate data. The annual employees and establishments questionnaires used to develop final recapitulative aggregates of the cost are subject to processing operations for partial non-response. For the establishment questionnaire, the absence of response to certain key variables (no response to an entire part, for example no response concerning charges or payroll) results in these establishments being classed under total non-response. These responses have therefore been completely deleted. For the other types of non-response, the majority of missing or incorrectly completed responses have been corrected by 'hotdeck' (method of imputing missing values based on values from respondents with the same characteristics - chosen in the same business, or else in the same sector with a similar or almost similar business size, or, as a last resort, by random imputation). For the employee questionnaire, it was also necessary to impute a certain number of variables. Generaly, a variance analysis model was used, by decreasing the variable to be imputed on other amounts (hours, total pay, etc.). For example, when the response to the part time or full time question was missing, we modelled the probability that an employee would be working part time with a logistical regression, using the explanatory variables of gender, the CS, business size, sector of activity of the establishment, level of qualification and contract type. Furthermore, in the ECMOSS 2011 employee questionnaire, absences could be declared only on two entries instead of four as in previous years. The absences declared in hours and absences of more than 100 days (relatively few but with a significant impact on the calculation of hours worked) were thus truncated and those above or equal to ten potentially truncated. To remedy this problem, we resorted to a 'colddeck' imputation. 'Colddeck' is a variation of 'hotdeck', where the closest neighbour is not sought from among the other respondents to the survey but from among individuals from an external source. We have used the 2012 ECMOSS employee file here as an external source. More precisely, for each individual potentially affected in the 2011 ECMOSS file, we have imputed the absences of ten days or more by searching in the 2012 ECMOSS file for an individual with identical characteristics. Processing operations for the 2012 update of data from 2011 The DADS were used to update the 2011 ECMOSS. Based on the DADS, it was first estimated a 2012-2011 rate of change in hourly wage[6] at sectoral level. The employee numbers and hours in 2011 were considered as constants; employees in 2011 and the survey costs in 2011 were updated using the rates of change set out above. Once the 2012 data were updated, the final estimator of the aggregate of a stratum consisted of an arithmetical average of the updated 2011 value and the 2012 value. [4] The double questioning of certain establishments in the ECMOSS survey is obligatory given the structure of the sample plan of this survey in two consecutive stages: establishments then employees. For instance, the more employees an establishment has within one stratum, the more likely it is to be questioned in both years. In this case, it was decided to keep only the latest and most comprehensive information. [5] CALage sur MARges, an interactive method making it possible to amend the weights of the entries in a cross-tabulation to obtain a priori fixed margins. [6] Paid hours were used because hours worked are not available in this source. |
||||||||||||||||||||||||||||||||||||
| 6.3.3.1. Unit non-response - rate | ||||||||||||||||||||||||||||||||||||
[Not requested] |
||||||||||||||||||||||||||||||||||||
| 6.3.3.2. Item non-response - rate | ||||||||||||||||||||||||||||||||||||
[Not requested] |
||||||||||||||||||||||||||||||||||||
| 6.3.4. Processing error | ||||||||||||||||||||||||||||||||||||
Refer to 'Imputation - rate'. |
||||||||||||||||||||||||||||||||||||
| 6.3.4.1. Imputation - rate | ||||||||||||||||||||||||||||||||||||
Adjustment rate of the Eurostat variables The adjustment rate for a variable corresponds to the number of individuals in this variable (weighted according to their percentage of the total number) whose response was adjusted in order to create the corresponding variable. The variables of the 2011 ECMOSS were adjusted in the same way as those for the 2012 ECMOSS (except for the additional adjustment linked to the update in 2012). The adjustment rates are given here solely for the 2012 ECMOSS survey. The adjustment rates per Eurostat variable are often equal to the weighted sum of survey variables. Once a constituent variable has been adjusted, the corresponding Eurostat variable is considered to have been adjusted. Each component of a Eurostat variable has therefore been included according to its weight in the Eurostat aggregate to which it belongs. The final adjustment indicator is therefore written as a weighted sum of the adjustment indicators for each of the variables in the calculation of the final Dx Eurostat aggregates. No components of these variables taken from data external to the questionnaires are included. Only the adjustment rates per constitutive variable of the cost are shown here. The adjustment rate per Eurostat variable is as follows:
The variables D2 and D4 are created from questions to which a response at business level is authorised. These responses at business level are frequent and are corrected to obtain a response at establishment level (breakdown of the business response according to the payroll pro rata). This explains the high rate of adjustment for these variables. |
||||||||||||||||||||||||||||||||||||
| 6.3.5. Model assumption error | ||||||||||||||||||||||||||||||||||||
Business with fewer than ten employees are not covered by the survey. |
||||||||||||||||||||||||||||||||||||
| 6.4. Seasonal adjustment | ||||||||||||||||||||||||||||||||||||
[Not requested] |
||||||||||||||||||||||||||||||||||||
| 6.5. Data revision - policy | ||||||||||||||||||||||||||||||||||||
[Not requested] [Not requested] |
||||||||||||||||||||||||||||||||||||
| 6.6. Data revision - practice | ||||||||||||||||||||||||||||||||||||
[Not requested] |
||||||||||||||||||||||||||||||||||||
| 6.6.1. Data revision - average size | ||||||||||||||||||||||||||||||||||||
[Not requested] |
||||||||||||||||||||||||||||||||||||
|
|||
- |
|||
| 7.1. Timeliness | |||
Data were send to Eurostat on July 2014. And publish by the national institut of statistic on January 2015. |
|||
| 7.1.1. Time lag - first result | |||
[Not requested] |
|||
| 7.1.2. Time lag - final result | |||
[Not requested] |
|||
| 7.2. Punctuality | |||
For the 2011 ECMOSS, the survey schedule was very close to that described below for the 2012 ECMOSS, with a one-year gap. For the 2012 ECMOSS, the survey schedule is as follows: - the letters of announcement were sent in March 2013; - the questionnaires were received by establishments in May 2013; - in July 2013, establishments which had not responded to either the establishment questionnaire or the employees questionnaires received a reminder; businesses which still had not responded received a further reminder in September 2013, where necessary followed by a formal request to reply within ten days; - lastly, an acknowledgement of non-response was established in October for any businesses which still had not responded. From the dispatch of the questionnaires until the end of collection, a team of managers acted as contact persons and responded to requests from the businesses (answering questions, extending deadlines, etc.). It also checked the questionnaires, and contacted businesses which had made major errors. So as not to call businesses back too long after they had returned the questionnaire, entries were made on an ongoing basis from the first responses from establishments. The data codification and adjustment phase continued until the data were went to Eurostat in July 2014. |
|||
| 7.2.1. Punctuality - delivery and publication | |||
[Not requested] |
|||
|
|||||||||||||||||||||||||||||||||||||||||||||||||||||||||||||||||||||||||||||||||||||||||||||||||||||||||||||||||||||||||||||||||||||||||||||||||||||||||||||||||||||||||||||||||||||||||||||||||||||||||||||||||||||||||||||||||||||||||||||
- - |
|||||||||||||||||||||||||||||||||||||||||||||||||||||||||||||||||||||||||||||||||||||||||||||||||||||||||||||||||||||||||||||||||||||||||||||||||||||||||||||||||||||||||||||||||||||||||||||||||||||||||||||||||||||||||||||||||||||||||||||
| 8.1. Comparability - geographical | |||||||||||||||||||||||||||||||||||||||||||||||||||||||||||||||||||||||||||||||||||||||||||||||||||||||||||||||||||||||||||||||||||||||||||||||||||||||||||||||||||||||||||||||||||||||||||||||||||||||||||||||||||||||||||||||||||||||||||||
European comparability The NUTS (region in which the establishment is located), SIZE (size of company) and NACE (economic activity at division level) variables are taken from the business register. The other variables come from the establishments' responses to the questionnaires on employees. |
|||||||||||||||||||||||||||||||||||||||||||||||||||||||||||||||||||||||||||||||||||||||||||||||||||||||||||||||||||||||||||||||||||||||||||||||||||||||||||||||||||||||||||||||||||||||||||||||||||||||||||||||||||||||||||||||||||||||||||||
| 8.1.1. Asymmetry for mirror flow statistics - coefficient | |||||||||||||||||||||||||||||||||||||||||||||||||||||||||||||||||||||||||||||||||||||||||||||||||||||||||||||||||||||||||||||||||||||||||||||||||||||||||||||||||||||||||||||||||||||||||||||||||||||||||||||||||||||||||||||||||||||||||||||
[Not requested] |
|||||||||||||||||||||||||||||||||||||||||||||||||||||||||||||||||||||||||||||||||||||||||||||||||||||||||||||||||||||||||||||||||||||||||||||||||||||||||||||||||||||||||||||||||||||||||||||||||||||||||||||||||||||||||||||||||||||||||||||
| 8.2. Comparability - over time | |||||||||||||||||||||||||||||||||||||||||||||||||||||||||||||||||||||||||||||||||||||||||||||||||||||||||||||||||||||||||||||||||||||||||||||||||||||||||||||||||||||||||||||||||||||||||||||||||||||||||||||||||||||||||||||||||||||||||||||
- Public administration is now covered. The responses submitted to Eurostat concerning the labour cost in 2008 did not cover section O. To provide responses for public administration, the 2011 and 2012 surveys also included the civil service by means of a specific questionnaire. The civil service was added thanks to the use of administrative data and an additional survey of its employees. - Construction of variables for basic earnings (D11111) and exceptional earnings (D11112) Between 2008 and 2012, the definition of the basic earnings perimeter (the earnings paid for each pay period) and its supplement, the exceptional earnings (paid on an irregular basis) was amended. In 2008, exceptional earnings were composed of all premiums. In 2012, they comprised premiums not including seniority premiums and premiums for job constraints, and for collective and individual performances. Compared to 2008, premiums for individual and collective performances have thus been integrated into basic earnings; however, the difference between total premiums and the various detailed premiums (13th month, end-of-year bonus, benefits in kind, etc.) is removed, to ensure consistency with the last submission in SES format in 2010. - Earnings of trainees In 2008, the response for trainees was developed from the responses to the survey. Over the two years of data collection, just over 2 000 trainees were surveyed. This is not enough to produce reliable estimates at a fine level. In 2012, the response for trainees was created by including all the trainees of the establishments surveyed. The earnings and paid hours come from the DADS; the social security contribution rates and the ratio of hours worked to paid hours come from the survey. Furthermore, the hours worked for surveyed trainees are estimated in the same way as for other employees. We then apply the ratio of hours worked/paid hours, broken down by sector, to the paid hours for all the trainees of the surveyed establishments included in the DADS. |
|||||||||||||||||||||||||||||||||||||||||||||||||||||||||||||||||||||||||||||||||||||||||||||||||||||||||||||||||||||||||||||||||||||||||||||||||||||||||||||||||||||||||||||||||||||||||||||||||||||||||||||||||||||||||||||||||||||||||||||
| 8.2.1. Length of comparable time series | |||||||||||||||||||||||||||||||||||||||||||||||||||||||||||||||||||||||||||||||||||||||||||||||||||||||||||||||||||||||||||||||||||||||||||||||||||||||||||||||||||||||||||||||||||||||||||||||||||||||||||||||||||||||||||||||||||||||||||||
[Not requested] |
|||||||||||||||||||||||||||||||||||||||||||||||||||||||||||||||||||||||||||||||||||||||||||||||||||||||||||||||||||||||||||||||||||||||||||||||||||||||||||||||||||||||||||||||||||||||||||||||||||||||||||||||||||||||||||||||||||||||||||||
| 8.3. Coherence - cross domain | |||||||||||||||||||||||||||||||||||||||||||||||||||||||||||||||||||||||||||||||||||||||||||||||||||||||||||||||||||||||||||||||||||||||||||||||||||||||||||||||||||||||||||||||||||||||||||||||||||||||||||||||||||||||||||||||||||||||||||||
Changes in the hourly wage are less dramatic in the ECMOSS than in the other external sources (in particular the LCI and Comptabilité Nationale (National Accounts)). These differences are linked to a slower progression in hourly wages in the DADS on which the ECMOSS is based. Comparison of annual average developments (between 2008 and 2012) in hourly wage in the ECMOSS and in other external sources
Hourly cost has progressed more than hourly wage. The following table shows the difference in points between changes in cost and changes in earnings alone. Overall, the difference is similar in all three sources.
By comparing hours worked per employee (for the entire economy) in the ECMOSS and in the Enquête Emploi en Continu (LFS Labor Force Survey), it can be observed that this level is significantly lower in the 2012 ECMOSS than in the ECC of the same year. This difference can be partly explained by differences in fields. Indeed, in the ECMOSS, only establishments with more than ten employees are questioned, whereas the LFS survey draws on all traditional households. The source of discrepancy comes from the fact that in the ECMOSS, we have a declaration of the number of hours worked per year, whereas in the LFS we have a number of hours worked by standard working week, which is multiplied by the number of weeks in a year (holidays, persons working on a flat-rate basis, etc. are therefore not taken into account). There is also an estimate of the effective annual duration of work, taking into account the days of absence calculated by the Ministry of Labour and Employment (DARES) based on data from the LFS. This estimate is closer to the results of the ECMOSS because it takes into account days of absence, but is not directly comparable to the ECMOSS since it is calculated on the basis of all sectors of activity and for all sizes of businesses (the estimate taken from the ECMOSS is calculated only using businesses with more than ten employees belonging to NACE sectors of activity B to S). Conversely, the wage and salary difference per employee in the commercial sector observed between the ECMOSS and the Statistiques Structurelles d’Entreprises (SBS, Structural Business Statistics) survey is relatively low in 2012. Here again, the difference between the two sources can be explained by the fact that the ECMOSS is limited to establishments with more than ten employees. Likewise, the average pay of an employee (for all sectors of activity in the economy) estimated in the ECMOSS is close to that calculated by the National Accounts (business with fewer than ten employees are still not included in the ECMOSS).
[7] For the Labor Force Survey, the number of hours worked in a standard working week was multiplied by the number of weeks in one year. According to the DARES, the annual number of hours actually worked by an employee was 1 552 hours in France in 2012 (all sectors and all sizes together). [8] Not available. To date, the Insee has not published an LCI relating to the aggregate BS. [Not requested] |
|||||||||||||||||||||||||||||||||||||||||||||||||||||||||||||||||||||||||||||||||||||||||||||||||||||||||||||||||||||||||||||||||||||||||||||||||||||||||||||||||||||||||||||||||||||||||||||||||||||||||||||||||||||||||||||||||||||||||||||
| 8.4. Coherence - sub annual and annual statistics | |||||||||||||||||||||||||||||||||||||||||||||||||||||||||||||||||||||||||||||||||||||||||||||||||||||||||||||||||||||||||||||||||||||||||||||||||||||||||||||||||||||||||||||||||||||||||||||||||||||||||||||||||||||||||||||||||||||||||||||
[Not requested] |
|||||||||||||||||||||||||||||||||||||||||||||||||||||||||||||||||||||||||||||||||||||||||||||||||||||||||||||||||||||||||||||||||||||||||||||||||||||||||||||||||||||||||||||||||||||||||||||||||||||||||||||||||||||||||||||||||||||||||||||
| 8.5. Coherence - National Accounts | |||||||||||||||||||||||||||||||||||||||||||||||||||||||||||||||||||||||||||||||||||||||||||||||||||||||||||||||||||||||||||||||||||||||||||||||||||||||||||||||||||||||||||||||||||||||||||||||||||||||||||||||||||||||||||||||||||||||||||||
Care should be taken when comparing the figures in the National Accounts and ECMOSS columns. Indeed, there are a number of differences between the concepts in the ECMOSS survey and those in the National Accounts. - First of all, the ECMOSS field is limited to businesses with more than ten employees in metropolitan France, whereas the National Accounts includes businesses of every size, including those in the overseas territories. - Classification by activity is based on a branch concept in the National Accounts, whereas it is based on a sectoral concept in the ECMOSS. Under the branch concept, similar units of economic activity are included in one branch. For instance, units of activity by the same business can be allocated to different branches. Conversely, the concept of sector of activity organises businesses according to their main activity. This difference can therefore explain the discrepancies between the various activities but not at global level. - Lastly, the payroll calculated by the National Accounts includes broader concepts than those included in the ECMOSS (tips, the pay of majority shareholder-managers of companies and expenditure for paid leave funds). These conceptual differences may explain the discrepancies in certain NACE (accommodation, catering and construction in particular). |
|||||||||||||||||||||||||||||||||||||||||||||||||||||||||||||||||||||||||||||||||||||||||||||||||||||||||||||||||||||||||||||||||||||||||||||||||||||||||||||||||||||||||||||||||||||||||||||||||||||||||||||||||||||||||||||||||||||||||||||
| 8.6. Coherence - internal | |||||||||||||||||||||||||||||||||||||||||||||||||||||||||||||||||||||||||||||||||||||||||||||||||||||||||||||||||||||||||||||||||||||||||||||||||||||||||||||||||||||||||||||||||||||||||||||||||||||||||||||||||||||||||||||||||||||||||||||
[Not requested] |
|||||||||||||||||||||||||||||||||||||||||||||||||||||||||||||||||||||||||||||||||||||||||||||||||||||||||||||||||||||||||||||||||||||||||||||||||||||||||||||||||||||||||||||||||||||||||||||||||||||||||||||||||||||||||||||||||||||||||||||
|
|||
- |
|||
| 9.1. Dissemination format - News release | |||
[Not requested] |
|||
| 9.2. Dissemination format - Publications | |||
The 2012 ECMOSS survey will feature in publications (Insee Résultats, Insee Première). |
|||
| 9.3. Dissemination format - online database | |||
Data available on Eurostat database. |
|||
| 9.3.1. Data tables - consultations | |||
[Not requested] |
|||
| 9.4. Dissemination format - microdata access | |||
[Not requested] |
|||
| 9.5. Dissemination format - other | |||
Files made available: Each annual ECMOSS survey is subject to two release files made available to French officials of the Service statistique public (SSP, Public Statistical Service): an 'establishments' level file and an 'employees' level file. Furthermore, the 'establishments' level file is available to persons external to the SSP on request from the Comité du secret (Committee on confidentiality). A fichier de production et de recherche (FPR, production and research file) for employees on the SES versions of the ECMOSS survey is also produced for the attention of researchers external to the SSM and made available via the centre Quételet. These files have been available since the end of 2014. |
|||
| 9.6. Documentation on methodology | |||
The annual ECMOSS survey has a description sheet on the Insee website. The questionnaires from the last two surveys are also available on the Insee website. (http://www.insee.fr/fr/methodes/default.asp?page=sources/sou-enq-ECMOSS.htm) Furthermore, the dictionary of variables accompanying each file (release or production and search files) presents the survey (background and methodology) and states for each variable whether it was subject to an adjustment. |
|||
| 9.7. Quality management - documentation | |||
[Not requested] |
|||
| 9.7.1. Metadata completeness - rate | |||
[Not requested] |
|||
| 9.7.2. Metadata - consultations | |||
[Not requested] |
|||
|
|||
[Not requested] |
|||
|
|||
- |
|||
| 11.1. Confidentiality - policy | |||
[Not requested] |
|||
| 11.2. Confidentiality - data treatment | |||
[Not requested] |
|||
|
|||
[Not requested] |
|||
|
|||
|
|||