|
 |
|
| For any question on data and metadata, please contact: Eurostat user support |
|
|||
| 1.1. Contact organisation | INE - Instituto Nacional de Estatistica (National Statistical Institute of Spain) |
||
| 1.2. Contact organisation unit | Labour Market Statistics Directorate |
||
| 1.5. Contact mail address | Avenida de Manoteras 50-52, 28050 Madrid, Spain |
||
|
|||
| 2.1. Data description | |||
The Labour Cost Survey (LCS) provides comprehensive and detailed information comparable at EU level on the level, structure and development of labour costs in the different sectors of economic activity. |
|||
| 2.2. Classification system | |||
NACE Rev. 2. at division level and their aggregates (sections and some aggregations) NUT's I for Regions |
|||
| 2.3. Coverage - sector | |||
All economic activities defined by NACE Rev. 2, except agriculture, forestry and fishing activities, the activities of households as employers and the activities of extraterritorial organisations and bodies. |
|||
| 2.4. Statistical concepts and definitions | |||
Labour Costs refer to the total expenditure borne by employers for the purpose of employing staff. They include employee compensation, which is mainly comprised of gross wages and salaries in cash and in kind and employers' social security contributions, vocational training costs, other expenditure, such as recruitment costs and spending on working clothes, and employment taxes regarded as labour costs minus subsidies received. These labour cost components and their elements are defined in Commission Regulation (EC) No 1737/2005 of 21 October 2005, implementing Council Regulation (EC) No 530/1999 concerning structural statistics on earnings and labour costs as regards the definition and transmission of information on labour costs. The Spanish LCS2020 includes all mandatory variables and the optional variable Payments to employees leaving the enterprise.Regarding apprentices , due to confidentiality problems only totals are available. |
|||
| 2.5. Statistical unit | |||
The survey is based on local units. Using as statistical unit the Account of Social Security Contribution, an administrative concept used by the Social Security Institution in its management of the Social Security System. Each Account relates to a set of employees working for an employer in one or several establishments of the company, within the same province and, generally, under one economic activity. In practice, each company tends to open an account for each establishment (local unit). |
|||
| 2.6. Statistical population | |||
The population scope is formed by all local units, irrespective of their size, whose economic activity is classified in Sections B to S of the CNAE-09. It excludes agricultural, livestock and fishing activities, domestic personnel and extraterritorial bodies. |
|||
| 2.7. Reference area | |||
The geographic area includes the whole national territory (including Canary Island, Balearic Island and Ceuta and Melilla). |
|||
| 2.8. Coverage - Time | |||
Calendar year 2020 |
|||
| 2.9. Base period | |||
Not applicable. |
|||
|
|||
| 3.1. Source data | |||
In Spain, from 1988 to 2000, annual data on labour cost were provided by the four-yearly Labour Cost Survey. Four Labour Cost Surveys were undertaken, all in collaboration with the Statistical Office of the European Communities (Eurostat), following the Regulations in force at each moment. Since 2001, an annual survey is conducted to obtain annual data. This survey with reference period year t, is collected during three consecutive months of the year t+1 jointly with the Quarterly Labour Cost Survey (QLCS), adding an annual questionnaire to the quarterly ones. This way, short-term data are adjusted with the annual questionnaire to obtain annual data and the coherence between short term and structural data is assured. The annual data for 2020 were collected during the months April-June of 2021. The annual data provide information on all the variables requested by the Commission Regulation nº 1737/2005 except for those related with apprentices because apprentices are out of the scope of the quarterly and annual surveys till 2022. Apprentices are not a representative group of employees in the Spanish labour market. It is very difficult to obtain accurate figures due to the number of apprentices is such a small. Until the LCS 2004, a specific survey was carried out every four years to obtain their figures. The problems detected in the estimation process of this category in LCS-2004 and the evolution of the number of apprentices since then justify the exclusion of this kind of employees in the LCS-2008 and LCS-2012. However, following Eurostat's recommendation to try to minimise the number of data not available in the survey, administrative records from Social Security and some questions added in the QLCS for 2020 have been used in LCS2020 to obtain estimates of the variables on apprentices. This issue will be deeply explained under point 5.3. |
|||
| 3.2. Frequency of data collection | |||
annual |
|||
| 3.3. Data collection | |||
Since 2001, an annual survey is conducted to obtain annual data. This survey with reference period year t, is collected during three consecutive months of the year t+1 jointly with the Quarterly Labour Cost Survey (QLCS), adding an annual questionnaire to the quarterly ones. This way, short-term data are adjusted with the annual questionnaire to obtain annual data and the coherence between short term and structural data is assured. The annual data for 2020 were collected during the months April-June of 2021. |
|||
| 3.4. Data validation | |||
The collection, recording and filtering processes of the information are fundamental stages in the development of any statistical research. It is essential that a strict control of compliance with the different associated tasks is performed. In the case of the ALCS, the INE Provincial Delegations play an essential part in the performance of these tasks. The collection of questionnaires and the recording thereof is carried out in the INE Provincial Delegations. Prior to processing the information, a comprehensive control of the data provided by the respondent units is performed, in order to ensure the validity thereof. The data received passes through a dual control: - A first filtering, simultaneous to the recording, is performed in the provincial delegations, and has the objective of detecting incomplete and erroneous questionnaires, as well as guaranteeing the coherence of the data recorded. - A second control, carried out in the central services, in order to avoid inconsistency between related variables and in the time series, which is combined with a macrofiltering based on the elevated data obtained. In any case, if any inconsistency were detected, the provincial delegation responsible for the questionnaire would establish telephone contact with the respondent in order to clarify the information. In general terms, the filtering is focused on the following aspects: - Detecting incomplete questionnaires: There must be specific data in the questionnaire such as the number of workers, etc. - Guaranteeing the consistency of the data: The data must respect the established legal limits and specific coherence filters, therefore subsidies for training without including training costs, etc.. is not allowed. - Guaranteeing the time coherence of the main study variables. The objective is to detect possible errors in the data, via a comparison of the main variables, with regard to the same variables in prior years. |
|||
| 3.5. Data compilation | |||
In the case of empty units (whether produced by incidences or non-response), the questionnaire is imputed with the estimated variable average for its stratum. In order to obtain the elevated results, it uses separated ratio estimators, using the number of workers in the Social Security Contribution Account Directory as an auxiliary variable. |
|||
| 3.6. Adjustment | |||
Not applicable. |
|||
|
|||
| 4.1. Quality assurance | |||
The ultimate goal of the quality management system the INE is implementing is to configurate a Quality assurance framework, inspired in leading international schemes, such as that of the United Nations or the one defined by Eurostat from the European Statistics Code of Practice (CoP). The CoP sets out 16 key principles for the production and dissemination of European official statistics and the institutional environment under which national and Community statistical authorities operate. A set of indicators of good practice for each of the 16 principles provides a reference for reviewing the implementation of the Code. The current INE system is based on three types of elements: Institutional Environment, Processes and Products. Each principle is associated with some indicators which make possible to measure it. In order to evaluate quality, EUROSTAT provides different tools: the indicators mentioned above, Self-assessment based on the DESAP model, peer review, user satisfaction surveys and other proceedings for evaluation. The aim of this document is to be used to evaluate the quality of the survey. The structure of this report follows the content of Commission Regulation (EC) No. 698/2006 of 5 May 2006 Implementing Council Regulation (EC) No. 530/99 as regards quality evaluation of structural statistics on labour costs and earnings.
|
|||
| 4.2. Quality management - assessment | |||
Not provided. |
|||
|
|||
| 5.1. Relevance - User Needs | |||
This survey is of much importance for institutional and private bodies. Their main users may be classified in the following groups: - International Organisations: European Union Institutions, OECD, International Monetary Fund, International Labour Organisation, etc. - Public Organisms: different Ministries such as those of Economy and Labour, the National Statistical Institute itself for several of its units (such as National Accounts), Bank of Spain, etc. - Social Institutions such as the Trade Unions and the Political Parties - Research Centres and Universities - The media |
|||
| 5.2. Relevance - User Satisfaction | |||
The INE has carried out general user satisfaction surveys in 2007, 2010, 2013, 2016 and 2019 and it plans to continue doing so every three years. The purpose of these surveys is to find out what users think about the quality of the information of the INE statistics and the extent to which their needs of information are covered. In addition, additional surveys are carried out in order to acknowledge better other fields such as dissemination of the information, quality of some publications... On the INE website, in its section Methods and Projects / Quality and Code of Practice / INE quality management / User surveys are available surveys conducted to date.(Click next link) In the user satisfaction survey conducted in 2016, which can be consulted on the website of INE in the category of Quality -> Quality Management -> System evaluation and quality monitoring -> User surveys , you can see the evaluation of "labor market" group in which it is framed this statistical operation . This can give us indications of user opinions of this statistical operation. In general, users are satisfied. However, they believe that the survey should have a larger sample size, in order to offer a more detailed breakdown of some variables (in particular, of the geographical breakdown, of economic activities and of cost components). |
|||
| 5.3. Completeness | |||
As it si has been mentioned in the secon point, apprentices are not a representative group of employees in the Spanish labour market. The labour legislation on these kind of employees in Spain establishes very low labour costs (both wages and social contributions). As a consequence, the number of apprentices is very small. Thus, the average number of apprentices data for total economy from social security files was 27,847.31 from a total of 14,107,296 employees in the activities included in the survey (it represents 0.2% of the total). It is very difficult to obtain reliable data for apprentices from a survey due to their very low numbers, that makes it necessary to use large sample size to obtain representative data and therfore it is s costly and increase the response burden. This time, following the rule of not putting zero in any variable unless it does not exist, data on apprentices have been estimated from administrative records. The Social Security General Treasury registers apprentices, for control, in a special file that includes only these kind of employees. However, due to these small numbers, it is not possible to disseminate them in a disaggregate way. So the following rules have been implemented in the tables transmitted:
A1 excludes apprentices A13=’NA’ A131=’NA’ B1 excludes apprentices B13=’NA’ C1 excludes apprentices C13=’NA’ D1 excludes apprentices D11 excludes apprentices D112=’NA’ D12 excludes apprentices D123=’NA’
|
|||
| 5.3.1. Data completeness - rate | |||
Not provided. |
|||
|
|||
See below. |
|||
| 6.1. Accuracy - overall | |||
Not provided. |
|||
| 6.2. Sampling error | |||
See next point |
|||
| 6.2.1. Sampling error - indicators | |||
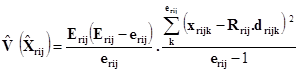
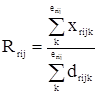
Methodology used for variance estimation The estimators used for the survey are separate ratio estimators, the number of employees in the directory being used as an auxiliary variable. The calculation of the variance has been made by estimating it from the variances in each stratum of the ratio estimator, by means of the generally used linear approach.
Expression of the variance Where Where X, value of the variable in each questionnaire. E, number of centres in the directory. e, number of centres in the sample. d, number of employees in the centres of the sample. r, region. i, economic activity (NACE rev.1). j, size of the unit. k, unit of the sample.
In this way, the variation coefficients have been obtained according to the structures of Tables A, B and C of Variable D (tables requested by EUROSTAT) as upper bound of the variation coefficients of the annual labour cost variables per employee (D/(A11+A121+A131)) and the hourly labour costs (D/B1). Annexes: Sampling Errors |
|||
| 6.3. Non-sampling error | |||
See next point |
|||
| 6.3.1. Coverage error | |||
The population is formed by all employees working for an employer during the year 2020. The framework used for the selection was the General Register of Accounts of Social Security Contributions, held by the Ministry of Employment and Social Affairs. When the Register is received from the Social Security, a first debugging is made prior to the selection of the sample, which implies several stages: - To eliminate economic activities regarding agricultural activities, livestock, fishery, households with domestic employees and extra-territorial organisms since these are not part of the survey. - To eliminate the units that belong to the special regime of Social Security sales agents, whose main compensation consists in commissions on sales and who, consequently cannot be surveyed either. After this, the sample is selected and the questionnaires are sent to the selected units; the data collection and debugging reveal the errors in the surveyed units. Under-coverage errors Section O is partly covered by the survey. The employees under the Social Security General Scheme and subjected to the general rules of employment law, just like all other employees in the rest of the sections of NACE Rev.2. are included in the present survey. The quarterly labour cost survey is complemented with administrative data to obtain the labour cost index of this section O quarterly. The DARETRI system was created by Order PRE/390/2002 of 22 February 2002. Its purpose is to collect pay data on Central Government public-sector employees. The DARETRI system captures automatically the compensation data of the personnel working in the Central Government. Unfortunately, this source cannot be used in the LCS because the breakdowns of the variables are enough for the index but not for the LCS. The figures from the quarterly data show that section O in the LCS cover the 75.1% of the employment and 66.5% of the total labour costs of this section.
|
|||
| 6.3.1.1. Over-coverage - rate | |||
Overcoverage errors The data collection showed that 93 units were inactive or closed down in 2020, which is 0.3% of the total sample selected. When the questionnaires come back and processing is started, one of the rules is to verify whether the activity has been classified accurately. 5 erroneously classified contribution accounts have thus been found (0,02% of the sample selected). In these cases new units have been selected. |
|||
| 6.3.1.2. Common units - proportion | |||
Not provided. |
|||
| 6.3.2. Measurement error | |||
Questions that were difficult to answer because of their characteristics: The employer’s total expenditure is asked on different labour cost concepts for all the employees belonging to the unit surveyed. However, for the local units it has been difficult to answer the questions on “Direct Social Benefits, “Voluntary Contributions” and “Other Expenditures”, and what is available is the enterprise’s total amount. When this information was not available and it was hard to calculate, it was allowed to answer the enterprise’s data, as well, as the total employees of the enterprise. These data are used to calculate the average expenditure per employee of the enterprise and to gross it up to the number of employees in the surveyed local unit.
Errors in the data collection method Before sending the questionnaires, the telephone numbers and addresses of the units were checked and updated. The main method used by respondents is the Web-based questionnaire. The enterprise receives a letter the first time that it is interviewed with the username and the password to access to the web site and then it could fill in the questionnaire directly field by field or upload the XML file. There is a minimal validation process to consider the questionnaire sent and the process ended. The following times INE sends an email to the respondent reminding the contacts and the survey to be filled. There is a free telephone number in the letter to contact with INE where the respondents could ask all their doubts and also request an excel questionnaire and email address to send it. |
|||
| 6.3.3. Non response error | |||
See next point |
|||
| 6.3.3.1. Unit non-response - rate | |||
The unit response rate is calculated as the ratio, expressed as a percentage, of the number of responses to the total number of in-scope respondents. The table annexed shows the response rate by Nace-2 sections and size of the unit.
Annexes: Response rate |
|||
| 6.3.3.2. Item non-response - rate | |||
Partial non-response is not allowed by the collection procedure. All the variables are inter-related by validation criteria and a system of filters is available to assure the questionnaire’s internal consistency and to prevent the lack of essential data. The omitted data or data “rare” are requested again to the informant. |
|||
| 6.3.4. Processing error | |||
Debugging errors After receiving the questionnaires, the statistical offices recorded those received on paper and downloaded those received by internet. To this end, a computer application was created, which made a first debugging for the questionnaire’s internal consistency. This first debugging consists in using filters referring to errors that allow separating valid questionnaires from those with inconsistencies to be revised. The filters are of two kinds: those detecting type I and type II errors. Type I errors: If they are not thoroughly corrected, the questionnaire cannot be considered as valid. Type II errors: They affect norms that have to be complied with towards the coherence of the data. The non-satisfaction of these norms does not necessarily mean that the questionnaire is not valid, but it should be explained why an error is stated. In cases of doubts, a telephone call is made to the respondent for him to elucidate them. The questionnaires are filtered a first time during the collection stage, and a second time by the team responsible for the results of the survey (this team is different from the recording one), after which the explanations are checked again. There are more than 200 rules that are checked in each questionnaire. The processing, grossing up and tabulation of the data have been programmed and supervised by two different teams. After the tabulation, the results obtained were analysed in order to know whether they were coherent. |
|||
| 6.3.4.1. Imputation - rate | |||
Item imputation rate There is not item imputation due to partial non-response is not allowed by the collect procedure. All the variables are inter-related by validation criteria and a system of filters is available to assure the questionnaire’s internal consistency and to prevent the lack of essential data. The omitted data or data “rare” are requested again to the informant. Overall imputation rate There are two cases: - The quarterly questionnaires are imputed. There are, in average, around 10,1% of quarterly questionnaires imputed each quarter during 2020. The number of employees is updated using the data of the register , the same number of hours worked and the cost variables of the previous year (except the payments to employees leaving the enterprise) updated according to the pay rise agreed in the collective agreements (the pay rises are obtained from the Collective Agreements Statistic elaborated monthly by the Ministry of Labour and Social Affairs). (More detail in Quality Report of LCI). - If there was no response or an incidence in the sample, the value of the analysis variables for each ‘empty’ sampling unit or unit without information was imputed using the information obtained for the stratum to which the unit belonged. The imputation criterion was to assign the value of the variable per employee obtained for the total of units that responded in this stratum to the omitted unit and multiply it by the number of employees in the missing unit. For example, if it was wanted to impute the value of total payroll for the empty unit, we would calculate the total payroll per employee obtained in the stratum of that unit and multiply the resulting figure by the number of employees in the unit. This form of imputation only requires replacing the raising factors obtained with the selected sample with the ones that result from the effective sample. |
|||
| 6.3.5. Model assumption error | |||
- The period requested in the annual questionnaire was the 2020 calendar year. In the event that an enterprise’s accounting period exceeded the year, it is asked it to adjust the information to the calendar year. This did not happen often as wage payments to employees and payments of compulsory social contributions are usually made on a monthly basis. - Payments for days not worked (D.1113): Spanish payment practices do not allow for a concept equivalent to variable D.1113; wages are established according to a period of time (whether by hour, day, week or month) and the characteristics of the job. Vacations and time off without losing payment are agreed upon in contracts or collective bargaining agreements. This variable was therefore estimated indirectly as follows: 1. The questionnaires’ information was used to obtain wages and salaries paid in cash that correspond to the variables D. 11111+ D.1113 2. Payments for overtime taken were subtracted from the questionnaires. (So, D.11111+D.1113- overtime payments) 3. Overtime and hours not paid as salary, such as hours not worked due to illness, maternity leave or for technical, economic, organisational or production-based reasons (with or without a workforce reduction/layoff plan) were subtracted from the total of hours paid. 4. The quotient between 2 and 3, which would be the wage paid per-hour independently of whether or not it was worked, was obtained. 5. The above result was multiplied by the hours not worked but paid by the employer, such as vacations, public holidays, time off for getting married, having a baby, moving home, the death or serious illness of a family member, to attend exams, visits to the doctor, breastfeeding, union representation, etc. 6. The result from 5) above corresponded to the variable D.1113, while D.11111 was the same as 2-5 plus payments for overtime. This way, D.1113 is estimated but total labour cost is not affected by this calculations. - As it has been said above (see Overall imputation rate item), the unit no response is made replacing the raising factors obtained with the selected sample with the ones that result from the effective sample. |
|||
| 6.4. Seasonal adjustment | |||
Not provided. |
|||
| 6.5. Data revision - policy | |||
Not provided.
|
|||
| 6.6. Data revision - practice | |||
Not provided. |
|||
| 6.6.1. Data revision - average size | |||
Not provided. |
|||
 , estimated total of the variable (A1,B1,D1, etc.)
|
||||||||||||||||||||
| 7.1. Timeliness | ||||||||||||||||||||
The data were published at national level with a lag of 7 months from the year 2020 for data excluding apprentices.
|
||||||||||||||||||||
| 7.1.1. Time lag - first result | ||||||||||||||||||||
Not provided. |
||||||||||||||||||||
| 7.1.2. Time lag - final result | ||||||||||||||||||||
Not provided. |
||||||||||||||||||||
| 7.2. Punctuality | ||||||||||||||||||||
The collection of the annual questionnaires was carried out during four months: March - June 2021. As it was mentioned above, the questionnaires were sent jointly with the quarterly questionnaires of the Quarterly Labour Cost Survey. The sample units are the same for both surveys. The quarterly sample is distributed in three monthly sub-samples along of the quarter, of such form that the first sub-sample will be interviewed all the first months of each quarter, the second sub-sample will be interviewed the second month of each quarter and the third sub-sample the last month of each quarter. This way each sub-sample is interviewed four times per year (for more information about the quarterly survey see the LCI Quality Report 2020). The annual sample was distributed in the same way:
Collection Calendar
There was a final sending of questionnaires from the province offices on 1st July.
The stages of the collection period are the following: 1. Remittance In a first stage of 2 or 3 days, the material was forwarded to the respondent units. In general terms, each mailing contains the following documents: - A questionnaire that must be remitted in a delay not surpassing 15 days after it is received. - A letter from the General Director that besides indicating the purpose of the survey, informs on the laws that oblige to complete the questionnaires and on those regarding Statistical Confidentiality. - A postage paid envelope bearing the address where the respondent has to send the filled in questionnaire. The questionnaire can be fill in by INTERNET using the identification number of the unit and a control digit of the survey included in the paper questionnaire. 2. Contacts and claims: This stage is essential for a fluent and efficient collection, whose percentage of success is very high. The most useful tool for this activity was the telephone. Telephone contacts may occur in both directions. To foster the respondents’ willingness to call the NSI, they are provided whenever possible (in some of the documents forwarded to them) with a free telephone number. The calls are preferably answered by the interviewer in charge of obtaining their questionnaires. If this is not possible, any person tasked with the collection will resolve the respondent’s doubt or duly take the message (indicating the enterprise’s National Register Number (NIF), its address, name of the person who calls, contact telephone number, identification number in the survey and other comments). There is also a free fax number that may come in handy to receive questionnaires and written communications. Each interviewer must contact the enterprises assigned to him and request their questionnaire. 3. Claim with acknowledgement of receipt: All the respondent units which had not remitted their filled in questionnaire by the end of the above stage (the deadline for respondent to reply), received by registered mail and with an acknowledgement of receipt, a second questionnaire with the mention “Claim of compulsory statistical data” (document PS2) 4. Advise note: After 15 days from 3, a letter is sent advising the amount of penalty. Stage following the collection of questionnaires One of the Interviewer’s tasks is the recording and debugging of all the incoming questionnaires. The general rule is that the questionnaires must be recorded at the latest from 3 to 5 days following their arrival, to facilitate consultations with the enterprise as soon as possible after they were filled in. As to the debugging of errors, all computer applications classify the errors in two large blocks: type I or big errors and type II or small errors. Type I errors are so important that they invalidate the questionnaire. Type II errors may arise from specific circumstances of the enterprise’s activity, from its activity during the data reference period or from any specific event of the respondent unit. The first debugging should be carried out at the latest from 8 to 10 days after the recording, that is 10-15 days after the questionnaires are received. The second debugging of all the units was completed at the beginning of July 2021. The tabulation was prepared during July and the publication of national data without apprentices was on 28 July 2021. The information is available on INTERNET (www.ine.es) and on electronic support. The first remittance of data to Eurostat was done on 28 April 2021. |
||||||||||||||||||||
| 7.2.1. Punctuality - delivery and publication | ||||||||||||||||||||
See above. |
||||||||||||||||||||
|
|||
| 8.1. Comparability - geographical | |||
There are no differences between national and European concepts regarding statistical units and classification of activities. |
|||
| 8.1.1. Asymmetry for mirror flow statistics - coefficient | |||
[Not requested] |
|||
| 8.2. Comparability - over time | |||
The different surveys since 1988 have been improved from a sectorial viewpoint: activities that formerly were not part of the Services sector are now included, so that since 2000 survey, only the General Government (Section O of NACE rev.2) activity in said sector remains to be researched upon. This activity has been included partly since the 2008 survey as it was mentioned above. Another important difference is the use of the 2009 National Classification of Economic Activities (CNAE-09), that is the national version of NACE 2, in the survey since 2008. The 1993 Classification of Economic Activities (CNAE-93) was used in 1996, 2000 and 2004 surveys instead of the CNAE-74 in the 1988 and 1992 surveys. That is why a strict comparison of results in the services sector or of the activity divisions or branches in general is not possible. Moreover, the small statistical units (units belonging to enterprises with less than 10 employees) have been included since the data for 2004. So, the coverage of the data has been improved and also the comparability with the data from the quarterly labour cost survey and the labour cost index.
|
|||
| 8.2.1. Length of comparable time series | |||
Not provided. |
|||
| 8.3. Coherence - cross domain | |||
Coherence Coherence with statistics from labour force survey The average actual hours worked in the main job per year of the Labour Force Survey (LFS) has been estimated as the annual average of the quarterly data of the actual hours worked in the main job in the reference week in 2020 for employees multiplied by 52 weeks in the year. The results are shown in the following table. The figures are lower in the LCS for all economic activities, being the highest difference for section R (-13,6%) and the lowest for section J (-1,6%). The reasons for the differences: - Both surveys are different, with a different frame, a different sample design, etc. - LFS is a household survey and in these kind of surveys is generally admitted that hours worked are apparently overestimated. - LCS is a local unit survey and in these kind of surveys is generally admitted that hours worked may be underestimated, specifically the unpaid hours worked are not well collected.
Coherence with structural business statistics The most important differences between the SBS and the LCS are the following: - In the Structural Business Surveys (SBS), the statistical unit is the enterprise and the framework is the Central Business Register (DIRCE). The LCS’s statistical unit is the local one determined by the contribution account and the frame is the Directory of Social Security Contribution Accounts. A Social Security Contribution Account is made up of a number of employees who develop their work in one or various work centres that belong to the same enterprise within the same province, which develops the same principle activity and can be unequivocally identified using an account code for Social Security referring to the compulsory social contributions of those employees. - The SBS stratified sampling uses expansion estimators, one of the stratification variables being the enterprises’ size according to the number of employees. For the calculation of the grossing up factor, the number of enterprises in the register is taken. In the LCS separate ratio estimators are used, the auxiliary variable being the number of employees in the Directory of Social Security Contribution Accounts. The SBS data correspond to the results for the year 2020. Data for sections B-E and G-N plus division 95 are from surveys of INE and data for section F is from a business survey elaborated by the Ministry of Transports. - Data on wages and salaries from SBS, include compensations, i.e. payments made directly by the company to its employees in case of sickness, unemployment, dismissal, accident, pension, early retirement,,etc., meanwhile LCS includes these kind of payments in Employers' imputed social contributions.
The LCS shows values that are all lower than the SBS data, except for sections B,D and N. These differences are more important in sections where the payments to employees leaving the enterprise have been important in 2020. Other reasons for the different results are: - The statistical unit is different: SBS figures for 2018 reference year onwards are based on the 'Enterprise' statistical unit. SBS classify enterprises according to their main activity and may often be made up by several local units with different activities. - The varying frameworks and estimators also give rise to different results. The LCS framework contains all the local units with employees incorporated in the Social Security. The employer’s payment of the employee’s compulsory social contributions is a requisite of the survey, since these contributions will be received from the Social Security Registers. The annual business surveys include all remunerated employees, regardless of how their remuneration is, of their type of contract and of their being incorporated or not in the Social Security.
Coherence with Labour Cost Index The following table shows the growth rate from the LCS 2016 and the LCS 2020 (excluding apprentices) and the growth rate from the total labour cost series of unadjusted LCI.
The growth rates by sections are quite similar in both sources. The coverage is the same; almost all the informants are in both surveys, because of the annual survey for year t is collected jointly with the quarterly survey of year t+1. The differences are due to some exceptional costs (as early retirements, pension funds, etc.) that were not included in the quarterly questionnaire. The differences in total growth rates are due to the different method used to estimate the total hourly labour cost. There are grossed-up estimates for the population from the data of a sample in the LCS, while the LCI is the result of an annual chain-linked Laspeyres indice with base year 2016, that is to say, it maintains fixed the structure of the labour costs of the year 2016.
|
|||
| 8.4. Coherence - sub annual and annual statistics | |||
Not provided |
|||
| 8.5. Coherence - National Accounts | |||
Coherence with national Accounts The National Accounts data correspond to the National Accounts of Spain. Base year 2015. Account Series 1995-2021.
Both sources of information are very similar in section E, Water supply; sewerage, waste management and remediation activities. Most of the activities have figures that are higher in NA data than in the LCS data, except Mining and quarrying (section B), Electricity, gas, steam and air conditioning supply (Section D), Water supply; sewerage, waste management and remediation activities (section E), financial and insurance activities (section K) and public administration and defence; compulsory social security (section O). The main reason for this, is that NA data include all the employees regardless of how their remuneration is (for example, commissions), of their type of contract and of their being incorporated or not in the Social Security, and the data are also adjusted by what is known as the exhaustivity of the GDP (no observed economy). This last adjustment affects specially to services activities (sections G, H, I and R). The NA compensation of employees includes tips that are not in the LCS and that are considerable, mainly, for section I. Sales representatives and other persons who are wholly remunerated by way of fees or commission may be important in sections G and they are included in NA but not in LCS. Sections O-R are formed by units belonging to private and public sectors but public sector has an important weight. It is possibly a problem of different classification in the register used for public units. Salaries may be paid by a unit belonging to section O (administration) while the real activity may belong to another NACE section, for example P (education). Moreover, in these sections, as in the case of sections O-Q, are two kinds of employees: those under Social Security General Scheme that is the frame of the survey and career civil servants in Central Government, armed forces personnel and justice and Parliament officials under the State Employee Pension Scheme that are exclude from the survey. Mainly in education this kind of employees could be of some importance. |
|||
| 8.6. Coherence - internal | |||
Not provided |
|||


|
|||
| 9.1. Dissemination format - News release | |||
The results of the statistical operations are normally disseminated by using press releases that can be accessed via both the corresponding menu and the Press Releases Section in the web. Press release was sent to main official users and the press. |
|||
| 9.2. Dissemination format - Publications | |||
The LCS data are included in free online publications, such as: “Spain in figures”, “Statistical Yearbook of Spain”, etc. |
|||
| 9.3. Dissemination format - online database | |||
Users may access the data via the INE website. Specifically, there are the following links: - Press release and main results: contains a summary of the results obtained in the reference year ( INEbase / Labour market /Wages and labour costs /Annual Labour Cost Survey / Latest data) - Annual series since 2008 : contains the main series from the year in which CNAE-09 was included (INEbase / Labour market /Wages and labour costs /Annual Labour Cost Survey / Results). - 2001-2007 Retrospective Estimates. Base 2008 : For the purpose of having time series of labour costs with enough time horizon to allow their analysis, retrospective series have been compiled in CNAE-2009, at the economic activity level, from the year 2001, which is when the survey began (Instituto Nacional de Estadística. (National Statistics Institute) (ine.es).
|
|||
| 9.3.1. Data tables - consultations | |||
Not provided. |
|||
| 9.4. Dissemination format - microdata access | |||
Not provided. |
|||
| 9.5. Dissemination format - other | |||
Special demands of information are possible on request after an availability study. These demands are not free. The prices of INE Dissemination Products are determined in such a way that the necessary costs for their elaboration are covered. Prices are regulated by the Resolution of private prices of INE Dissemination Products. Annexes: Customised requests |
|||
| 9.6. Documentation on methodology | |||
There are available for free on the INE-web site: - Methodological document.
Annexes: Methodology documents |
|||
| 9.7. Quality management - documentation | |||
The statistics are prepared in accordance with EU guidelines in order to meet the Code of Practice implemented by Eurostat, following the quality criteria on relevance, accuracy, timeliness and punctuality, accessibility and clarity, comparability, consistency, and completeness (along this report). |
|||
| 9.7.1. Metadata completeness - rate | |||
Not provided |
|||
| 9.7.2. Metadata - consultations | |||
Not provided |
|||
|
|||
not applicable |
|||
|
|||
| 11.1. Confidentiality - policy | |||
The Law 12/1989 of the Public Statistic Function, states that INE can not disseminate, or make available in any way, individual or aggregate data that could lead to the identification of any individual person or entity. Moreover, the European Regulation 223/2009 on European statistics sets the need to establish common principles and guidelines ensuring the confidentiality of the data used to produce European statistics and the access to those confidential data taking into account the technical developments and the needs of users in a democratic society. |
|||
| 11.2. Confidentiality - data treatment | |||
The INE takes the necessary logical, physical and administrative provisions for the protection of confidential data from data collection to publication. Confidential data are not published. They are aggregated with other confidential or non-confidential cells to produce a non-confidential data aggregate. For example section B at division level is confidential so only section level is published. |
|||
|
|||
|
The entry into force of Royal Decree 463/2020 of March 14, which declared a “state of alarm” for management of the health crisis situation caused by COVID-19, has caused many companies to lower production intensity, or to close entirely, following said date and most of them durting several months. The collection phase took place during the months of April-June 2021 so the response rate was not affected.
However, the results of the survey have been affected by the very special situation generated by the pandemic and the measures put in place to contain it.
The main measures have been short-time working and temporary lay-offs (ERTE). Employees' hours worked are partially or totally reduced during the crisis period. With the aim of reducing the costs incurred by the companies, employees receive a social benefit directly from the government during that period and the social contributions payable by the employer are also reduced in part. Most of the employees do not receive severance payment as they are not fired. It is a temporal situation. The employers do not pay wages for the time not worked but have a reduced rate of social contributions. Therefore, wages and hours actually worked are reduced in the same way but not the other costs (they are lower reduced) in these cases. There are not subsidies for wages as the employees are paid by social benefits. As a consequence of these measures the monthly and annual labour costs has decreased in the activities concerned but not the hourly labour costs. The evolution of the various activity sections reflected the degree of impact resulting from the pandemic and from the measures put in place to contain it. It is included the LCI questionnaire on COVID support measures as an annex for more information.
Annexes: LCI 2020 QR questionnaire on COVID support measures |
|||
|
|||
|
|||