|
 |
|
| For any question on data and metadata, please contact: Eurostat user support |
|
|||
| 1.1. Contact organisation | Office for National Statistics, UK |
||
| 1.2. Contact organisation unit | Labour Market and Household Division |
||
| 1.5. Contact mail address | Room 2.101, Office for National Statistics, Government Buildings, Cardiff Road, Newport, NP10 8XG |
||
|
|||
| 2.1. Data description | |||
The Labour Costs Index (LCI) aims to provide a timely indicator of changes in the cost of labour per hour worked. It reflects changes in wages and salaries, non-wage costs, and the quantity of hours worked over the quarter and is important for monitoring inflationary pressures emanating from the labour market. In the United Kingdom, it has been relabelled the Index of Labour Costs per Hour (ILCH), as it was deemed important to acknowledge the use of an hours denominator in the title of the indicator. This report will help users understand the nature of the LCI/ILCH, and its difference from other short-term earnings indicators in the UK. ILCH is the first short term earnings per hour indicator in the UK and is an important economic gauge, as it can provide early indications of economic performance. Businesses will generally reduce the overtime and regular hours worked by existing staff before they consider reducing employment, so the average hours worked indicator is one of the first observable variables to react to changes in productivity, being able to detect movements before ‘per job’ indicators. Annexes: Index of Labour Costs per Hour UK statistical bulletins |
|||
| 2.2. Classification system | |||
The Labour Costs Index (LCI) uses the NACE classification system, for NACE sections B to S individually. Aggregates for sections B to E, B to N, B to S (whole economy) and G to N are also produced.
The Index of Labour Costs per Hour uses the NACE sections A to S. All industries are published individually, with the exception of C, D, E and G.
Manufacturaing (C) is split into 6 separate groups:
Electricity gas, steam and air conditioning supply (D) and water supply; sewerage, waste management and remediation activities (E) are combined into a single industry.
Wholesale and retail trade; repair of motor vehicles and motor cycles (G) is split into 2 groups:
|
|||
| 2.3. Coverage - sector | |||
As above. |
|||
| 2.4. Statistical concepts and definitions | |||
Labour Costs are defined as core expenditure borne by employers for the purpose of employing staff. They include employee compensation, with wages and salaries in cash and in kind, employers' social security contributions and employment taxes regarded as labour costs minus any subsidies received, but not vocational training costs or other expenditure such as recruitment costs and spending on working clothes (by contrast with multiannual and annual labour cost data). These labour cost components and their elements are defined in Commission Regulation (EC) No 1737/2005 of 21 October 2005 amending Regulation (EC) No 1726/1999 as regards the definition and transmission of information on labour costs. The quarterly Labour Cost Index measures short-term trends in "average hourly labour costs", defined as (total) labour costs divided by the corresponding number of hours worked in the quarter in question (see Regulation (EC) No 450/2003 of the European Parliament and of the Council of 27 February 2003 concerning the labour cost index). Quarterly changes in hourly labour costs are calculated first for each economic sector (NACE Rev. 2. Sections) and then aggregated to the whole economy keeping a fixed structure (i.e. fixed weights) by industry (Laspeyres index). Therefore, the LCI does not discount the compositional effect derived from a change in the composition of employment within an economic sector. This means that, for instance, the LCI may increase due to the redundancies of low paid workers within one sector. Annual LCI figures are calculated as the arithmetic mean of the quarterly values. All labour cost indices are annual chain-linked Laspeyres indices. Trends in average hourly labour costs for an individual economic activity/country are weighted by the total labour costs associated with that activity/country, which are fixed for one year in order to obtain national or European aggregates. LCI data are presented in the form of index numbers (current reference year: 2016) and annual and quarterly growth rates (comparison with the previous quarter). Apart from the overall Labour Cost Index, indices are also available for the labour cost components "wages and salaries" and "employers' social security contributions plus taxes paid minus subsidies received by the employer (Labour costs other than wages and salaries)". An index excluding "bonuses" - defined as bonuses and allowances not paid in every remuneration period is also available. For the NACE aggregates in the LCI, item and country weights are applied. These are available as shares of 1000, i.e. for item weights, each single weight sums up to 1000 for the total labour costs in a given country for the aggregate B to S. For the country weights, they are given in relation to the total labour costs for the country aggregate. |
|||
| 2.5. Statistical unit | |||
The Index of Labour Costs per Hour is published using both index values and percentage growth. |
|||
| 2.6. Statistical population | |||
United Kingdom (Great Britain and Northern Ireland) |
|||
| 2.7. Reference area | |||
As above. |
|||
| 2.8. Coverage - Time | |||
Both LCI and ILCH are published from 2000 quarter one to present. |
|||
| 2.9. Base period | |||
LCI has base period of 2016. ILCH (Index of Labour Costs per Hour) has base period of 2000. |
|||
|
|||
| 3.1. Source data | |||
The LCI is constructed as a Laspeyres (or base weighted) index, chain-linked annually. This measures the movement in cost per hour of labour from the base period (2016 for LCI, 2000 for ILCH) to the current period. Indexation is based on constant, base period quantity weights (hours worked) for each SIC section, weighted using employment. Chain-linking is a method of constructing an index with a single reference period from two indices with different bases which overlap for some period. Therefore, for example, quarters in 2015 will be indexed to the average index value over 2014; quarters in 2014 will be indexed to the average index value over 2013, and so on. The chain-linking is based on 2000.
To calculate the LCI:
Total wage costs are taken from the MWSS. The data are weighted to be representative of all employee jobs. These weights are derived from the employment at individual firms, as a proportion of total employment in that stratum, as derived from the Inter-Departmental Business Register (IDBR). These weights might be further affected by non-responses that cannot be imputed for and businesses designated as outliers. Details of this and other estimation techniques required to ensure that the estimates are as accurate and comprehensive as possible are described in the Quality and Methodology Information report of the AWE.
The non-wage costs are calculated by applying a factor to wage costs. There are three main reasons for this approach:
Based on information from the UK's Labour Costs Survey (2000), the Labour Costs Index excludes only a small percentage of cost items. The structure of labour costs in the UK indicates that more than 95 per cent of total labour costs would be captured by an estimate that included pay, payments for days not worked, employers’ voluntary and statutory social contributions and benefits in kind. In light of this the LCI development was confined to identifying suitable estimators for these components of labour costs. In doing so the ONS explicitly recognises that the indicator will approximate movements in total labour costs, but there is likely to be little value-added from the inclusion of the less than 5 per cent of non-wage labour costs that can only be imprecisely measured. Examples of non-wage costs which are not included in LCI are redundancy payments and employee savings schemes, both of which have been proven difficult for businesses to provide at the required frequency and aggregation level.
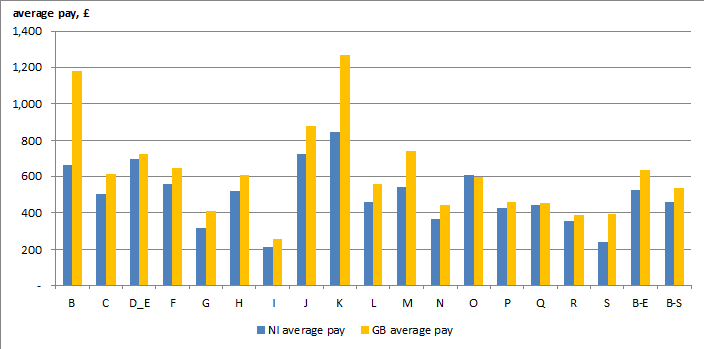
Finally, LCI is published for United Kingdom. The MWSS does not sample for businesses in the Northern Ireland, and therefore a Northern Ireland component is estimated as part of the LCI production process. This involves creating factors from the Annual Survey of Hours and Earnings, for each stratum, to take into account the differences in the average pay between GB and Northern Ireland. Generally, the average pay in Great Britain is higher than that in Northern Ireland; this is seen in NACE sections B (mining and quarrying) and K (financial and insurance activities) in particular, see chart below.
Comparisons of average pay for GB and NI, 2019
Hours worked – description of methods Measures of hours are important economic gauges, as they can provide indications of economic performance. The average hours worked indicator is one of the first observable variables to be affected in productivity; businesses will generally reduce the overtime and regular hours worked by existing staff before they consider reducing employment. LCI relates to employees only, and so the total hours worked by them include those worked and paid at both ordinary time and at premium rate, together with those worked for no payment (typically unpaid overtime). The total excludes time not worked because of sickness, annual leave, statutory holidays, special leave, meal breaks and because of part-time working. Some of these components will be paid while others will not. The process of obtaining information on total hours worked (for use in the denominator for the Labour Costs Index) is clearly a complicated process.
The ONS pilot business survey of hours worked indicated that businesses were unable to provide this information at the aggregate level required. Given this, it has been necessary to develop a methodology to estimate hours using alternative, existing sources. The ONS uses data from both household and business surveys to generate a total hours worked series. The use of an employer survey would ensure that the sample is consistent with the numerator, both in terms of sample business composition and the classifications of the employees to their industrial sector, although this places burden on businesses and there is an inability to assess their accuracy and consistency.
Thus, the methodology used for the LCI denominator combines average quarterly total hours worked, from the LFS, with the number of employees from the MWSS for each industrial classification. This approach ensures consistency between the employment estimates that drive total hours worked, in the denominator, and wages and salaries estimates that drive total labour costs, in the numerator. This same principle, of combining average total hours worked from the LFS, with employment estimates from a business survey, is used by Statistics Canada.
The LFS is a household survey that is the ONS’s primary source for hours worked information in the UK. The data for the total number of hours worked are typically presented for an average week in the quarter, rather than the total number of hours worked in the quarter itself. The LFS is important because it allows the ONS to capture information on actual hours worked (rather than usual hours worked or actual hours paid). This has the advantage of providing information on changing working patterns, e.g. the amount of unpaid overtime being worked, and the affect of paid and unpaid leave, which can have important impacts on the LCI. However, there are quality issues with proxy response, classification of the economic sector in which the employee is working and the exclusion of jobs that are described as the third or more job of an individual. Further details on the LFS are available from the LFS quality and methodology information report [1].
To provide some confirmation of the quality of the hours data produced by the LFS, and particularly the classification to industry, work was undertaken to assess the main differences in data produced by the LFS and ASHE. Comparisons were made between paid hours information from the two surveys, as ASHE does not collect information on actual hours worked. The data from the two sources were shown to be similar, with little difference in the mean and distribution of hours worked.
Thus, the LCI estimates hours worked by using estimates of average total hours worked by employees, as measured by the LFS, together with estimates of gross employment produced using data from the MWSS. Thus, the average earnings per hour worked is then the ratio of two, independent, self-consistent terms:
This method ensures that the LFS is used in a way that best brings the business (MWSS) and household (LFS) data onto a similar footing. The estimation of total hours worked is undertaken on a continuous basis in the LFS and so the production of the denominator for the LCI can be accomplished for each calendar quarter.
Wages and Salaries Wages and salaries must be obtained and aggregated in a suitable way, and adjusted for payments for days not worked because of sickness and maternity, benefits in kind and employer social contributions.
The wages and salaries component of the numerator comprises approximately 85 per cent of total labour costs and is obtained from the MWSS. The MWSS yields sufficient information to meet the requirements to estimate direct remuneration. The other components [non-wage labour costs, including sickness, paternity and maternity payments, benefits in kind, pension contributions and national insurance contributions] can be calculated (with varying degrees of precision) from existing sources. In doing so, due recognition is given to the need to reflect seasonality and diversity in terms of industry of some components of labour costs.
As noted previously, the MWSS provides the main input to the numerator of the LCI, in the form of employers' wages. This uses a ratio method to estimate both total wages and total number of employees for divisions of the Standard Industrial Classification (SIC). Aggregation of these estimates over component divisions of SIC sections enables the estimation of total pay for each SIC section. This yields an estimate that is close to the target variable for LCI (WAG) – the wage index produced as part of LCI.
Sickness, maternity and paternity payments A factor for sickness, maternity and paternity pay is calculated using data from the LFS. The adjustment for costs for days not worked is made by calculating the costs associated with sickness, paternity and maternity absence. The LFS measures the number of hours an employee usually works and the number of hours actually worked. Where there is a difference, the survey asks for the reason and classifies these to different categories. Among these is the category ‘sickness, paternity and maternity’, and so it is possible to obtain, with a reasonable degree of precision, the proportion of hours 'lost' to an employer. This proportion can then be used to adjust the total wage costs and reallocate the amount to LCI (OTH – the ‘other labour costs’ index produced as part of LCI). Data from the LFS are available each quarter, so adjustments for sickness and maternity pay are specific to each quarter.
Benefits in kind The costs of benefits in kind are estimated using data obtained from the LCS. The data is used to calculate SIC division level factors that show the proportion of total labour costs that can be ascribed to benefits in kind. The estimates of wages and salaries are then augmented by the appropriate proportions in each quarter. This approach yields a constant for benefits in kind as a proportion of total pay in each quarter, which is updated when new LCS data become available, approximately every three years.
National Insurance contributions National Insurance contributions (NIC) can be estimated using published rates. These rates are used in conjunction with unit level data from ASHE to calculate NIC factors at SIC division level. The calculation of National Insurance contributions factors is straight forward since the costs depend on the level of pay to an employee. Using data for individual employees, we can derive a precise estimate of the employers' national insurance contribution. This estimate uses not only the gross pay for the employee, but also the pension arrangements the employee has made, which means adjustments for rebates can accurately be calculated. The factors are applied to the gross wages and salaries estimates produced using the MWSS data to obtain an estimate of employers' statutory social contributions.
Employer pension contributions Voluntary social contributions are primarily in respect of occupational pension schemes. Data are derived from the ABS, which is conducted as part of ONS's compliance with the structural business statistics regulation. The issue of pension contributions is complex, since this depends on the employers' and employees' occupational pension arrangements. The contributions as a proportion of total personnel costs are used to derive a factor for each SIC division and this factor is fixed for several successive quarters. The ONS recognises that the contributions employers actually make to occupational pension schemes do change. However, the change is unlikely to be so dramatic over a period of a year to make a significant difference to the estimate of the rate of growth in total labour costs. Analysis has been undertaken to ensure that the variability in factors each year does not result in any 'shifts'. The pension factor is updated each year as new data become available.
[1] https://www.ons.gov.uk/employmentandlabourmarket/peopleinwork/employmentandemployeetypes/methodologies/labourforcesurveyperformanceandqualitymonitoringreports |
|||
| 3.2. Frequency of data collection | |||
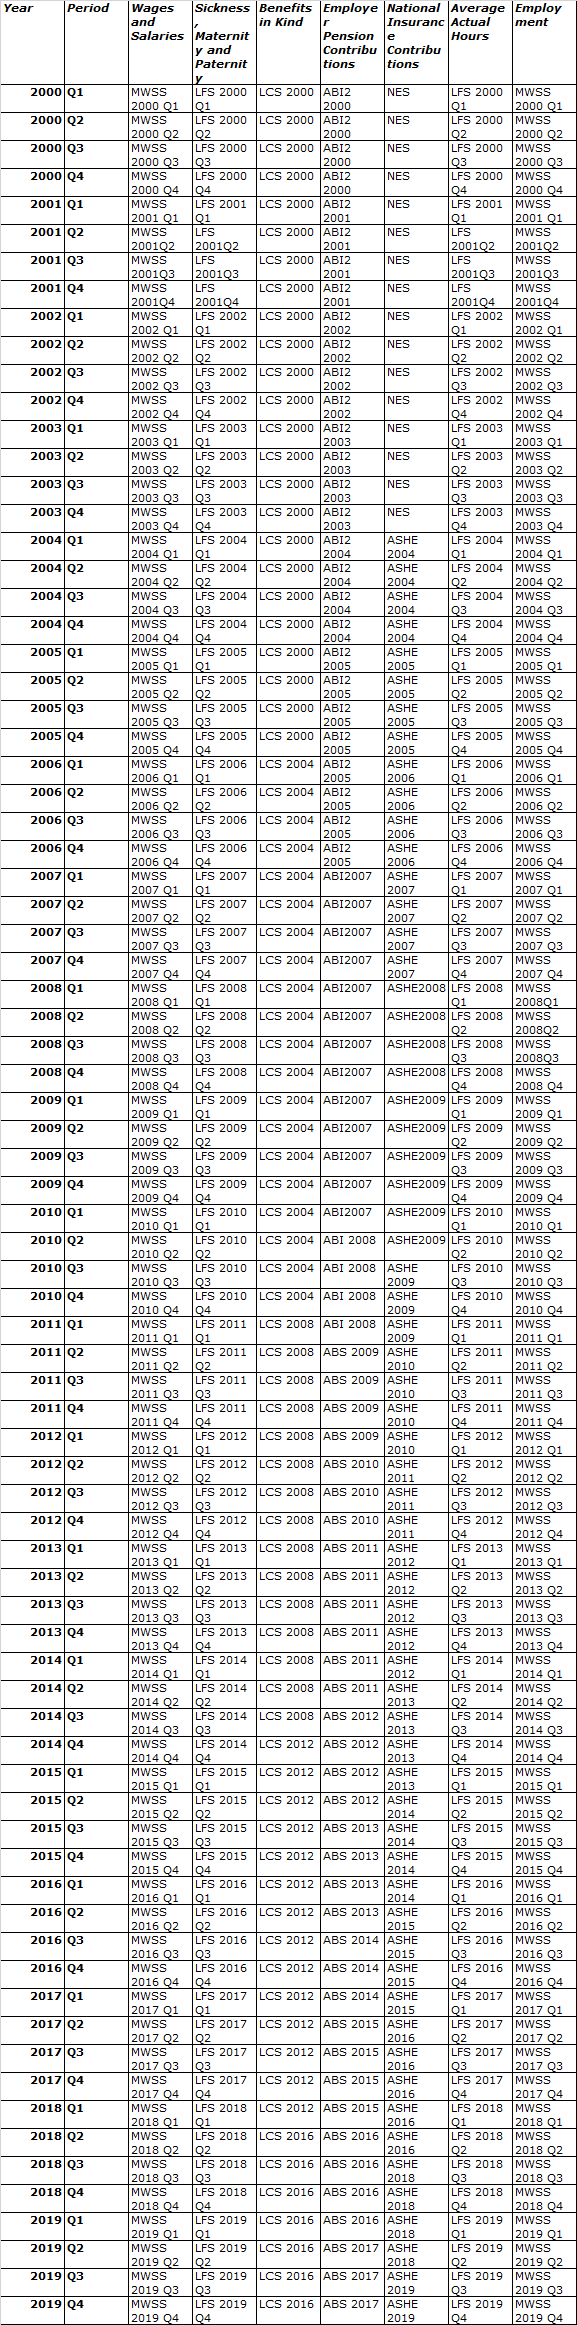
Wage costs - Monthly Wages and Salaries Survey (MWSS): monthly Hours worked - Labour Force Survey (LFS): quarterly Sickness, maternity and paternity payments - LFS: quarterly Benefits in kind - Labour Costs Survey (LCS): four-yearly National Insurence contributions - Annual Survey of Hours and Earnings (ASHE): annually Employer pension contributions - Annual Business Survey (ABS): annually
|
|||
| 3.3. Data collection | |||
Not available - data are obtained primarily from the Monthly Wages and Salaries Survey and the Labour Force Survey. |
|||
| 3.4. Data validation | |||
Not available |
|||
| 3.5. Data compilation | |||
Not available |
|||
| 3.6. Adjustment | |||
Not available |
|||


|
|||
| 4.1. Quality assurance | |||
A number of checks are undertaken both before and after seasonal adjustment takes place, to quality assure the data. |
|||
| 4.2. Quality management - assessment | |||
Quality assurance is undertaken before and after seasonal adjustment every time data is produced. All methodological changes to the LCI or any of its sources are discussed with and approved by the ONS' methodology department, which assesses the suitability of the new method and the potential impact on the data. |
|||
|
|||
| 5.1. Relevance - User Needs | |||
The European Community, and particularly its economic, employment and monetary authorities, need to have regular and timely labour cost indices for the purpose of monitoring changes in labour costs. A timely and consistent Labour Costs Index is also of utmost importance for the European Central Bank (ECB) to monitor inflation in the European Monetary Union (EMU), and for European partners to use it in negotiating pay deals. Eurostat requests a standardised Labour Costs Index, whereby each National Statistics Institute (NSI) produces an estimate with a comprehensive numerator, defined in respect of labour costs, deflated by total hours worked. This requires NSIs to produce an estimate of the total number of hours worked in each calendar quarter for sections B to S of NACE Rev. 2 (called the 2007 Standard Industrial Classification in the UK, or SIC 2007).
To adhere to these user requirements exactly, a new index was developed in the UK, called the Index of Labour Costs per Hours (ILCH), to address the Eurostat regulation. The development of ILCH was undertaken in light of the results of a business survey to assess the feasibility of collecting information on labour costs and hours worked by employees. This showed that the required data would not be available and in light of Article 7 (a), (b) and (c) of Regulation (EC) 450/2003 [1] existing sources have been used to construct ILCH.
[1] The Regulation states that “the benefits of collecting, at Community level, complete data on all segments of the economy should be balanced against the reporting possibilities and the response burden on small and medium-sized enterprises.” |
|||
| 5.2. Relevance - User Satisfaction | |||
Not available |
|||
| 5.3. Completeness | |||
ILCH fully complies with the Eurostat regulations; with the transition to NACE Rev 2, ONS brought the ILCH series published into line with the AWE dataset. Indices and growth rates for nine broad sectors are published:
Indices for 24 lower level industries are also published. This is broadly in line with the data supplied to Eurostat (NACE Rev 2 / SIC 2007 Section level) but with some differences:
For each sector or industry, ONS publishes indices of:
ONS publishes ILCH both with unadjusted and seasonally adjusted data, while the data provided to Eurostat are supplied unadjusted, working day adjusted and seasonally adjusted. |
|||
| 5.3.1. Data completeness - rate | |||
100% |
|||
|
||||||||||||||||||||||||
| 6.1. Accuracy - overall | ||||||||||||||||||||||||
Data on wages and salaries are subject to revision, primarily to reflect late data or corrections to provisional data. Wages and Salaries information for LCI is drawn from the Monthly Wages and Salaries Survey (MWSS), which is also the basis for the Average Weekly Earnings (AWE) statistic, the UK’s lead measure relating to short-term changes in earnings. Businesses with fewer than 20 employees are excluded from MWSS, to control ONS costs and respondent burden at small businesses. Employment at these businesses is taken from the IDBR, and pay is estimated using a factor derived from ASHE, which does cover small businesses.
Also, see section 6.5. Data revision - policy |
||||||||||||||||||||||||
| 6.2. Sampling error | ||||||||||||||||||||||||
LCI (and ILCH) are produced from a number of different sources and it would be difficult to measure the sampling error accurately; the sampling error for the LCI is not currently calculated. |
||||||||||||||||||||||||
| 6.2.1. Sampling error - indicators | ||||||||||||||||||||||||
See above. |
||||||||||||||||||||||||
| 6.3. Non-sampling error | ||||||||||||||||||||||||
See sections 6.3.1 to 6.3.5. |
||||||||||||||||||||||||
| 6.3.1. Coverage error | ||||||||||||||||||||||||
Coverage The sample of the LCI, which is primarily based on the MWSS, is representative of the whole economy. However, because the LCI is constructed from a number of sources it is pertinent to show the coverage of those used to provide inputs to the index. The table below shows the percentage of employees represented in the sample, based on the number of employees according to ESA 95:
Frequency – table of when updated The table below shows the frequency with which each factor used in the construction of non-wage labour costs and total hours worked is updated. The non-wage costs are calculated, using various sources, as factors of the proportion of the wage costs from MWSS. Depending on the source, when their data are released and the frequency of data availability, the different non-wage labour cost factors are updated at different times. The LCI is a quarterly index but not all factors used to calculate the components will be changed at that frequency. Changes made during 2020 - National insurance contrubutions are taken from the ASHE dataset. Previously this was updated in Q2, but this has been changed to Q3 to allow for better timeliness as ASHE is published in October (after ILCH Q2, but before ILCH Q3 is published) each year. This was changed for 2018 Q2 where ILCH was not updated with ASHE 2017, instead 2018 Q3 ILCH was updated with ASHE 2018.
|
||||||||||||||||||||||||
| 6.3.1.1. Over-coverage - rate | ||||||||||||||||||||||||
This is not currently measured. |
||||||||||||||||||||||||
| 6.3.1.2. Common units - proportion | ||||||||||||||||||||||||
Not available. |
||||||||||||||||||||||||
| 6.3.2. Measurement error | ||||||||||||||||||||||||
This is not currently measured. |
||||||||||||||||||||||||
| 6.3.3. Non response error | ||||||||||||||||||||||||
The LCI is composed of already existing data sources and does not have its own specific survey to collect its data, and therefore non-response error is not currently calculated. |
||||||||||||||||||||||||
| 6.3.3.1. Unit non-response - rate | ||||||||||||||||||||||||
See above. |
||||||||||||||||||||||||
| 6.3.3.2. Item non-response - rate | ||||||||||||||||||||||||
See above. |
||||||||||||||||||||||||
| 6.3.4. Processing error | ||||||||||||||||||||||||
Quality assurance checks are in place in the process of producing the statistics, designed to identify any processing errors. |
||||||||||||||||||||||||
| 6.3.4.1. Imputation - rate | ||||||||||||||||||||||||
The imputation rate is not calculated for the LCI as it is composed of many different sources. The imputation rate for average weekly earnings (AWE, from the MWSS) is approximately 1:180. Approximately 9000 companies are sampled each month. The Labour Force Survey's (LFS) rolls forward responses from certain types of non-responders who responded at the revious wave. In particular, such imputation is done for non-contacts and “circumstantial refusals” who it is felt could respond again in the future. |
||||||||||||||||||||||||
| 6.3.5. Model assumption error | ||||||||||||||||||||||||
This is not currently calculated. |
||||||||||||||||||||||||
| 6.4. Seasonal adjustment | ||||||||||||||||||||||||
The LCI time series for the United Kingdom are seasonally adjusted using the X13 ARIMA computer package. The coefficients used in the programs are reviewed every year by ONS's Time Series Analysis branch, and are available on request. Following seasonal adjustment, all series were checked for residual seasonality and no residual seasonality was present in any of the time series.
Three LCI datasets are sent to Eurostat each quarter: seasonally adjusted, working day adjusted and unadjusted datasets. The seasonal adjustment parameters are updated annually, in line with Office for National Statistics (ONS) policy on seasonal adjustment [1]. This update can lead to revisions in historic time series extending back at throughout the entire time series. ONS publishes the non-adjusted and seasonally adjusted ILCH.
[1] https://www.ons.gov.uk/methodology/methodologytopicsandstatisticalconcepts/seasonaladjustment Annexes: Quality reporting on SA |
||||||||||||||||||||||||
| 6.5. Data revision - policy | ||||||||||||||||||||||||
The LCI data are subject to revision for a number of reasons. Data on wages and salaries are subject to revision, primarily to reflect late data or corrections to provisional data. Wages and Salaries information for LCI is drawn from the Monthly Wages and Salaries Survey (MWSS), which is also the basis for the Average Weekly Earnings (AWE) statistic, the UK’s lead measure relating to short-term changes in earnings.
There are two distinct types of revisions that arise from MWSS:
A single LCI dataset is sent to Eurostat each quarter containing seasonally adjusted, working day adjusted and unadjusted data. The seasonal adjustment parameters are updated annually in line with Office for National Statistics (ONS) policy on seasonal adjustment [1]. This update can lead to revisions in historic time series extending back at throughout the entire time series. ONS publishes the unadjusted and seasonally adjusted ILCH.
Revisions may also include changes to the source data on non-wage labour costs. This may be due to up-to-date data being made available. For instance, there were relatively large revisions to the National Insurance contributions component of LCI when the 2010 Q2 figures were produced; this was due to switching to the much more up-to-date Annual Survey of Hours and Earnings (ASHE) data. In the future, there are likely to be small revisions to the national insurance component of LCI in quarter 3 each year, as new data from ASHE becomes available.
All revisions will be managed in line with the National Statistics protocol on revisions, available on the National Statistics website [2], and in the same way as the AWE. The LCI will also be subject to revision as part of the annual review of seasonal and working day adjustment and this will be clearly explained.
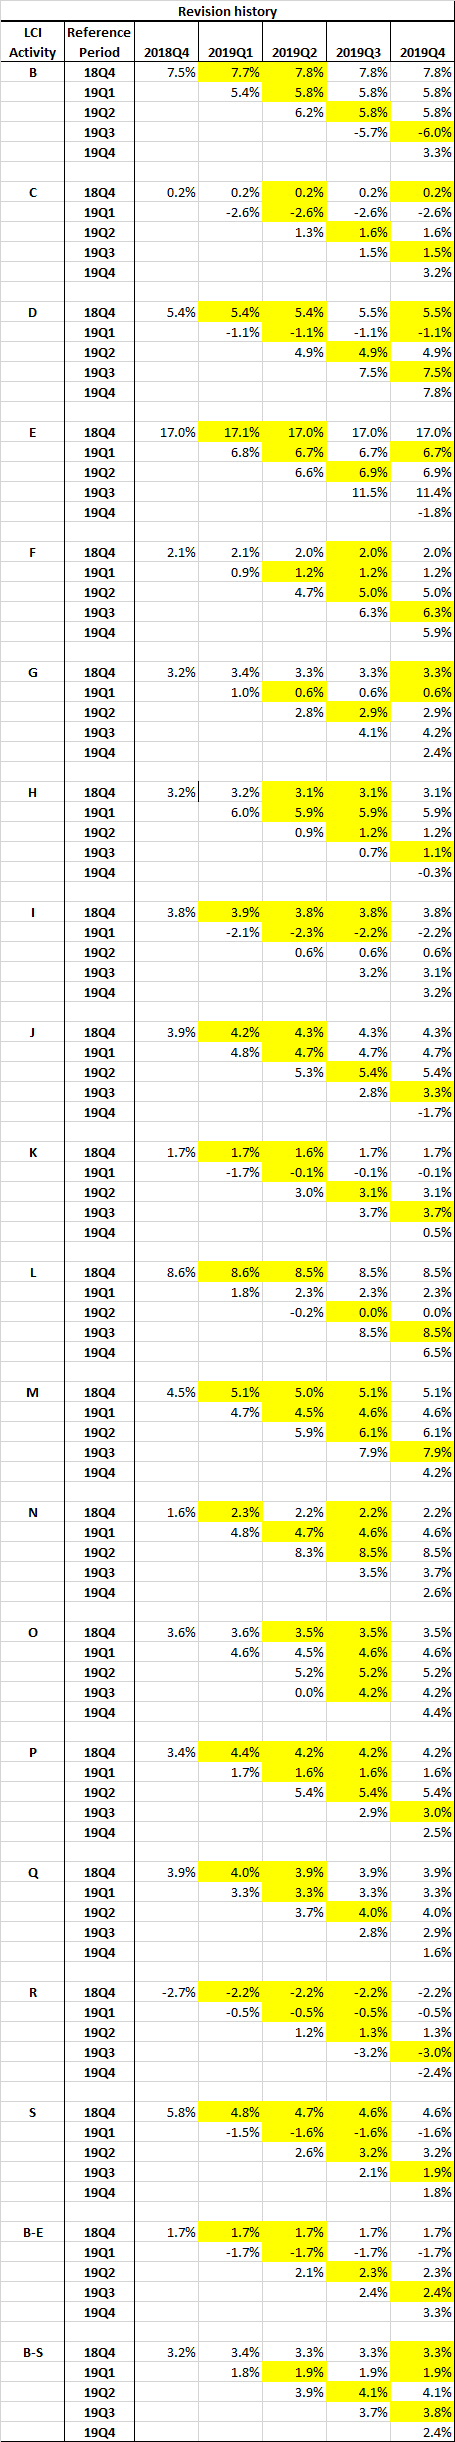
ILCH was first published in June 2005 and was provided to Eurostat in August 2005. Each quarter’s data is usually revised the quarter after which they first appear. The table below shows the annual growth rates of different vintages (with revisions highlighted when they first occur) on the annual growth rate for 2017Q4-2018Q4:
[1] https://www.ons.gov.uk/methodology/methodologytopicsandstatisticalconcepts/seasonaladjustment [2] https://www.ons.gov.uk/methodology/methodologytopicsandstatisticalconcepts/revisions Annexes: Guide to Seasonal Adjustment Protocol on Revisions |
||||||||||||||||||||||||
| 6.6. Data revision - practice | ||||||||||||||||||||||||
See section 6.5. |
||||||||||||||||||||||||
| 6.6.1. Data revision - average size | ||||||||||||||||||||||||
See section 6.5. |
||||||||||||||||||||||||
|
|||
| 7.1. Timeliness | |||
The production process is being assessed over the phases of implementation to ensure that the estimates are delivered on the expected date.
The timing and punctuality of LCI will follow the release practices for the Labour Market Statistics. The timing will not be influenced by the content of the release or set in such a way as to create a presumed advantage to any particular group or individual. Should ILCH be endorsed as a National Statistic, it will be subject to the National Statistics code of practice on release procedures. LCI UK data is currently submitted to Eurostat by 70 days after the reference period and is published by ONS on the same day as the Eurostat release.
2019Q1: t+ 70 days 2019Q2: t+ 70 days 2019Q3: t+ 70 days 2019Q4: t+ 70 days |
|||
| 7.1.1. Time lag - first result | |||
See above. |
|||
| 7.1.2. Time lag - final result | |||
See above. |
|||
| 7.2. Punctuality | |||
See section 7.1. |
|||
| 7.2.1. Punctuality - delivery and publication | |||
See above. |
|||
|
|||
| 8.1. Comparability - geographical | |||
The UK LCI is comparable with that of other countries as the same guidelines are followed. |
|||
| 8.1.1. Asymmetry for mirror flow statistics - coefficient | |||
not applicable |
|||
| 8.2. Comparability - over time | |||
The ONS provides a comprehensive ILCH series from 2000, consistent in data sources and methodology. Before that time, assumptions have had to be made in deriving the back series to 1996. Previously the ONS provided Eurostat with an ‘Interim LCI’.
As part of the 2007 annual seasonal adjustment review, our Time Series Analysis Branch assessed constructing a back series from 1996 Q1 to 1999 Q4. The estimated back series was tested to see whether there was a significant change in the seasonal behaviour of the series from 2000 Q1 onwards. New back series were then estimated firstly using the interim Labour Cost Index (LCI) and then using the back series from the method described above together with regARIMA modelling to take advantage of the more current data.
There is no clear way of quantitatively evaluating the back series produced and therefore the recommended choice of back series should be based on the relative merits of the methods used to produce the series. Ultimately this means that the choice will depend upon whether it is believed that the stable seasonal pattern that is shown in many of the ILCH series (particularly at the industry group level) would likely have continued back to 1996 Q1 or whether there would have been different movements more closely linked to the series used to derive the back series in the method described without regARIMA modelling. Using the above method together with regARIMA modelling essentially adjusts the back series created to account for significant differences between it and the level and seasonal pattern of ILCH.
There has been one major change to ILCH/LCI since it was first published in 2005. This was the move in October 2010 to the use of NACE 2 from NACE 1 (to SIC 2007[1] from SIC 2003 in the UK). Other minor methodological improvements were made at the same time as the SIC 2007 transition. Firstly, the method for calculating monthly and quarterly pay was altered slightly to simplify the ILCH production process. Secondly, the method for estimating the labour costs for Northern Ireland was slightly improved. As a result, changes in the structure and level of employment in Northern Ireland are now taken into account in a more timely fashion. These two changes have had very little impact on the published ILCH figures.
In 2015, changes were made to the Average Weekly Earnings (AWE) regarding how those businesses with fewer than 20 employees were estimated. (Businesses with fewer than 20 employees are not sampled to minimise respondent burden.) As a result of this change, ILCH/LCI was revised back to 2010 using the revised AWE figures. This had a mimimal effect on ILCH/LCI estimates.
[1] SIC2007 is identical to the equivalent European Union classification system, NACE rev.2, down to and including the four digit class level Annexes: Methodology: Average Weekly Earnings revised estimation for employers with under 20 employees |
|||
| 8.2.1. Length of comparable time series | |||
See above. |
|||
| 8.3. Coherence - cross domain | |||
Annex 1 of Commission Regulation (EC) No 1216/2003 section (f) states that a comparison must be made with the ESA 95 compensation of employees per hours worked (A6 breakdown). ONS has compared the Index of Labour Costs per Hour with compensation of employees per hour worked at whole economy level to assess and explain any differences.
When comparing LCI indices and Compensation of Employees (COE) data it is necessary to note the differences in coverage, concepts, definitions and sources:
Chart (a), below, shows a comparison of COE, LCI-total wage costs per hour and the LCI-total labour costs per hour series. The series follow the same general trends, although there are differences in the detail.
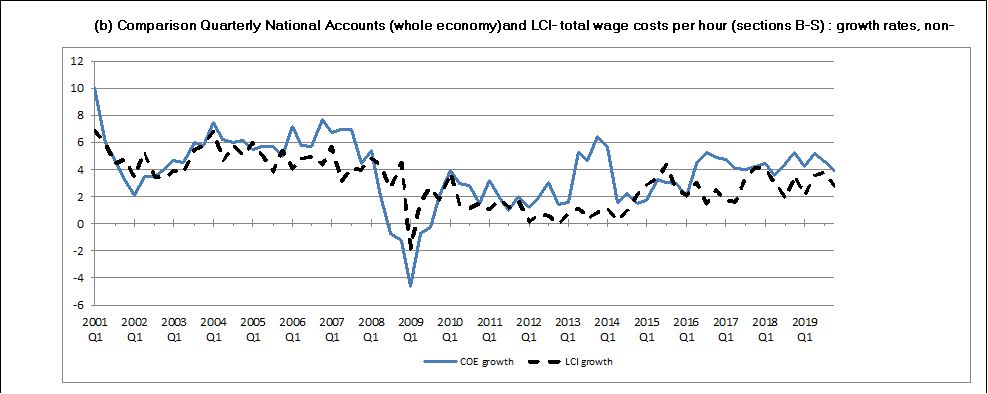
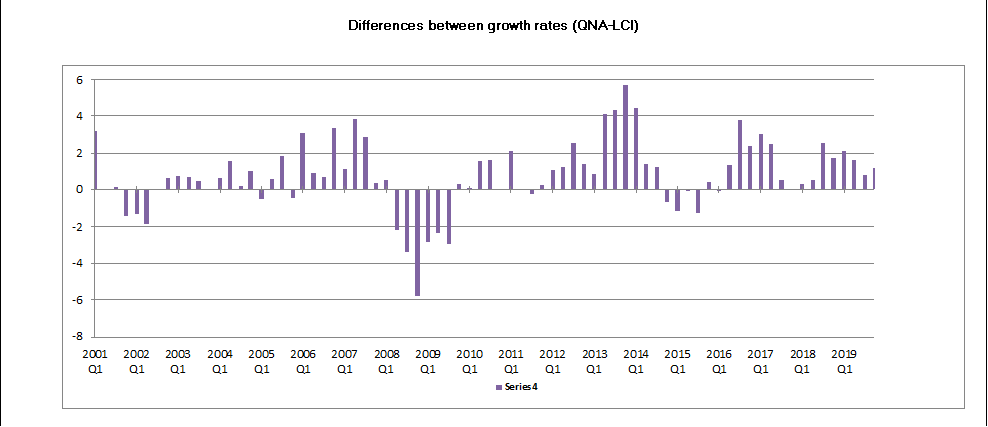
Both Compensation of employees and labour costs tend to peak in quarter one. This is caused by large bonus payments that are paid mainly in the private sector in the first quarter of the calendar year. However, the quarter one peaks in compensation of employees’ series have tended to be higher than the LCI-total wage costs per hour and the LCI-total labour costs per hour series from 2011Q1. Chart (b), below shows the year-on-year quarterly growth rates of QNA (compensation of employees) and LCI indices.
Between 2000 and 2008, the trend for the economy was one of steady growth as compensation of employees per hour worked increased by an average of 5.0 per cent each year whilst labour costs per hour worked grew by an average of 5.5 per cent each year. This means that the cost of employing a worker rose during this period.
Between 2008 and 2009, labour costs per hour increased by just 0.5 per cent on average. This was caused in part by lower bonuses in 2009 brought on by the 2008 UK economic recession. However, during this period compensation of employees per hour worked had 3.4% growth. This means that the UK economic downturn had more impact on the LCI data.
In the years following the economic downturn, the growth in COE and LCI per hour slowed compared with earlier years. Between 2009 and 2011, compensation of employees and the labour costs index increased by an average of 1.6% and 1.4% each year, respectively.
Between 2012 and 2019, the COE and LCI series have begun to diverge, with COE remaining above the LCI series, for the most part. The average growth per year in this period were 3.7% and 2.1% respectively.
Looking at the previous year, between 2018 and 2019, COE per hour and the LCI per hour increased by 4.4% and 3.1% respectively.
The Chart below shows the difference in growth rates between QNA (COE) and LCI indices expressed as percentage points.
|
|||
| 8.4. Coherence - sub annual and annual statistics | |||
The LCI is produced quarterly and the data can be used to produce annual statistics. |
|||
| 8.5. Coherence - National Accounts | |||
not applicable |
|||
| 8.6. Coherence - internal | |||
Quality checks are undertaken during data production that ensure the LCI data are consistant over time. |
|||

|
|||
The ILCH release procedure will follow the National Statistics' Protocol for the release of data. Currently ILCH is published as an ‘experimental’ statistic and not as a full National Statistic. Each quarter, ILCH is published according to Office for National Statistics’ recommended format for accessible content as a combination of HTML web pages for narrative, interactive charts and graphs, with data provided in Excel. There is also the option to options to download the statistical bulletin in PDF format and customisable ‘explorable data’ in CSV, XLS and XML formats are currently being developed.
The published estimates currently include a time series from Q1 2000 onwards of index values and growth rates for nine key sectors, and indices for 24 industries. The transmitted indices and metadata is sent to Eurostat in electronic form, in line with the specification provided by Eurostat.
As of 1 July 2017, pre-release access to ONS statistics was removed in all but exceptional circumstances.
Annexes: Pre-release access |
|||
| 9.1. Dissemination format - News release | |||
See above. |
|||
| 9.2. Dissemination format - Publications | |||
See above. |
|||
| 9.3. Dissemination format - online database | |||
See above. |
|||
| 9.3.1. Data tables - consultations | |||
not applicable |
|||
| 9.4. Dissemination format - microdata access | |||
Microdata are not disseminated. |
|||
| 9.5. Dissemination format - other | |||
not applicable |
|||
| 9.6. Documentation on methodology | |||
The methodological document relating to ILCH is hyperlinked in the publication. The link is as follows: |
|||
| 9.7. Quality management - documentation | |||
Information is available on the ILCH quality and methodology information document: |
|||
| 9.7.1. Metadata completeness - rate | |||
Not requested. |
|||
| 9.7.2. Metadata - consultations | |||
Not requested. |
|||
|
|||
ILCH (and the LCI) are created using several different existing data sources and surveys, and therefore there is no direct cost or burden as a result of producing these statistics. |
|||
|
|||
| 11.1. Confidentiality - policy | |||
ILCH and LCI are created using existing sources (rather than having its own survey to collect LCI specific data). The data provided to us by the Labour Force Survey is aggregated and individuals cannot be identified from this. Individuals cannot be identified from the Monthly Wages and Salaries Survey due to the use of a unique identifier for each company. All other inputs are used to create a factor for calculating non-wage costs and therefore individuals cannot be identified from these. All input and output data are handled securely and access is not granted to anyone unless there is a business need and they agree to the terms of confidentiality and security. |
|||
| 11.2. Confidentiality - data treatment | |||
All input and output data are handled securely and access is not granted to anyone unless there is a business need and they agree to the terms of confidentiality and security. |
|||
|
|||
Not available. |
|||
|
|||
|
|||