|
 |
|
| For any question on data and metadata, please contact: Eurostat user support |
|
|||
| 1.1. Contact organisation | Statistics Sweden |
||
| 1.2. Contact organisation unit | Economic Statistics Department Salaries and Employment |
||
| 1.5. Contact mail address | Statistics Sweden - SCB |
||
|
|||
| 2.1. Data description | |||
The Swedish labour cost index (LCI) has been transmitted to Eurostat since 1996. Only the private sector was measured until 2007. From 2008 and onwards, the entire public sector is included as well. The main sources for LCI are: Short-term statistics, salaries, in the municipalities (KLK), Short-term statistics, salaries, in the county councils (KLL), Short-term statistics, wages and salaries, private sector (KLP) and Short-term statistics, salaries, governmental sector (KLS). |
|||
| 2.2. Classification system | |||
The Swedish LCI covers sections B-S according to NACE Rev. 2 |
|||
| 2.3. Coverage - sector | |||
The Swedish LCI measures quarterly developments in Swedish labour cost per hour worked in the overall Swedish economy and covers the private sector enterprises as well as the public institutions. |
|||
| 2.4. Statistical concepts and definitions | |||
Labour cost per hour worked. |
|||
| 2.5. Statistical unit | |||
Enterprises |
|||
| 2.6. Statistical population | |||
All of the governmental sector, municipalities and the county councils. For the private sector enterprises with five or more employees. Employees from 18 to 66 years old are included from 2015. Up until 2014 employees from 18 to 64 years old are included. |
|||
| 2.7. Reference area | |||
Sweden |
|||
| 2.8. Coverage - Time | |||
First quarter of 1996 until fourth quarter of 2007 for the private sector. First quarter of 2008 onwards for the whole economy. |
|||
| 2.9. Base period | |||
2016 |
|||
|
|||
| 3.1. Source data | |||
LCI is based largely on the survey Short-term statistics, wages and salaries, private sector (KLP), Short-term statistics, salaries, in the county councils (KLL), Short-term statistics, salaries, governmental sector (KLS) and Short-term statistics, salaries, in the municipalities (KLK). Only the Short-term statistics, wages and salaries, private sector (KLP) is sampled. The other sources are completely surveyed and covers the entire population of employees, employed by the central government, municipalities and county councils. For more information see "6.3.4.1 Imputation - rate". |
|||
| 3.2. Frequency of data collection | |||
The source data is collected monthly. |
|||
| 3.3. Data collection | |||
All surveyed units send data to Statistics Sweden's corresponding short term statistics surveys (private, municipalities, county councils and central government) on a monthly basis, mainly via our web-based applications. |
|||
| 3.4. Data validation | |||
The data is thouroughly validated in accordance with Statistics Sweden's internal processes. |
|||
| 3.5. Data compilation | |||
The four primary sources collect the same variables, but from different sectors. |
|||
| 3.6. Adjustment | |||
To cohere with Eurostat’s standards Statistics Sweden use a cut-off model to calculate labour costs for companies with 1-4 employees in the private sector. For more information see concept in chapter 6.3.4.1. The data sent to Eurostat is seasonal adjusted, for seasonal adjustment see concept in chapter 6.4. Working-day effect is already adjusted in the underlying surveys for LCI and no extra adjustment is done. |
|||
|
|||
| 4.1. Quality assurance | |||
Data is validated internally before dissemination. |
|||
| 4.2. Quality management - assessment | |||
The four primary sources have been evaluated for many years and the quality of them is considered good. |
|||
|
|||
| 5.1. Relevance - User Needs | |||
The main users of Labour Cost Index (LCI) are the National Mediation Office, certain institutions within the European Commisson administration, financial analysts, Statistics Sweden and other national statistics offices. The objectives and the needs vary between different users. Some important areas where LCI is used are studies of inflation, wages and competitive advantages. Statistics Sweden has not received any calling attention that the LCI does not meet the needs of the users, apart from some demands of monthly series. |
|||
| 5.2. Relevance - User Satisfaction | |||
Regarding user satisfaction, Statistics Sweden assumes that one of the main users, Eurostat, is satisfied with the quality of the main results of the Swedish LCI. |
|||
| 5.3. Completeness | |||
For many years it was a problem for Sweden to include the public sector and irregular bonuses in the LCI. But, since the delivery of LCI Q1 2008 to Eurostat, bonuses for the private sector is included due to the annual bonus survey, which takes place in Sweden on behalf of the National Mediation Office (MI). From 2008 the public sector is also included in LCI, except for benefits (D1114) for county councils and municipalities. There is also a collected part of wages and hours from the municipalities, who are not industry specific and are therefore, on the advice of the statistical authority (The National Mediation Office), broken out on a number of industries within in the municipalities by size. In early 2012 Sweden began to report the LCI series seasonally adjusted according to NACE Rev.2. This means that all series (sections: B- N) are now available as seasonally adjusted from Q1 1999. From Januari 2015 the age demarcation has been increased from 18-64 years to 18-66 years for the employees in the Short-term statistics. Sweden deliver two series: Calendar adjusted data, not seasonally adjusted data and Seasonally and calendar adjusted data. Sweden are granted derogation from delivering Unadjusted data (i.e. neither seasonally adjusted nor calendar adjusted data). The reason for this is that the data from the surveys on Short-term statistics, salaries, already are calendar adjusted when collected. |
|||
| 5.3.1. Data completeness - rate | |||
The data completeness rate is 100 per cent. |
|||
|
||||||||||||||||||||||||||||||||||||||||||||||||||||||||||||||||||||||||||||||||||||||||||||||||||||||||||||||||||||||||||||||||||||||||||||||||||||||||||||||||||||||||||||||||
| 6.1. Accuracy - overall | ||||||||||||||||||||||||||||||||||||||||||||||||||||||||||||||||||||||||||||||||||||||||||||||||||||||||||||||||||||||||||||||||||||||||||||||||||||||||||||||||||||||||||||||||
The basis for calculating LCI come from four surveys, conducted monthly. See below. |
||||||||||||||||||||||||||||||||||||||||||||||||||||||||||||||||||||||||||||||||||||||||||||||||||||||||||||||||||||||||||||||||||||||||||||||||||||||||||||||||||||||||||||||||
| 6.2. Sampling error | ||||||||||||||||||||||||||||||||||||||||||||||||||||||||||||||||||||||||||||||||||||||||||||||||||||||||||||||||||||||||||||||||||||||||||||||||||||||||||||||||||||||||||||||||
LCI is based largely on Short-term statistics, wages and salaries, private sector (KLP), Short-term statistics, salaries, in the county councils (KLL), Short-term statistics, salaries, governmental sector (KLS) and Short-term statistics, salaries, in the municipalities (KLK). Only the Short-term statistics, wages and salaries, private sector (KLP) is sampled, the other sources are completely surveyed.
Sample size in KLP 2022
The selection of the private sector consists of approximately 6 100 companies with approximately 1.5 million employees, or about 2 percent of the enterprises and about 44 percent of employees in industry B-S. The Short-term statistics, wages and salaries, private sector (KLP) contains only companies with more than four employees. From the companies with more than four employees, the sample corresponds to about 6 percent of the total amount of companies and about 49 percent of the employees. For the public sector, census surveys are made for county councils, governmental sector and municipalities respectively. The following presents a summary of the number of enterprises and number of employees according to both KLP and the Business Register (FDB). Enterprises with 1 to 4 employees make up some 69 percents of all enterprises and some 10 percents of all employees. A model is used to estimate data for these enterprises, using KLP-figures on wages and number of employees of enterprises with 5 to 9 employees, in combination with figures from the Business Register (FDB), regarding enterprises with 1 to 4 and 5 to 9 employees. The model is based on the assumption that average cost and average number of hours worked is equal between enterprises employing 1 to 4 employees and those employing 5 to 9.
Population in the Business register 2021 (The sample for KLP is drawn in November the year before)
|
||||||||||||||||||||||||||||||||||||||||||||||||||||||||||||||||||||||||||||||||||||||||||||||||||||||||||||||||||||||||||||||||||||||||||||||||||||||||||||||||||||||||||||||||
| 6.2.1. Sampling error - indicators | ||||||||||||||||||||||||||||||||||||||||||||||||||||||||||||||||||||||||||||||||||||||||||||||||||||||||||||||||||||||||||||||||||||||||||||||||||||||||||||||||||||||||||||||||
Optional NACENACE |
||||||||||||||||||||||||||||||||||||||||||||||||||||||||||||||||||||||||||||||||||||||||||||||||||||||||||||||||||||||||||||||||||||||||||||||||||||||||||||||||||||||||||||||||
| 6.3. Non-sampling error | ||||||||||||||||||||||||||||||||||||||||||||||||||||||||||||||||||||||||||||||||||||||||||||||||||||||||||||||||||||||||||||||||||||||||||||||||||||||||||||||||||||||||||||||||
See below |
||||||||||||||||||||||||||||||||||||||||||||||||||||||||||||||||||||||||||||||||||||||||||||||||||||||||||||||||||||||||||||||||||||||||||||||||||||||||||||||||||||||||||||||||
| 6.3.1. Coverage error | ||||||||||||||||||||||||||||||||||||||||||||||||||||||||||||||||||||||||||||||||||||||||||||||||||||||||||||||||||||||||||||||||||||||||||||||||||||||||||||||||||||||||||||||||
LCI is based largely on Short-term statistics, wages and salaries, private sector (KLP), Short-term statistics, salaries in the county councils (KLL), Short-term statistics, salaries, governmental sector (KLS) and Short-term statistics, salaries, in the municipalities (KLK). Only the Short-term statistics, wages and salaries, private sector (KLP) is sampled, the other sources are completely surveyed. There is minimal coverage error in the sources. |
||||||||||||||||||||||||||||||||||||||||||||||||||||||||||||||||||||||||||||||||||||||||||||||||||||||||||||||||||||||||||||||||||||||||||||||||||||||||||||||||||||||||||||||||
| 6.3.1.1. Over-coverage - rate | ||||||||||||||||||||||||||||||||||||||||||||||||||||||||||||||||||||||||||||||||||||||||||||||||||||||||||||||||||||||||||||||||||||||||||||||||||||||||||||||||||||||||||||||||
No studies on coverage errors in the surveys are made. |
||||||||||||||||||||||||||||||||||||||||||||||||||||||||||||||||||||||||||||||||||||||||||||||||||||||||||||||||||||||||||||||||||||||||||||||||||||||||||||||||||||||||||||||||
| 6.3.1.2. Common units - proportion | ||||||||||||||||||||||||||||||||||||||||||||||||||||||||||||||||||||||||||||||||||||||||||||||||||||||||||||||||||||||||||||||||||||||||||||||||||||||||||||||||||||||||||||||||
In the surveys, there are no administrative sources. Three of the four sources are completely surveyed, while one source is a sample survey. No studies on coverage errors in the sample survey are made. |
||||||||||||||||||||||||||||||||||||||||||||||||||||||||||||||||||||||||||||||||||||||||||||||||||||||||||||||||||||||||||||||||||||||||||||||||||||||||||||||||||||||||||||||||
| 6.3.2. Measurement error | ||||||||||||||||||||||||||||||||||||||||||||||||||||||||||||||||||||||||||||||||||||||||||||||||||||||||||||||||||||||||||||||||||||||||||||||||||||||||||||||||||||||||||||||||
Measurement error largely occurs due to providers failing to understand information or provide data according to given instructions. No studies of measurement error in the survey is made. |
||||||||||||||||||||||||||||||||||||||||||||||||||||||||||||||||||||||||||||||||||||||||||||||||||||||||||||||||||||||||||||||||||||||||||||||||||||||||||||||||||||||||||||||||
| 6.3.3. Non response error | ||||||||||||||||||||||||||||||||||||||||||||||||||||||||||||||||||||||||||||||||||||||||||||||||||||||||||||||||||||||||||||||||||||||||||||||||||||||||||||||||||||||||||||||||
Non-response error is minimal in the public sector. In the private sector, the non-response rate of the surveyed employees was around 1,5 per cent for 2022. |
||||||||||||||||||||||||||||||||||||||||||||||||||||||||||||||||||||||||||||||||||||||||||||||||||||||||||||||||||||||||||||||||||||||||||||||||||||||||||||||||||||||||||||||||
| 6.3.3.1. Unit non-response - rate | ||||||||||||||||||||||||||||||||||||||||||||||||||||||||||||||||||||||||||||||||||||||||||||||||||||||||||||||||||||||||||||||||||||||||||||||||||||||||||||||||||||||||||||||||
The unit non-response rate was around 8 per cent for companies in the private sector. |
||||||||||||||||||||||||||||||||||||||||||||||||||||||||||||||||||||||||||||||||||||||||||||||||||||||||||||||||||||||||||||||||||||||||||||||||||||||||||||||||||||||||||||||||
| 6.3.3.2. Item non-response - rate | ||||||||||||||||||||||||||||||||||||||||||||||||||||||||||||||||||||||||||||||||||||||||||||||||||||||||||||||||||||||||||||||||||||||||||||||||||||||||||||||||||||||||||||||||
Optional |
||||||||||||||||||||||||||||||||||||||||||||||||||||||||||||||||||||||||||||||||||||||||||||||||||||||||||||||||||||||||||||||||||||||||||||||||||||||||||||||||||||||||||||||||
| 6.3.4. Processing error | ||||||||||||||||||||||||||||||||||||||||||||||||||||||||||||||||||||||||||||||||||||||||||||||||||||||||||||||||||||||||||||||||||||||||||||||||||||||||||||||||||||||||||||||||
See below |
||||||||||||||||||||||||||||||||||||||||||||||||||||||||||||||||||||||||||||||||||||||||||||||||||||||||||||||||||||||||||||||||||||||||||||||||||||||||||||||||||||||||||||||||
| 6.3.4.1. Imputation - rate | ||||||||||||||||||||||||||||||||||||||||||||||||||||||||||||||||||||||||||||||||||||||||||||||||||||||||||||||||||||||||||||||||||||||||||||||||||||||||||||||||||||||||||||||||
Using figures in the Short-term statistics for private and public sector, the cut-off model and the different constants, calculations are carried out on sums of the cost components LCI_TOT, LCI_WAG, LCI_TXB and LCI_OTH as well as on number of hours worked by NACE Rev. 2 and quarter. By dividing these sums of costs respectively by the number of hours worked, an average hourly cost of each component is calculated. The enterprises in the sample report figures on wages and figures on number of hours worked as monthly aggregates for their manual workers and non-manual workers respectively. To obtain LCI, the sum of the monthly figures of each quarter is divided between the different NACE groups, stipulated by the regulation. For enterprises with 1 to 4 employees, number of hours worked is estimated by a model using the number of hours worked in enterprises with 5 to 9 employees from the KLP and figures on the number of employees in enterprises with 1 to 4 and 5 to 9 employees from the Business Register (FDB). No administrative data is used to calculate LCI. However, some standard components are used to calculate cost components not obtainable from the KLP, KLL, KLK and KLS: • Statutory and agreed social contributions and wage taxes; calculated as a percentage of the wage sum – sources: Confederation of Swedish Enterprise, Swedish Association of Local Authorities and Regions (SALAR) and The Swedish Agency for Government Employers (SAGE). • Holiday pay – source: Confederation of Swedish Enterprise. • Absent time generating holiday pay funds – source: Labour Force Survey. • Compensation of lost pay due to nonbusiness days, benefits – source: the annual survey Wage and salary structures, private sector. • Bonus (private sector) – source: calculated using constants obtained from the annual bonus survey. |
||||||||||||||||||||||||||||||||||||||||||||||||||||||||||||||||||||||||||||||||||||||||||||||||||||||||||||||||||||||||||||||||||||||||||||||||||||||||||||||||||||||||||||||||
| 6.3.5. Model assumption error | ||||||||||||||||||||||||||||||||||||||||||||||||||||||||||||||||||||||||||||||||||||||||||||||||||||||||||||||||||||||||||||||||||||||||||||||||||||||||||||||||||||||||||||||||
Optional |
||||||||||||||||||||||||||||||||||||||||||||||||||||||||||||||||||||||||||||||||||||||||||||||||||||||||||||||||||||||||||||||||||||||||||||||||||||||||||||||||||||||||||||||||
| 6.4. Seasonal adjustment | ||||||||||||||||||||||||||||||||||||||||||||||||||||||||||||||||||||||||||||||||||||||||||||||||||||||||||||||||||||||||||||||||||||||||||||||||||||||||||||||||||||||||||||||||
The seasonal adjustments are done according to the internal guidelines at Statistics Sweden, which are based on the ESS Guidelines. The seasonal adjustment is performed by the procedure PROC X12 in SAS 9.4, which is originally based on X12-ARIMA methodology developed by U.S Census Bureau. The models will be re-identified once a year, and coefficients are estimated every time the new or revised data is available. The series are seasonally adjusted separately and by a direct approach. The outlier treatment is performed by a completely automatic procedure. Relevant diagnostics tables are saved after the seasonal adjustment, in order to make it possible to evaluate the results from each different production occasion. Annexes: SA-template for quality reporting |
||||||||||||||||||||||||||||||||||||||||||||||||||||||||||||||||||||||||||||||||||||||||||||||||||||||||||||||||||||||||||||||||||||||||||||||||||||||||||||||||||||||||||||||||
| 6.5. Data revision - policy | ||||||||||||||||||||||||||||||||||||||||||||||||||||||||||||||||||||||||||||||||||||||||||||||||||||||||||||||||||||||||||||||||||||||||||||||||||||||||||||||||||||||||||||||||
6.5.1 NACE Rev. 1
|
||||||||||||||||||||||||||||||||||||||||||||||||||||||||||||||||||||||||||||||||||||||||||||||||||||||||||||||||||||||||||||||||||||||||||||||||||||||||||||||||||||||||||||||||
| 6.6. Data revision - practice | ||||||||||||||||||||||||||||||||||||||||||||||||||||||||||||||||||||||||||||||||||||||||||||||||||||||||||||||||||||||||||||||||||||||||||||||||||||||||||||||||||||||||||||||||
For more information see 6.5. |
||||||||||||||||||||||||||||||||||||||||||||||||||||||||||||||||||||||||||||||||||||||||||||||||||||||||||||||||||||||||||||||||||||||||||||||||||||||||||||||||||||||||||||||||
| 6.6.1. Data revision - average size | ||||||||||||||||||||||||||||||||||||||||||||||||||||||||||||||||||||||||||||||||||||||||||||||||||||||||||||||||||||||||||||||||||||||||||||||||||||||||||||||||||||||||||||||||
Optional |
||||||||||||||||||||||||||||||||||||||||||||||||||||||||||||||||||||||||||||||||||||||||||||||||||||||||||||||||||||||||||||||||||||||||||||||||||||||||||||||||||||||||||||||||
|
|||
| 7.1. Timeliness | |||
2022Q1: t+ 70 days 2022Q2: t+ 70 days 2022Q3: t+ 70 days 2022Q4: t+ 70 days |
|||
| 7.1.1. Time lag - first result | |||
No national publication of results from the delivered LCI has been made in Sweden. For more information see 9. Accessibility and clarity. |
|||
| 7.1.2. Time lag - final result | |||
No national publication of results from the delivered LCI has been made in Sweden. For more information see 9. Accessibility and clarity. |
|||
| 7.2. Punctuality | |||
LCI was delivered on time for the year 2022. |
|||
| 7.2.1. Punctuality - delivery and publication | |||
2022Q1: +/- 0 days 2022Q2: +/- 0 days 2022Q3: +/- 0 days 2022Q4: +/- 0 days |
|||
|
|||||||||||||||||||||||||||||||||||||||||||||||||||
Internal coherence |
|||||||||||||||||||||||||||||||||||||||||||||||||||
| 8.1. Comparability - geographical | |||||||||||||||||||||||||||||||||||||||||||||||||||
The LCI for Sweden is not divided into regions. |
|||||||||||||||||||||||||||||||||||||||||||||||||||
| 8.1.1. Asymmetry for mirror flow statistics - coefficient | |||||||||||||||||||||||||||||||||||||||||||||||||||
Not relevant |
|||||||||||||||||||||||||||||||||||||||||||||||||||
| 8.2. Comparability - over time | |||||||||||||||||||||||||||||||||||||||||||||||||||
NACE Rev. 2 |
|||||||||||||||||||||||||||||||||||||||||||||||||||
| 8.2.1. Length of comparable time series | |||||||||||||||||||||||||||||||||||||||||||||||||||
See above |
|||||||||||||||||||||||||||||||||||||||||||||||||||
| 8.3. Coherence - cross domain | |||||||||||||||||||||||||||||||||||||||||||||||||||
Fore more information see 8.5 |
|||||||||||||||||||||||||||||||||||||||||||||||||||
| 8.4. Coherence - sub annual and annual statistics | |||||||||||||||||||||||||||||||||||||||||||||||||||
Not available. |
|||||||||||||||||||||||||||||||||||||||||||||||||||
| 8.5. Coherence - National Accounts | |||||||||||||||||||||||||||||||||||||||||||||||||||
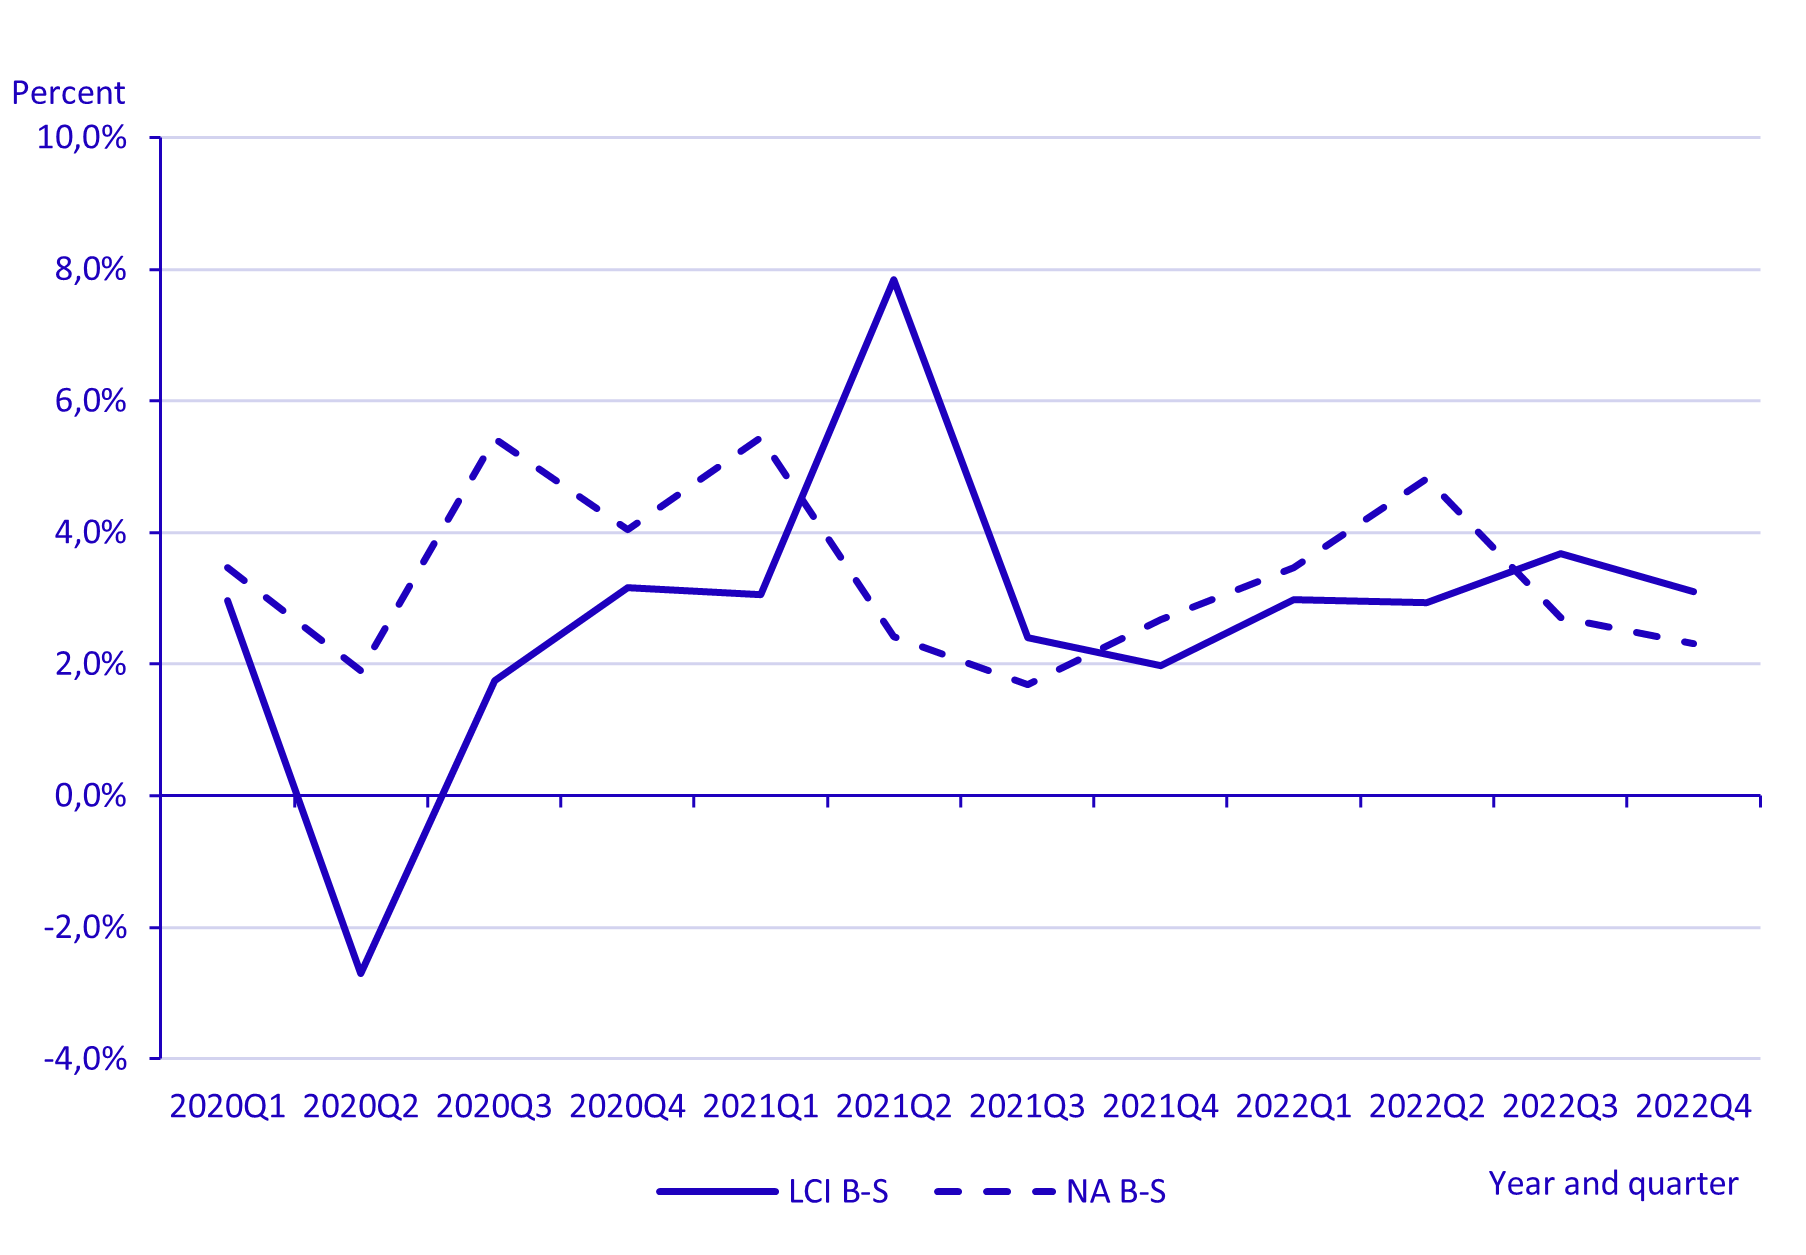
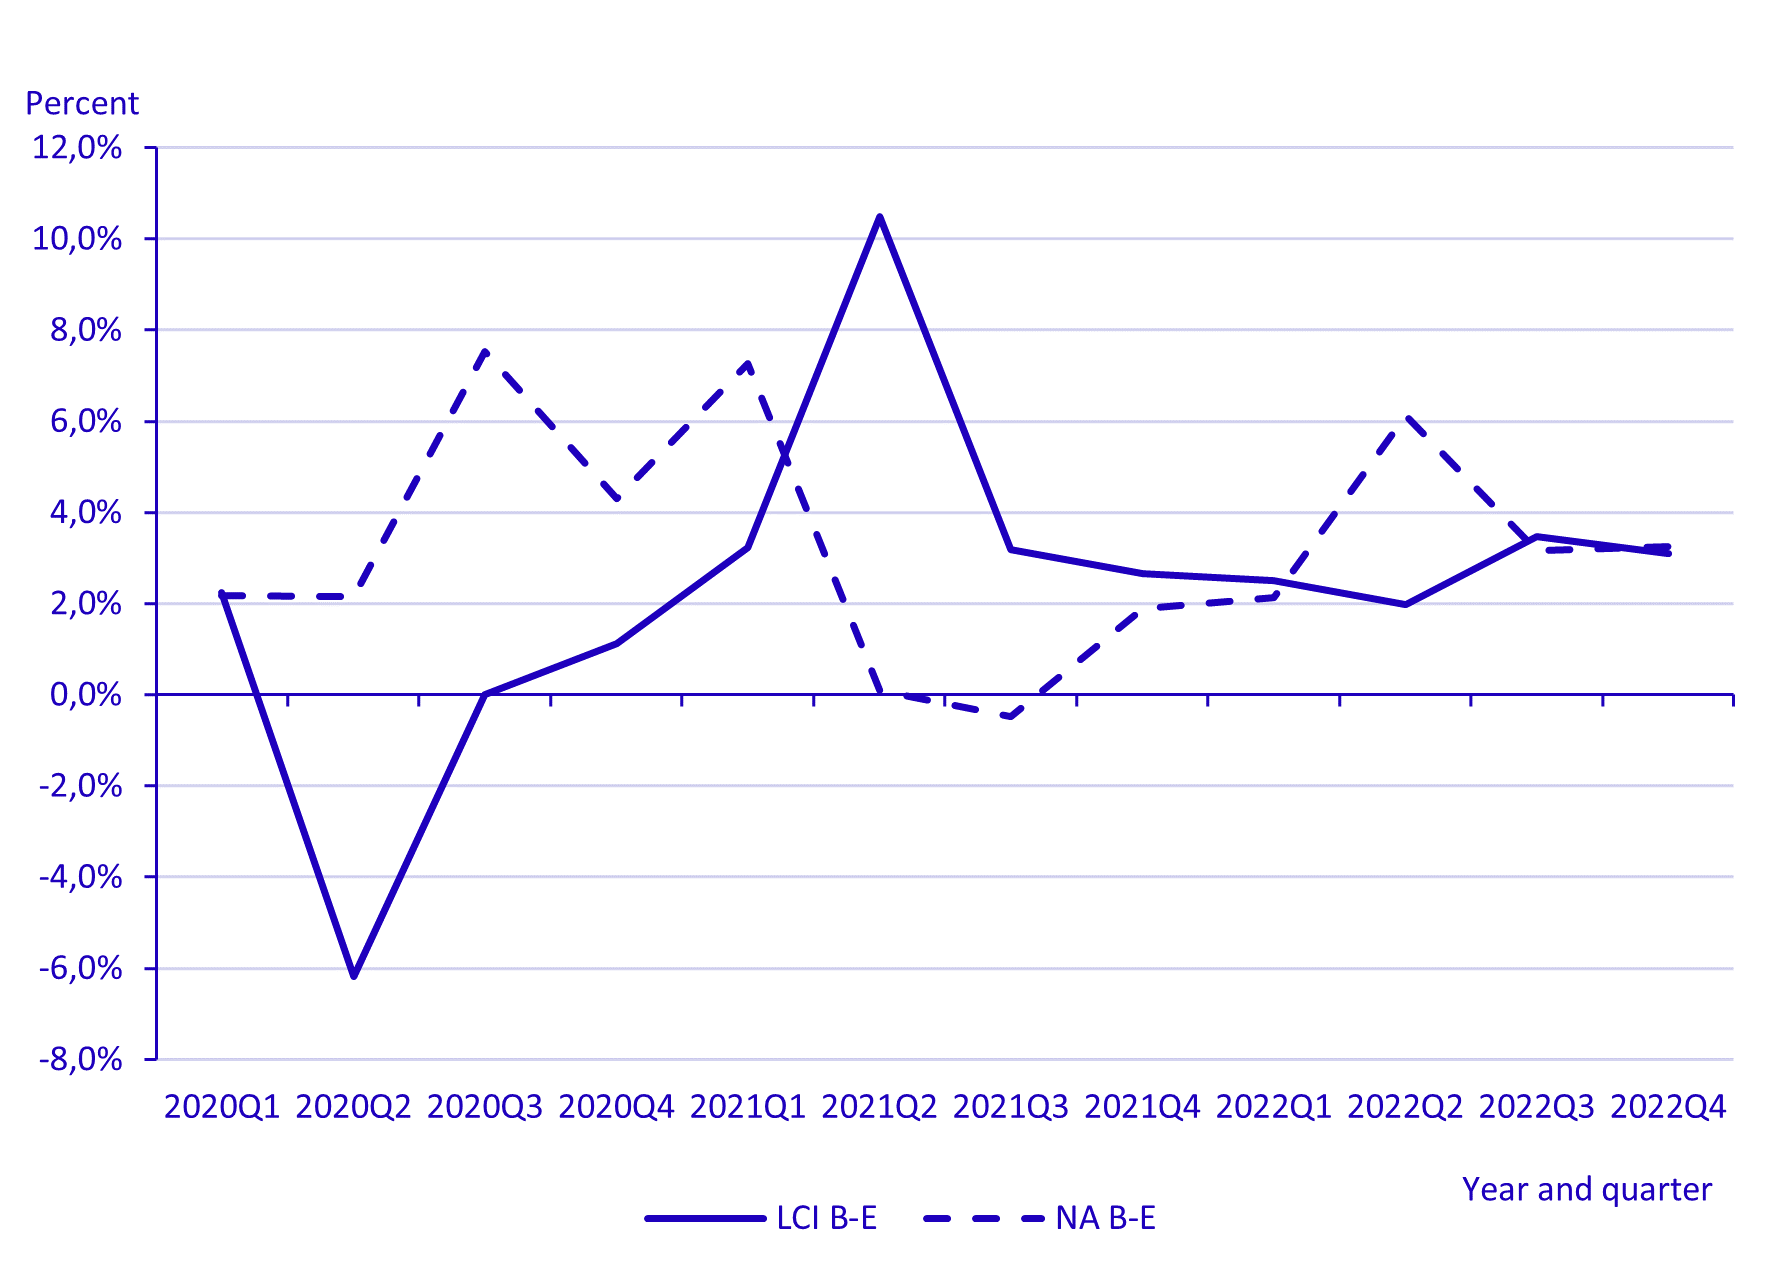
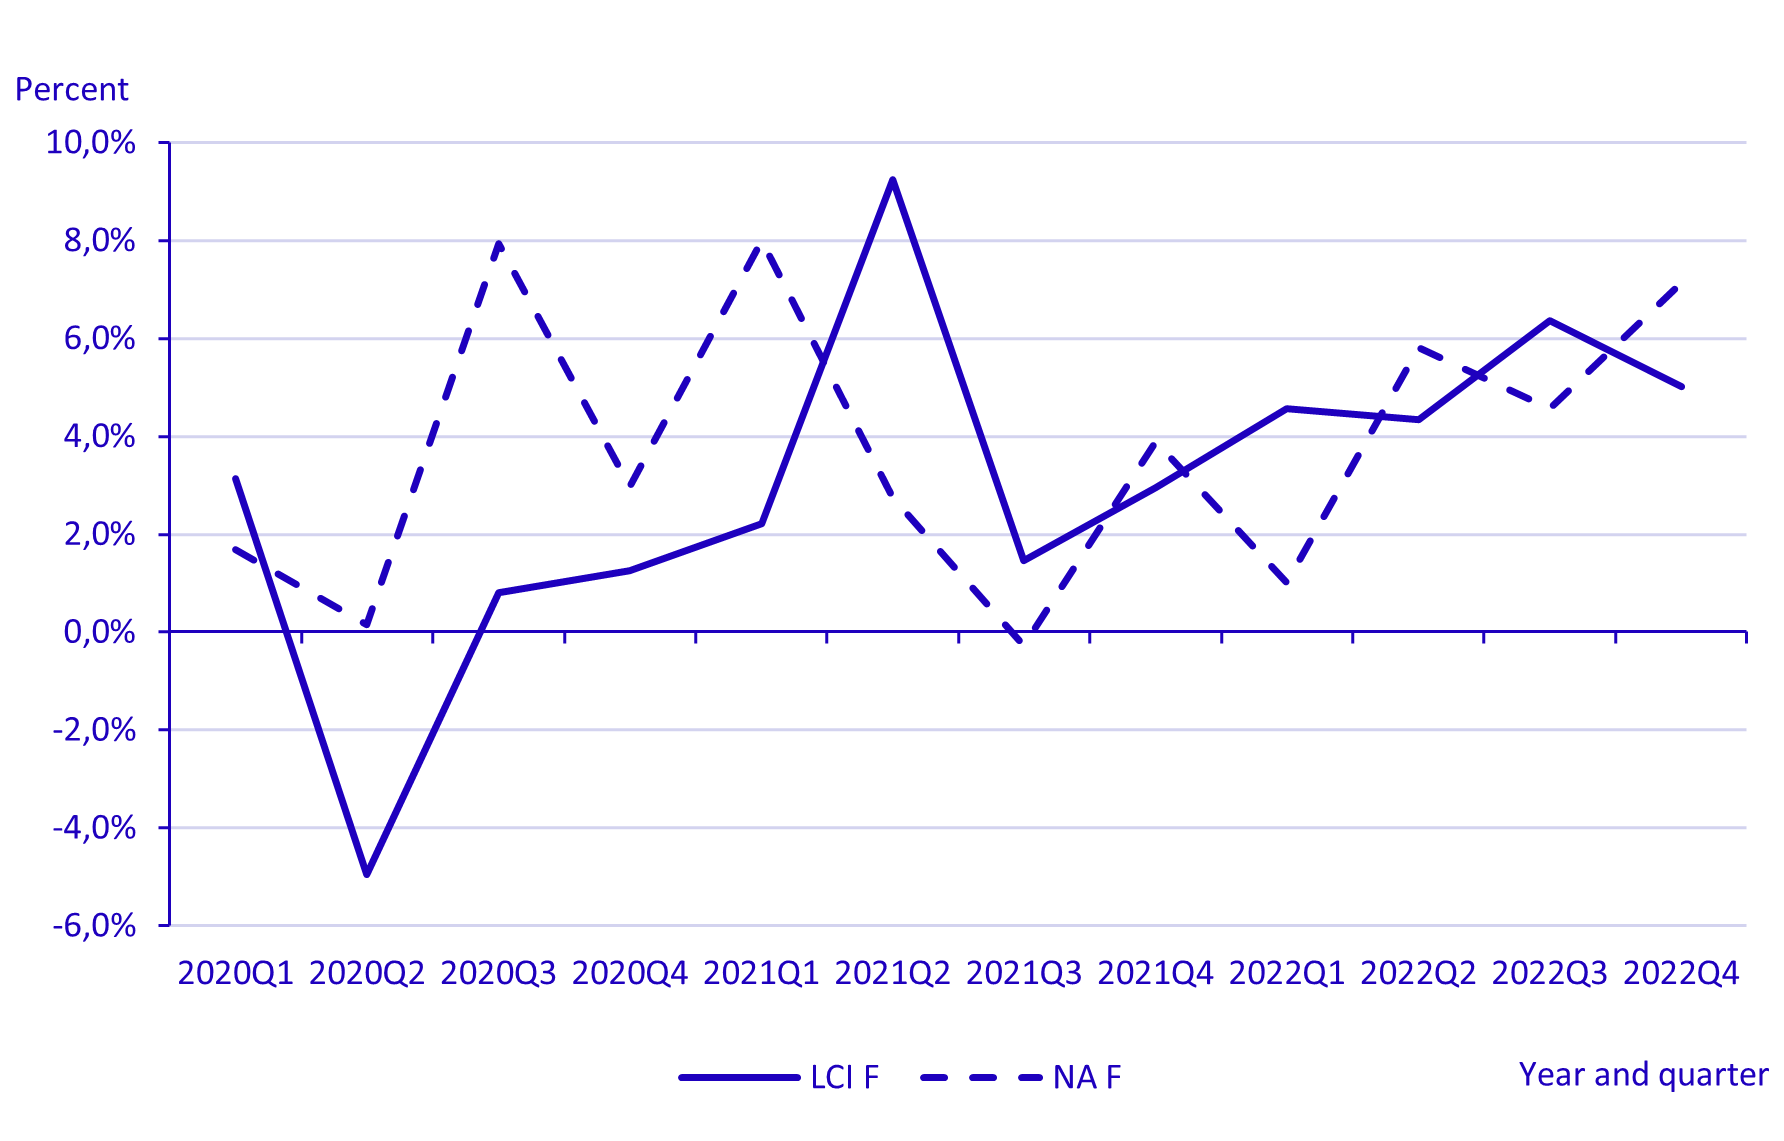
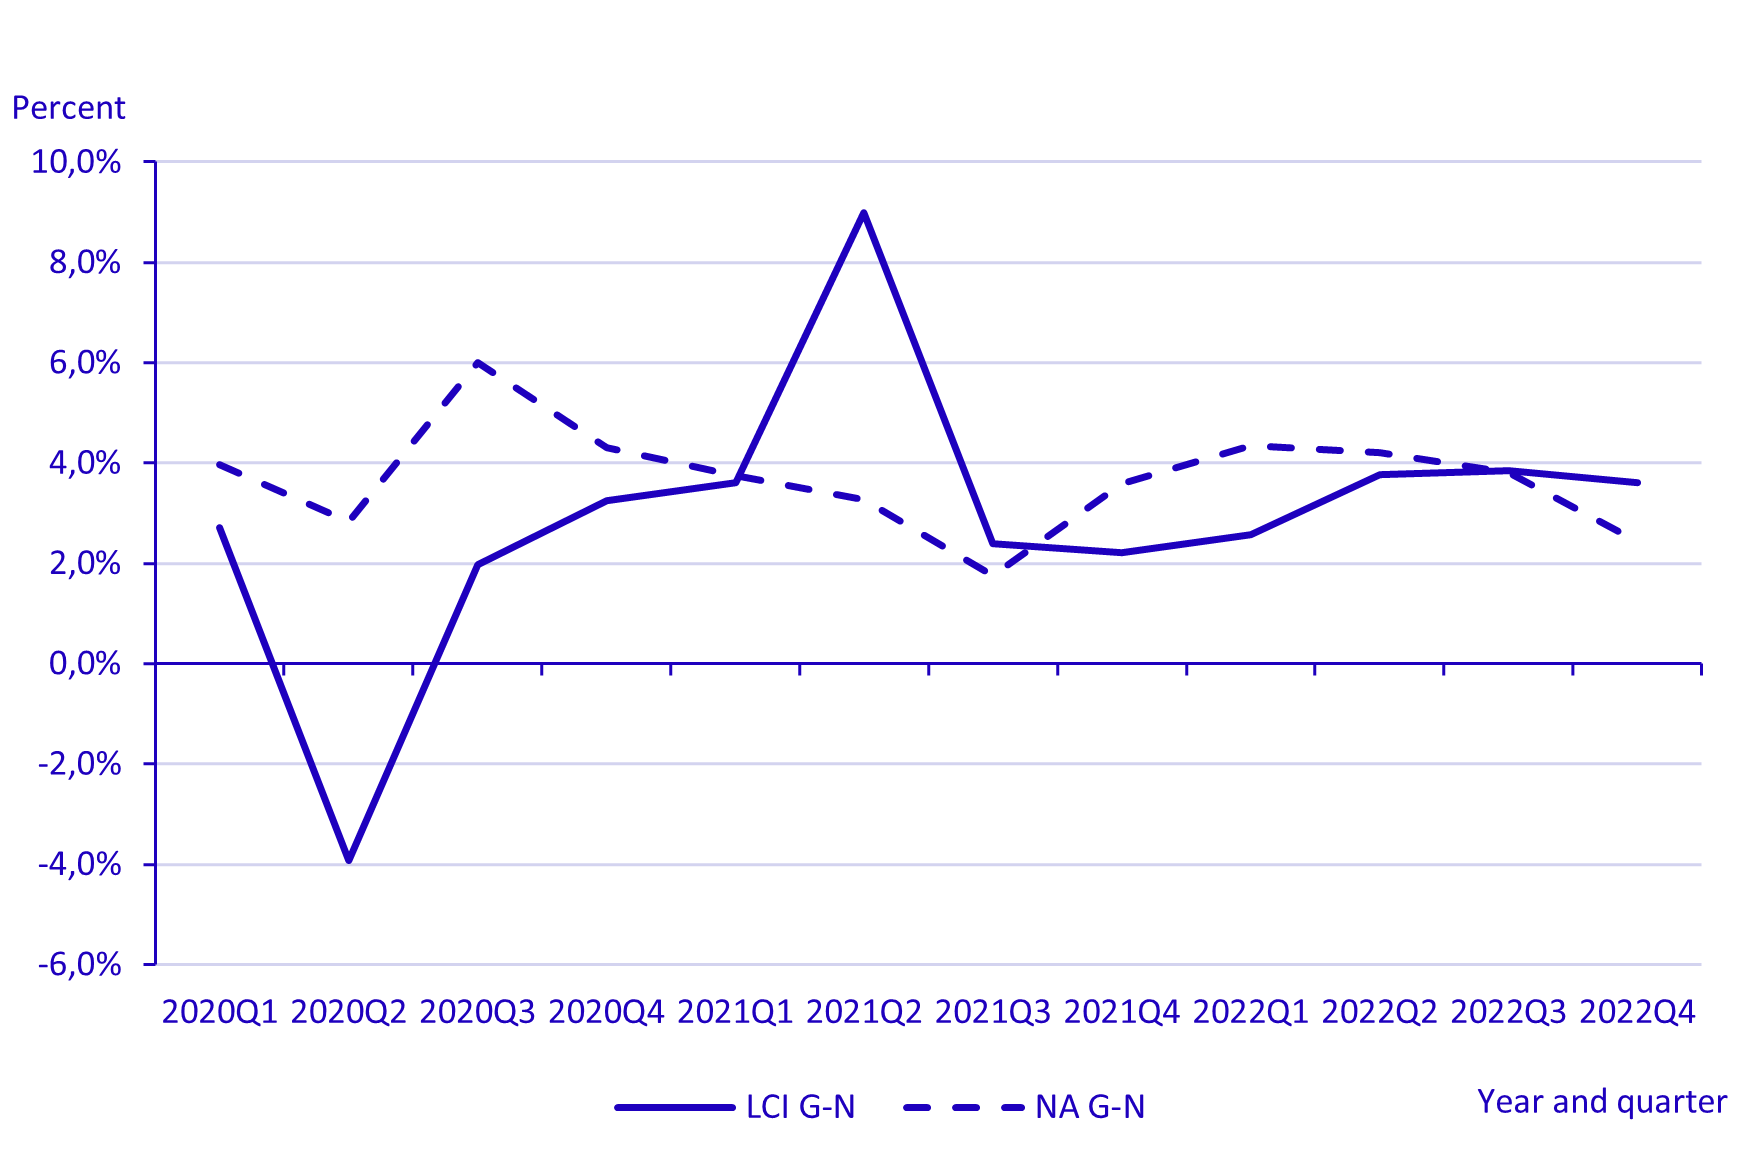
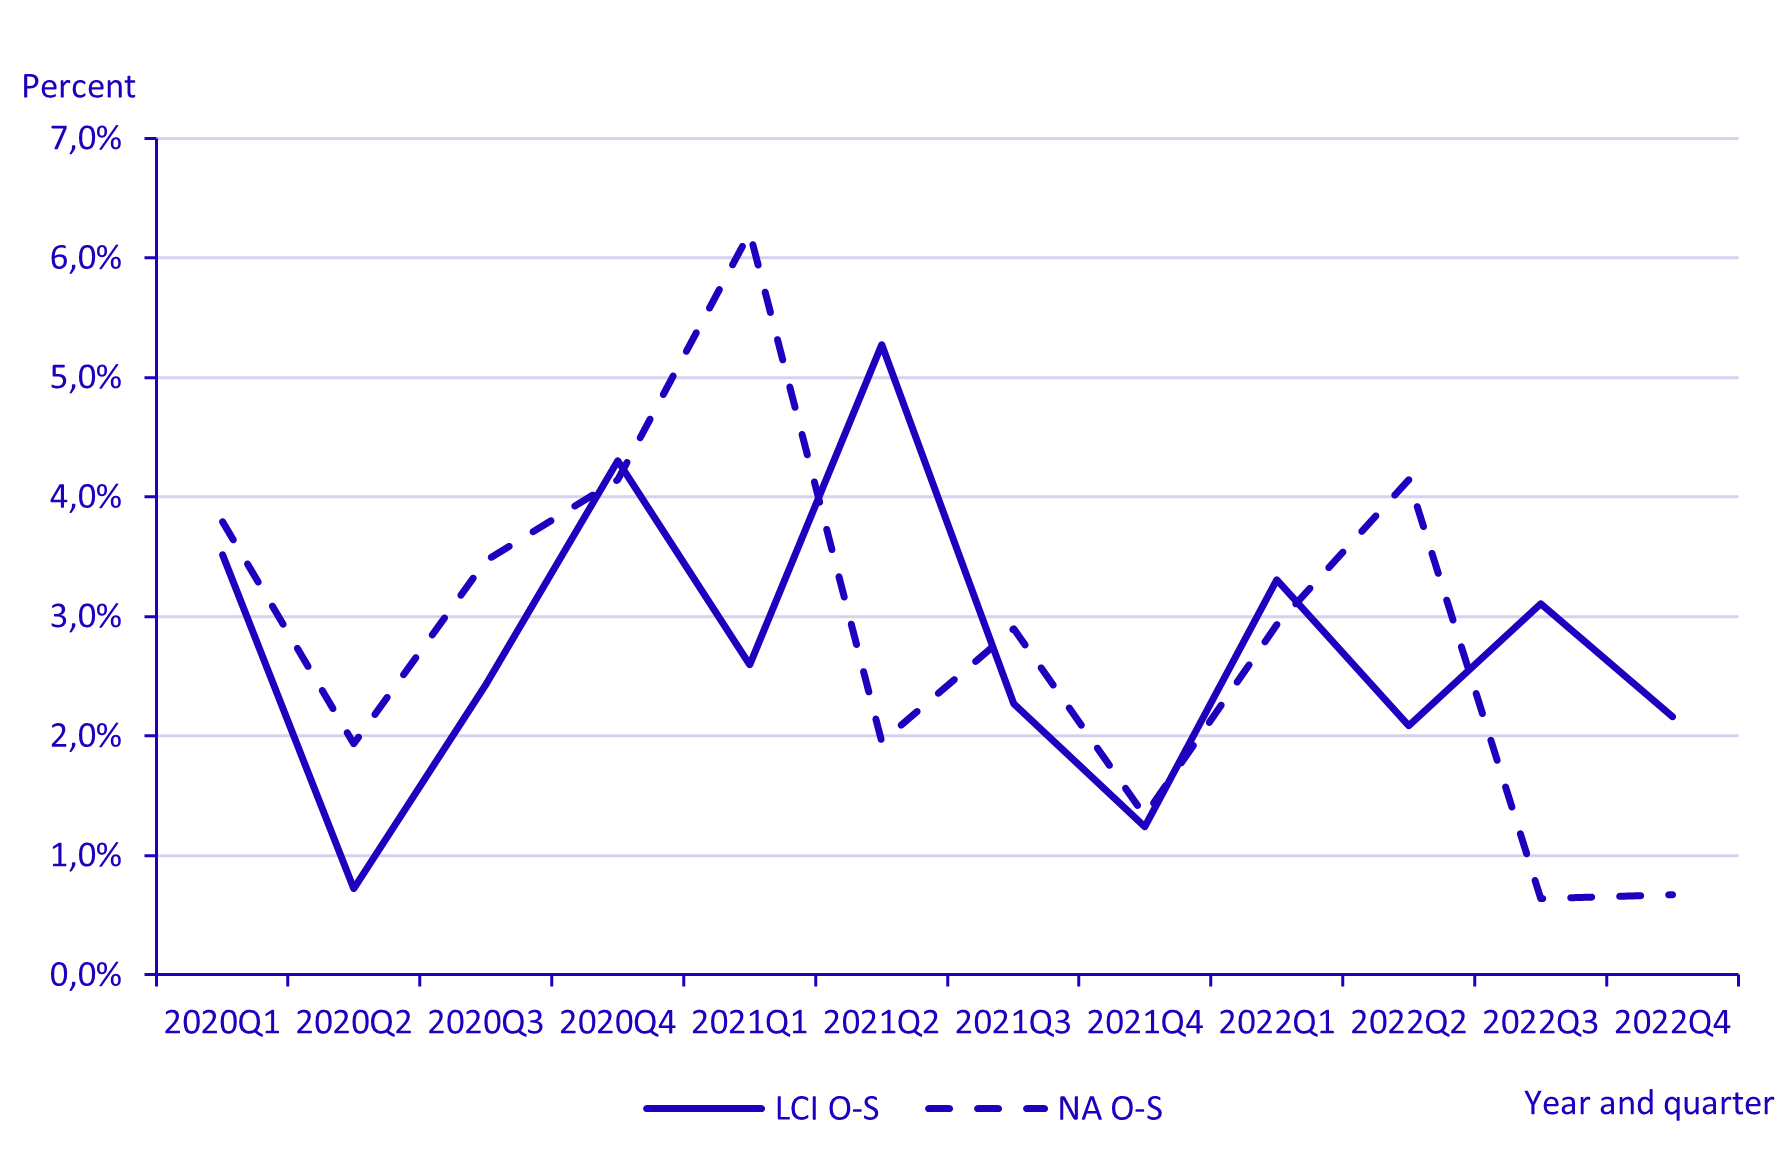
Below is presented a comparison between the change in labour cost per hour from the national accounts (NA) and the change in the LCI for the years 2020 to 2022. The reason that the percental change differs between LCI and NA is mainly because they use different sources and that LCI is not available in unadjusted series. The percentage change for NA is calculated from unadjusted series where hours worked varies. This is the case for both the table and the diagrams below. Percentage change compared to same period in previous year, LCI and NA
*LCI is calendar adjusted, not seasonally adjusted. LCI results are compiled on the data described in section 6.3.4.1. Enterprises with 1-4 employees are model calculated.
Annual change in labour cost per hour per quarter, LCI and NA, NACE B-S Annual change in labour cost per hour per quarter, LCI and NA, NACE B-E
Annual change in labour cost per hour per quarter, LCI and NA, NACE F Annual change in labour cost per hour per quarter, LCI and NA, NACE G-N
Labour cost per hour per quarter, LCI and NA, NACE O-SAnnual change |
|||||||||||||||||||||||||||||||||||||||||||||||||||
| 8.6. Coherence - internal | |||||||||||||||||||||||||||||||||||||||||||||||||||
Quality checks are undertaken during data production that ensure the LCI data are consistant over time. |
|||||||||||||||||||||||||||||||||||||||||||||||||||
|
|||
No national publication of results from the delivered LCI has been made in Sweden, and no results from the survey have been sent to the reporting units during the last year. Statistics Sweden's website has links to Eurostat's database. |
|||
| 9.1. Dissemination format - News release | |||
For more information see 7.1.1. |
|||
| 9.2. Dissemination format - Publications | |||
For more information see 7.1.1. |
|||
| 9.3. Dissemination format - online database | |||
Not available. |
|||
| 9.3.1. Data tables - consultations | |||
Optional |
|||
| 9.4. Dissemination format - microdata access | |||
Optional |
|||
| 9.5. Dissemination format - other | |||
Optional |
|||
| 9.6. Documentation on methodology | |||
Not available. |
|||
| 9.7. Quality management - documentation | |||
Not available. |
|||
| 9.7.1. Metadata completeness - rate | |||
Optional |
|||
| 9.7.2. Metadata - consultations | |||
Optional |
|||
|
|||
The burden for respondents has been estimated to approximate 20 minutes per survey. |
|||
|
|||
| 11.1. Confidentiality - policy | |||
The information that is reported to Statistic Sweden is protected by confidentiality according to chapter 24 section 8 of the Secrecy Act (2009:400). |
|||
| 11.2. Confidentiality - data treatment | |||
We do among other things a disclosure control on all data before delivering. |
|||
|
|||
|
. |
|||
|
|||
|
|||