|
 |
| For any question on data and metadata, please contact: Eurostat user support |
|
|||
| 1.1. Contact organisation | Statistical office of the Republic of Slovenia |
||
| 1.2. Contact organisation unit | Social services statistics section |
||
| 1.5. Contact mail address | Statistični urad Republike Slovenije |
||
|
|||
| 2.1. Metadata last certified | 30/05/2024 | ||
| 2.2. Metadata last posted | 30/05/2024 | ||
| 2.3. Metadata last update | 30/05/2024 | ||
|
||||||||||||||||||||||||||||||||||||||||||||||||||||
| 3.1. Data description | ||||||||||||||||||||||||||||||||||||||||||||||||||||
The Community Innovation Survey (CIS) is a survey about innovation activities in enterprises. The survey is designed to collect the information on types of innovation, processes of development of innovation like cooperation patterns, financing and expenditure, objectives of innovation activities or barriers for initiating or implementing innovation. The CIS provides statistics by type of innovators, economic activity and size class of enterprises. The survey is currently carried out every two years across the EU Member States, EFTA countries and EU candidate countries.
In order to ensure comparability across countries, Eurostat together with the countries develops a Harmonised Data Collection (HDC) questionnaire and drafts the methodological recommendations for implementation of each survey round.
CIS 2020 is a second in a row to implement concepts and methodology of the Oslo Manual 4th Edition revised in 2018. The changes in the CIS driven by the revision of the manual and their impact on collected indicators are described in the Statistics Explained article: Community Innovation Survey – new features.
The legal framework for CIS since 2012 is the Commission Regulation No 995/2012 that establishes the quality conditions for the data collection and transmission and identifies the obligatory cross-coverage of economic sectors, size class of enterprises and innovation indicators. The target population are enterprises with at least 10 employees classified in the core NACE economic sectors (see 3.3). Further activities may be covered on a voluntary basis in national datasets. Most statistics are based on the 3-year reference period (t, t-1, t-2), but some use only one calendar year (t or t-2). Please refer to the Annex section of the European metadata (ESMS) for details of the time coverage of collected indicators. |
||||||||||||||||||||||||||||||||||||||||||||||||||||
| 3.2. Classification system | ||||||||||||||||||||||||||||||||||||||||||||||||||||
Indicators related to the enterprises are classified by country, economic activity (NACE Rev. 2), size class of enterprises and type of innovation.
The main typology of classification of enterprises in reference to innovation is the distinction between innovation-active enterprises (INN) and not innovation-active enterprises (NINN). The enterprise is considered as innovative (INN) if during the reference period it successfully introduced a a) product or a) business process innovation, c) completed but not yet implemented the innovation, d) had ongoing innovation activities, e) abandoned innovation activities or was f) engaged in in-house R&D or R&D contracted out. Non-innovative (NINN) enterprises had no innovation activity mentioned above whatsoever during the reference period. |
||||||||||||||||||||||||||||||||||||||||||||||||||||
| 3.3. Coverage - sector | ||||||||||||||||||||||||||||||||||||||||||||||||||||
CIS covers main economic sectors according to NACE Rev.2 broken down by size class of enterprises and type of innovation activity. |
||||||||||||||||||||||||||||||||||||||||||||||||||||
| 3.3.1. Main economic sectors covered - NACE Rev.2 | ||||||||||||||||||||||||||||||||||||||||||||||||||||
In accordance with Commission Regulation 995/2012 on innovation statistics, the following industries and services are included in the core target population. Results are made available with these following breakdowns : All NACE – Core NACE (NACE Rev. 2 sections & divisions B-C-D-E-46-H-J-K-71-72-73 )
CORE INDUSTRY (excluding construction) (NACE Rev. 2 SECTIONS B_C_D_E) 10-12: Manufacture of food products, beverages and tobacco 13-15: Manufacture of textiles, wearing apparel, leather and related products 16-18: Manufacture of wood, paper, printing and reproduction 20: Manufacture of chemicals and chemical products 21: Manufacture of basic pharmaceutical products and pharmaceutical preparations 19-22: Manufacture of petroleum, chemical, pharmaceutical, rubber and plastic products 23: Manufacture of other non-metallic mineral products 24: Manufacture of basic metals 25: Manufacture of fabricated metal products, except machinery and equipment 26: Manufacture of computer, electronic and optical products 25-30: Manufacture of fabricated metal products (except machinery and equipment), computer, electronic and optical products, electrical equipment, motor vehicles and other transport equipment 31-33: Manufacture of furniture; jewellery, musical instruments, toys; repair and installation of machinery and equipment
D: ELECTRICITY, GAS, STEAM AND AIR CONDITIONING SUPPLY
E: WATER SUPPLY; SEWERAGE, WASTE MANAGEMENT AND REMEDIATION ACTIVITIES 36: Water collection, treatment and supply 37-39: Sewerage, waste management, remediation activities
CORE SERVICES (NACE Rev. 2 sections & divisions 46-H-J-K-71-72-73)(NACE code in the tables = G46-M73_INN) 46: Wholesale trade, except of motor vehicles and motorcycles
H: TRANSPORTATION AND STORAGE 49-51: Land transport and transport via pipelines, water transport and air transport 52-53: Warehousing and support activities for transportation and postal and courier activities
J: INFORMATION AND COMMUNICATION 58: Publishing activities 61: Telecommunications 62: Computer programming, consultancy and related activities 63: Information service activities
K: FINANCIAL AND INSURANCE ACTIVITIES 64: Financial service activities, except insurance and pension funding 65: Insurance, reinsurance and pension funding, except compulsory social security 66: Activities auxiliary to financial services and insurance activities
M: PROFESSIONAL, SCIENTIFIC AND TECHNICAL ACTIVITIES 71: Architectural and engineering activities; technical testing and analysis 72: Scientific research and development 73: Advertising and market research 71-73: Architectural and engineering activities; technical testing and analysis; Scientific research and development; Advertising and market research
|
||||||||||||||||||||||||||||||||||||||||||||||||||||
| 3.3.1.1. Main economic sectors covered - NACE Rev.2 - national particularities | ||||||||||||||||||||||||||||||||||||||||||||||||||||
No deviations; all of the above NACE activities were included in core target population and form the brakedowns as defined above. |
||||||||||||||||||||||||||||||||||||||||||||||||||||
| 3.3.2. Sector coverage - size class | ||||||||||||||||||||||||||||||||||||||||||||||||||||
In accordance with Commission Regulation 995/2012 on innovation statistics, the following size classes of enterprises according to number of employees are included in the core target population of the CIS:
|
||||||||||||||||||||||||||||||||||||||||||||||||||||
| 3.3.2.1. Sector coverage - size class - national particularities | ||||||||||||||||||||||||||||||||||||||||||||||||||||
No deviations. |
||||||||||||||||||||||||||||||||||||||||||||||||||||
| 3.4. Statistical concepts and definitions | ||||||||||||||||||||||||||||||||||||||||||||||||||||
The description of concepts, definitions and main statistical variables is available in CIS 2020 European metadata file (ESMS) Results of the community innovation survey 2020 (CIS2020) (inn_cis12) in Eurostat database. |
||||||||||||||||||||||||||||||||||||||||||||||||||||
| 3.5. Statistical unit | ||||||||||||||||||||||||||||||||||||||||||||||||||||
Statistical unit is legal unit (LeU) from Statistical Business Register. |
||||||||||||||||||||||||||||||||||||||||||||||||||||
| 3.6. Statistical population | ||||||||||||||||||||||||||||||||||||||||||||||||||||
Core target population are all enterprises in CORE NACE activities (see 3.3.1) with 10 or more employees. |
||||||||||||||||||||||||||||||||||||||||||||||||||||
| 3.7. Reference area | ||||||||||||||||||||||||||||||||||||||||||||||||||||
The level of the reference area is the country of Slovenia (SI0). Regional dimension is not available. |
||||||||||||||||||||||||||||||||||||||||||||||||||||
| 3.8. Coverage - Time | ||||||||||||||||||||||||||||||||||||||||||||||||||||
Several rounds of Community Innovation Survey have been conducted so far at two-year interval since end of 90’s. |
||||||||||||||||||||||||||||||||||||||||||||||||||||
| 3.8.1. Participation in the CIS waves | ||||||||||||||||||||||||||||||||||||||||||||||||||||
*two reference periods can be distinguished for CIS light: 2000-2002 and 2001-2003 |
||||||||||||||||||||||||||||||||||||||||||||||||||||
| 3.9. Base period | ||||||||||||||||||||||||||||||||||||||||||||||||||||
Not relevant. |
||||||||||||||||||||||||||||||||||||||||||||||||||||
|
|||
CIS indicators are available according to 3 units of measure:
NR: Number for number of enterprises and number of persons employed. THS_EUR: Thousands of euros. All financial variables are provided in thousands of euros, i.e. Turnover or Innovation expenditure. PC: Percentage. The percentage is the ratio between the selected combinations of indicators. |
|||
|
|||
For CIS 2020, the time covered by the survey is the 3-year period from the beginning of 2018 to the end of 2020. Some questions and indicators refer to one year — 2020. The list of indicators covering the 3-year period and referring to one year according to the HDC is available in the Annex section of the European metadata (ESMS). |
|||
|
|||
| 6.1. Institutional Mandate - legal acts and other agreements | |||
CIS surveys are based on the Commission Regulation No 995/2012, implementing Decision No 1608/2003/EC of the European Parliament and of the Council on the production and development of Community statistics on science and technology. This Regulation establishes innovation statistics on a statutory basis and makes the delivery of certain variables compulsory e.g. innovation activities, cooperation, development, expenditures and turnover (see the Regulation). Each survey wave may additionally include further variables. In addition, the Regulation defines the obligatory cross-coverage of economic sectors and size class of enterprises. |
|||
| 6.1.1. National legislation | |||
|
|||
| 6.2. Institutional Mandate - data sharing | |||
Not requested. |
|||
|
|||
CIS data are transmitted to Eurostat via EDAMIS using the secured transmission system. |
|||
| 7.1. Confidentiality - policy | |||
Regulation (EC) No 223/2009 on European statistics (recital 24 and Article 20 (4)) of 11 March 2009 (OJ L 87,p.164), stipulates the need to establishe common principles and guidelines ensuring the confidentiality of data used for the production of European statistics and the access to those confidential data. All data collected and published by the Statistical Office are governed by the National Statistical Act (OJ) RS No. 45/95 and No. 9/01. |
|||
| 7.2. Confidentiality - data treatment | |||
Cell suppression is used for protection of sensitive cells. |
|||
|
|||
| 8.1. Release calendar | |||
The release calendar with advanced release dates for all months of the reference year is published at the beginnig of the year on a website of the Statistical Office of the RS. The release calendar is publicly accessible. |
|||
| 8.2. Release calendar access | |||
Link to release calendar: https://www.stat.si/StatWeb/en/ReleaseCal |
|||
| 8.3. Release policy - user access | |||
The most important information channel for data publication is the website https://www.stat.si/StatWeb/en. The Office publishes several types of serial publications, different series and other publications which are according to the content intended for different users (e.g. general public, professional public, statistical experts). Statistical data and information are always published at 10.30. All releases are announced at the Office’s website https://www.stat.si/StatWeb/en/ReleaseCal in Release calendar. None of the usres have a prior access to the data on other services. The simultaneous issue of the First Release is ensured. Same release policy applied to national release is applied to transmission to Eurostat. |
|||
|
|||
No deviations. CIS is conducted and disseminated at two-year interval in pair years. |
|||
|
|||||||||||||||
Accessibility and clarity refer to the simplicity and ease for users to access statistics using simple and user-friendly procedure, obtaining them in an expected form and within an acceptable time period, with the appropriate user information and assistance: a global context which finally enables them to make optimum use of the statistics. |
|||||||||||||||
| 10.1. Dissemination format - News release | |||||||||||||||
See below. |
|||||||||||||||
| 10.1.1. Availability of the releases | |||||||||||||||
|
|||||||||||||||
| 10.2. Dissemination format - Publications | |||||||||||||||
- Online database (containing all/most results) : SiStat Database, thems Development and Technology - Analytical publication (referring to all/most results) : / - Analytical publication (referring to specific results, e.g. only for one sector or one specific aspect) : / |
|||||||||||||||
| 10.3. Dissemination format - online database | |||||||||||||||
SiSTAT Database, themes Development and technology SiSTAT data portal provides a modern way of preparing and exporting data for selected categories. |
|||||||||||||||
| 10.3.1. Data tables - consultations | |||||||||||||||
Not requested. |
|||||||||||||||
| 10.4. Dissemination format - microdata access | |||||||||||||||
In Slovenia, the entities entitled to obtain the statistically protected microdata include the registered researchers. Basic instructions concerning the access and the use of statistically protected microdata are available on the website: http://www.stat.si/StatWeb/en/StaticPages/Index/For-Researchers. |
|||||||||||||||
| 10.4.1. Dissemination of microdata | |||||||||||||||
|
|||||||||||||||
| 10.5. Dissemination format - other | |||||||||||||||
The CIS data are transmited to Eurostat according to legislation in order to compile EU aggregates and for the dissemination of national data in Eurostat's dissemination database. |
|||||||||||||||
| 10.5.1. Metadata - consultations | |||||||||||||||
Not requested. |
|||||||||||||||
| 10.6. Documentation on methodology | |||||||||||||||
Methodological explanations for innovation statistics are available on the website: https://www.stat.si/statweb/en/Methods/QuestionnairesMethodologicalExplanationsQualityReports Theme: Development and Technology, Sub-theme: Researc, Development and Innovation. There is an automatic link to the methodological explanations, quality report and questionnaire. |
|||||||||||||||
| 10.6.1. Metadata completeness - rate | |||||||||||||||
Not requested. |
|||||||||||||||
| 10.7. Quality management - documentation | |||||||||||||||
Quality reports for innovation statistics are available on the website: https://www.stat.si/statweb/en/Methods/QuestionnairesMethodologicalExplanationsQualityReports Theme: Development and Technology, Sub-theme: Researc, Development and Innovation. There is an automatic link to the methodological explanations, quality report and questionnaire. |
|||||||||||||||
|
|||
| 11.1. Quality assurance | |||
Quality documentation can be reached on SURS website: https://www.stat.si/statWeb/en/Methods/QuestionnairesMethodologicalExplanationsQualityReports |
|||
| 11.2. Quality management - assessment | |||
CIS is produced in compliance with methodological requirements and standards. The survey type was on-line survey (questionnaires was filled out in electronic form). We also trained staff that can offer assistence to enterprises in completing the questionnaire through telephobe and e-mail. Data controls are implemented at both micro and macro levels. First controls are implemented already during the data collection phase and are included in the electronic questionnaire. These controls warn the respondent about inconsistent or illogical data he filled in. In the second phase, when the data are transferred to a different environment, additional logical controls of microdata are implemented, namely controls of variables for which we did not receive an answer (item non-response), inconsistency between tables, and controls on financial data that stand out (outliers). We contact key enterprises (those with more than 50 employees) by phone and check the data again and, if necessary, we correct or adjust the data with their approval. In the third phase, we also check item non-response and consistency between tables. These are mainly data corrections for units that we have not been able to contact, so we perform system corrections and imputations of the values of missing variables. We used the Hot Deck Imputation Methods and Nearest-Neighbour Imputation. In the last phase, controls prepared by Eurostat are included and, where appropriate, we also compare aggregate statistics with the previous period. |
|||
|
|||||||||||||||||||||
Relevance is the degree to which statistics meet current and potential users’ needs. It includes the production of all needed statistics and the extent to which concepts used (definitions, classifications etc.) reflect user needs. The aim is to describe the extent to which the statistics are useful to, and used by, the broadest array of users. For this purpose, statisticians need to compile information, firstly about their users and their needs. The CIS is based on a common questionnaire and a common survey methodology in order to achieve comparable, harmonised and high quality results for EU Member States, EFTA countries, Candidates and Associated countries. |
|||||||||||||||||||||
| 12.1. Relevance - User Needs | |||||||||||||||||||||
The users of the data are public sector, business entities whose activities are observed, national and foreign researches and students. Communication with individual reporting units and users of our statistical data is carried out directly by telephone, fax or e-mail, by interested persons visiting the consultant at SURS, and also through the SURS Information Centre within the User Relations Section. The most important part of communicating with users is done through the Statistical Advisory Committee for R&D and Technology. The Statistical Advisory Committee is a consultative body that enables the exchange of information and good practices, perceives the needs of domestic users of data and information in the fields of science, technology and innovation, and complements the surveys conducted both on the bases of EU legislation and the needs of domestic users (see 12.1.1.). |
|||||||||||||||||||||
| 12.1.1. Needs at national level | |||||||||||||||||||||
The most important part of communicating with users is done through the Statistical Advisory Committee for R&D and Technology. The Statistical Advisory Committee is a consultative body that enables the exchange of information and good practices, perceives the needs of domestic users of data and information in the fields of science, technology and innovation, and complements the surveys conducted both on the bases of EU legislation and the needs of domestic users. Members of the Statistical Advisory Committee are the most important users of R&D and innovation statistics coming from the field of science and research from the public sector and persons from the Statistical Office dealing with this area. Occasionally, depending on the topic discussed at the Statistical Advisory Committee, guests from various institutions are also invited. The Statistical Advisory Committee meets once per year. For more about the work of the committee see https://www.stat.si/StatWeb/en/NationalStatistics/AdvCommittees Communication with individual reporting units and users of our data is carried out directly by telephone, fax or e-mail, by visiting interested persons at the consultant, and also through the Information Centre of the Statistical Office within User Relations Section. |
|||||||||||||||||||||
| 12.2. Relevance - User Satisfaction | |||||||||||||||||||||
SURS measured general user satisfaction for the last time in 2021. Respondents assessed general satisfaction with SURS with the average score of 8.3 (on a scale from 1 – disagree completely to 10 – agree completely). Based on users’ feedback, we estimate that they are satisfied with the data on innovation activity (both with the amount of published data and the way they are published). |
|||||||||||||||||||||
| 12.3. Completeness | |||||||||||||||||||||
All statistics that are required by current Regulation are available. |
|||||||||||||||||||||
| 12.3.1. Data completeness - rate | |||||||||||||||||||||
Not requested. |
|||||||||||||||||||||
|
||||||||||||||||||||
| 13.1. Accuracy - overall | ||||||||||||||||||||
Accuracy in the statistical sense denotes the closeness of computations or estimates to the exact or true values. Statistics are not equal with the true values because of variability (the statistics change from implementation to implementation of the survey due to random effects) and bias (the average of the possible values of the statistics from implementation to implementation is not equal to the true value due to systematic effects). |
||||||||||||||||||||
| 13.2. Sampling error | ||||||||||||||||||||
That part of the difference between a population value and an estimate thereof, derived from a random sample, which is due to the fact that only a subset of the population is enumerated. |
||||||||||||||||||||
| 13.2.1. Sampling error - indicators | ||||||||||||||||||||
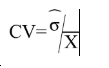
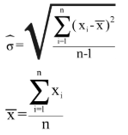
The main indicator used to measure sampling errors for CIS data is the coefficient of variation (CV).
Coefficient of Variation= (Square root of the estimate of the sampling variance) / (Estimated value) Formula: where
|
||||||||||||||||||||
| 13.2.1.1. Coefficient of variations for key variables | ||||||||||||||||||||
Coefficient of variation (%) for key variables by NACE categories and for enterprises with 10 and more employees
[1] = Coefficient of variation for the percentage of innovative enterprises (INN) in the total population of enterprises (ENT20) |
||||||||||||||||||||
| 13.2.1.2. Variance estimation method | ||||||||||||||||||||
SAS procedure PROC SURVEYMEANS was used, where stratified sampling design and overall weights (product of sampling weights and weights due to non-response) were taken into account. |
||||||||||||||||||||
| 13.3. Non-sampling error | ||||||||||||||||||||
Non-sampling errors occur in all phases of a survey. They add to the sampling errors (if present) and contribute to decreasing overall accuracy. It is important to assess their relative weight in the total error and devote appropriate resources for their control and assessment. |
||||||||||||||||||||
| 13.3.1. Coverage error | ||||||||||||||||||||
Coverage errors (or frame errors) are due to divergences between the target population and the frame population. The frame population is the set of target population members that has a chance to be selected into the survey sample. It is a listing of all items in the population from which the sample is drawn that contains contact details as well as sufficient information to perform stratification and sampling. |
||||||||||||||||||||
| 13.3.1.1. Over-coverage - rate | ||||||||||||||||||||
Not requested. |
||||||||||||||||||||
| 13.3.1.2. Common units - proportion | ||||||||||||||||||||
Not requested. |
||||||||||||||||||||
| 13.3.1.3. Under covered groups of the target population | ||||||||||||||||||||
There is no information available about under-coverage. |
||||||||||||||||||||
| 13.3.1.4. Coverage errors in coefficient variation | ||||||||||||||||||||
The overcoverage rate was 0.26%. The number of units representing over-coverage can be separated into units that are ineligible, since they were included in the frame due to lack of information and do not belong in the frame, and units that were eligible at the time of inclusion in the frame and became ineligible during the year (ceased to operate, changed activity). |
||||||||||||||||||||
| 13.3.2. Measurement error | ||||||||||||||||||||
Measurement errors occur during data collection and generate bias by recording values different than the true ones. The survey questionnaire used for data collection may have led to the recording of wrong values, or there may be respondent or interviewer bias. |
||||||||||||||||||||
| 13.3.2.1. Measures for reducing measurement errors | ||||||||||||||||||||
The survey type was on-line survey. The preparation of questionnaire also included the translation of the CIS questionnaire and guidelines for reporting units into the national language, and cooperation with experts at the national level and testing the understanding of questions and instructions with some reporting units. With the translation of the questionnaire and guidelines for reporting units into the national language, we also prepared the methodological notes. Enterprises were asked to fill out electronic version of the questionnaire in the eSTAT application. If the erroneous data are significant then we detect them through the logical controls, otherwise we detect them by coincidence. The electronic questionnaire included some basic controls, which alerted respondents in case of inconsistent or illogical answers. The intention of the controls was to increase the quality of provided data. Fundamentally there is no interviewer impact in the CIS survey since the data are gathered on electronic questionnaires. Some of the data for the CIS survey are taken over from administrative sources. Data on turnover and the number of employees are taken over from the database of accounts kept by the Agency of the Republic of Slovenia for Public Legal Records and Related Services (AJPES). AJPES collects data on the basis of the Companies Act (ZGD). Data on the share of tertiary educated personnel in the enterprise are taken over from the Statistical Register of Employment (SRDAP) kept by SURS. |
||||||||||||||||||||
| 13.3.3. Non response error | ||||||||||||||||||||
Non response occurs when a survey fails to collect data on all survey variables from all the population units designated for data collection in a sample or complete enumeration. There are two types of non-response: 1) Unit non-response, which occurs when no data (or so little as to be unusable) are collected about a population unit designated for data collection. a) Un-weighted unit non-response rate (%) = 100*(Number of units with no response or not usable response) / (Total number of in-scope (eligible) units in the sample) b) Weighted unit non-response rate (%) = 100*(Number of weighted units with no response or not usable response) / (Total number of in-scope (eligible) units in the sample) 2) Item non-response, which occurs when only data on some, but not all survey data items are collected about a population unit designated for data collection. a) Un-weighted item non-response rate (%) = 100*(Number of units with no response at all for the item) / (Total number of eligible, for the item, units in the sample i.e. filters have to be taken into account)
Unit non-response for CIS 2020 is 16.62% for un-weighted data and 13.46% for weighted data. To increase the response rate and limit unit non-response, enterprises that had not answered the questionnaire were cautioned a couple of days before the deadline via e-mail of the approaching deadline for reporting. Then two reminders were sent out after the deadline expired. If the questionnaire was not filled in despite the reminders additional telephone calls were made to key respondents. Item non-response rate for Turnover is 0% and consequently there is no imputation. Data are taken from administrative sources from the database of accounts kept by the Agency of the Republic of Slovenia for Public Legal Records and Related Services (AJPES). Item non-response rate for new questions is the highes (1.2%) for question 2.8 How important were the following factors related to climate change for your business. For other new questions the item non-response rate is 0%. |
||||||||||||||||||||
| 13.3.3.1. Unit non-response - rate | ||||||||||||||||||||
See below. |
||||||||||||||||||||
| 13.3.3.1.1. Un-weighted and weighted unit non-response rate by NACE categories and for enterprises with 10 or more employees | ||||||||||||||||||||
Un-weighted and weighted unit non-response rate by NACE categories and for enterprises with 10 or more employees
The number of eligible units is the number of sample units, which indeed belong to the target population. |
||||||||||||||||||||
| 13.3.3.1.2. Maximum number of recalls/reminders before coding | ||||||||||||||||||||
To increase the response rate and limit unit non-response, enterprises that had not answered yet were cautioned a couple of days before the deadline via e-mail of the approaching deadline for reporting. Two reminders were sent out after the deadline expired to all enterprises that have not yet filled out the questionnaire. If the questionnaire was not filled in despite the reminders additional telephone calls were made to key respondents. Key respondents are medium-sized and large enterprises (enterprises with more than 50 employees). |
||||||||||||||||||||
| 13.3.3.2. Item non-response - rate | ||||||||||||||||||||
See below. |
||||||||||||||||||||
| 13.3.3.2.1. Item non-response rate for Turnover (in Core NACE: B-C-D-E-46-H-J-K-71-72-73 enterprises with 10 or more employees) | ||||||||||||||||||||
Item non-response rate for Turnover (in Core NACE: B-C-D-E-46-H-J-K-71-72-73 enterprises with 10 or more employees).
Data on turnover are taken from administrative sources from the database of accounts kept by the Agency of the Republic of Slovenia for Public Legal Records and Related Services (AJPES). |
||||||||||||||||||||
| 13.3.3.2.2. Item non response rate for new questions | ||||||||||||||||||||
Item non-response rate for new questions in CIS t (in Core NACE: B-C-D-E-46-H-J-K-71-72-73 enterprises with 10 or more employees)
|
||||||||||||||||||||
| 13.3.4. Processing error | ||||||||||||||||||||
As in previous survey, innovation data was collected through electronic questionnaire. Reporting units were informed about the eSTAT application and about the open web innovation questionnaire. They were asked to fulfil the questionnaire. To reduce the phase of cleaning data some additional controls were included in the questionnaire. |
||||||||||||||||||||
| 13.3.5. Model assumption error | ||||||||||||||||||||
Not requested. |
||||||||||||||||||||
|
|||
Timeliness and punctuality refer to time and dates, but in a different manner. |
|||
| 14.1. Timeliness | |||
The timeliness of statistics reflects the length of time between data availability and the event or phenomenon they describe. |
|||
| 14.1.1. Time lag - first result | |||
Timeliness of national data – date of first release of national level : First Release was published on 22 April 2022. First data are issued with a notice called First Release (Innovation activity in industry and selected services) at 10:30 a.m. on SURS website. First Release is available within 16 months after the end of the reference period. Final data (detailed data published in database) are available 21 months after the end of the reference period.
The publication schedule is fixed and announced in advance. The First Release is published 16 months after the end of the reference year. Data are published as provisional data. In accordance with the announced publishing date (21 months after the reference year), the final detailed data were loaded into the SiSTAT database on a website of the Statistical Office of the Republic of Slovenia, created for user friendly free of charge data munipulation. |
|||
| 14.1.2. Time lag - final result | |||
Not requested. |
|||
| 14.2. Punctuality | |||
Punctuality refers to the time lag between the release date of data and the target date on which they were scheduled for release as announced officially. |
|||
| 14.2.1. Punctuality - delivery and publication | |||
Date of transmission of complete and validated data to Eurostat (Number of days between that data and 30 June 2022) : 0 |
|||
|
||||||||||||||||||||
Comparability aims at measuring the impact of differences in applied statistical concepts and definitions on the comparison of statistics between geographical areas, non-geographical domains, or over time. The coherence of statistical outputs refers to the degree to which the statistical processes by which they were generated used the same concepts (classifications, definitions, and target populations) and harmonised methods. Coherent statistical outputs have the potential to be validly combined and used jointly. |
||||||||||||||||||||
| 15.1. Comparability - geographical | ||||||||||||||||||||
Survey results are based on the requirements of the Regulation, which is in use in all EU Member States. This ensures a good comparability between national data in good-quality aggregates. |
||||||||||||||||||||
| 15.1.1. Asymmetry for mirror flow statistics - coefficient | ||||||||||||||||||||
Not requested. |
||||||||||||||||||||
| 15.1.2. National questionnaire – compliance with Eurostat model questionnaire | ||||||||||||||||||||
Methodological deviations from the CIS Harmonised Data Collection (HDC)
|
||||||||||||||||||||
| 15.1.3. National questionnaire – additional questions | ||||||||||||||||||||
Methodological deviations from the CIS Harmonised Data Collection (HDC)
|
||||||||||||||||||||
| 15.2. Comparability - over time | ||||||||||||||||||||
Due to important methodological changes driven by Oslo Manual 2018, CIS 2018 and CIS 2020 cannot be directly compared with previous CIS waves. |
||||||||||||||||||||
| 15.2.1. Length of comparable time series | ||||||||||||||||||||
Not requested. |
||||||||||||||||||||
| 15.3. Coherence - cross domain | ||||||||||||||||||||
See the comparison between SBS and CIS data in the section 15.3.3 below. |
||||||||||||||||||||
| 15.3.1. Coherence - sub annual and annual statistics | ||||||||||||||||||||
Not requested. |
||||||||||||||||||||
| 15.3.2. Coherence - National Accounts | ||||||||||||||||||||
Not requested. |
||||||||||||||||||||
| 15.3.3. Coherence – Structural Business Statistics (SBS) | ||||||||||||||||||||
This part compares key variables for aggregated CIS data with SBS data
* Numbers are to be provided for the last year of the reference period (t) |
||||||||||||||||||||
| 15.4. Coherence - internal | ||||||||||||||||||||
Not requested. |
||||||||||||||||||||
|
|||
Confidential information on the production cost of the CIS. |
|||
|
|||
| 17.1. Data revision - policy | |||
Not requested. |
|||
| 17.2. Data revision - practice | |||
Not requested. |
|||
| 17.2.1. Data revision - average size | |||
Not requested. |
|||
|
||||||||||||||||||||||||||||||||||||||
| 18.1. Source data | ||||||||||||||||||||||||||||||||||||||
See below: |
||||||||||||||||||||||||||||||||||||||
| 18.1.1. Sampling frame (or census frame) | ||||||||||||||||||||||||||||||||||||||
The sampling frame was made by using national business register. |
||||||||||||||||||||||||||||||||||||||
| 18.1.2. Sampling design | ||||||||||||||||||||||||||||||||||||||
The observation unit is selected on the basis of the threshold (cut-off sampling). We select enterprises with at least 10 employees, registered on the territory of the Republic of Slovenia and in one of the activities of the Standard Classification of Activities SKD 2008 (i.e. NACE Rev. 2) from sections:
Data were collected through combination of a census and sample survey. All units were divided into strata defined by 2 digit NACE activities and by size classes. Units with at least 250 employees were in class 1, units with employees ranges from 50 - 250 were in class 2 and units with employees ranges from 10 - 49 were in class 3. All units from classes 1 and 2 were selected with certainty (census), units from class 3 were selected by sampling (coordinating sampling). Allocation was proportional, taking into account that in each strata were selected at least min {number of units in strata,8} The table below shows number of units in each stratum in the sample, number of units in each stratum in the sampling frame and sampling rates. Total number of strata is 30*3=90. |
||||||||||||||||||||||||||||||||||||||
| 18.1.3. Target population and sample size | ||||||||||||||||||||||||||||||||||||||
|
||||||||||||||||||||||||||||||||||||||
| 18.1.4. Data source for pre-filled variables | ||||||||||||||||||||||||||||||||||||||
Variables and indicators filled or prefilled from other sources. The part of data for the section ''Basic information on your enterprise'' is taken from administrative sources. Data on turnover and the number of employees are taken from the database of accounts kept by the Agency of the Republic of Slovenia for Public Legal Records and Related Services (AJPES). AJPES collects data on the basis of the Companies Act Data on the share of tertiary educated personnel in the enterprise are taken from the Statistical Register of Employment kept by SURS.
|
||||||||||||||||||||||||||||||||||||||
| 18.1.5. Data source and variables used for derivation and weighting | ||||||||||||||||||||||||||||||||||||||
|
||||||||||||||||||||||||||||||||||||||
| 18.2. Frequency of data collection | ||||||||||||||||||||||||||||||||||||||
According to the Commission Regulation (UE) 995/2012, the innovation statistics shall be provided to Eurostat every two years in each even year t+18. |
||||||||||||||||||||||||||||||||||||||
| 18.3. Data collection | ||||||||||||||||||||||||||||||||||||||
Data are collected every odd year for the previous three-year period. Data are collected with the web questionnaire with the survey “Innovation Activity in Industry and Selected Services” (INOV). The reporting units (enterprises) receive the INOV questionnaire and they complete it according to their available records. Some of the data for the INOV survey are taken over from administrative sources (see section 18. 1.). |
||||||||||||||||||||||||||||||||||||||
| 18.3.1. Survey participation | ||||||||||||||||||||||||||||||||||||||
The survey is mandatory. |
||||||||||||||||||||||||||||||||||||||
| 18.3.2. Survey type | ||||||||||||||||||||||||||||||||||||||
Data were collected through combination of a census and sample survey. |
||||||||||||||||||||||||||||||||||||||
| 18.3.3. Combination of sample survey and census data | ||||||||||||||||||||||||||||||||||||||
Units from sampling frame were divided into strata defined by 2 digit NACE activity and by size classes. Units with at least 250 employees were in class 1, units with employees ranges from 50-249 were in class 2 and units with employees ranges from 10-49 were in class 3. All units from classes 1 and 2 were selected with certainty (census), units from class 3 were selected by sample (coordinating sampling). |
||||||||||||||||||||||||||||||||||||||
| 18.3.4. Census criteria | ||||||||||||||||||||||||||||||||||||||
The observation units are selected on the basis of the threshold (cut-off sampling). We select enterprises with at least 10 persons employed, registered on the territory of the Republic of Slovenia and in one of the Core NACE activities. The coverage of the observed units is a combination of a census (large and medium-sized enterprises) and a sample (small enterprises); this means that the census covers all enterprises in the Core NACE activities employing between 50 and 249 (medium-sized enterprises) and more than 249 persons (large enterprises), and a sample of enterprises employing between 10 and 49 persons (they are selected on the basis of a random sample). |
||||||||||||||||||||||||||||||||||||||
| 18.3.5. Data collection method | ||||||||||||||||||||||||||||||||||||||
Data collection method
|
||||||||||||||||||||||||||||||||||||||
| 18.4. Data validation | ||||||||||||||||||||||||||||||||||||||
Not requested. |
||||||||||||||||||||||||||||||||||||||
| 18.5. Data compilation | ||||||||||||||||||||||||||||||||||||||
Operations performed on data to derive new information according to a given set of rules. |
||||||||||||||||||||||||||||||||||||||
| 18.5.1. Imputation - rate | ||||||||||||||||||||||||||||||||||||||
Imputation is the method of creating plausible (but artificial) substitute values for all those missing. Definition of imputation rate: Imputation rate (for the variable x) (%) = 100*(Number of replaced values) / (Total number of values for a given variable) Definition of weighted imputation rate: Weighted imputation rate= 100*(Number of total weighted replaced values) / (Total number of weighted values for a given variable) |
||||||||||||||||||||||||||||||||||||||
| 18.5.1.1. Imputation rate for metric variables | ||||||||||||||||||||||||||||||||||||||
Imputation rate for metric variables by NACE categories and for enterprises with 10 or more employees:
(1) = Total turnover in the last year of the reference period (t) (TUR) (2) = Share of the turnover in the last year of the reference period (t) due to new or improved product new to the market in the total turnover for product innovative enterprises TUR_PRD_NEW_MKT/TUR(INNO_PRD) (3) = R&D expenditure performed in-house (EXP_INNO_RND_IH) |
||||||||||||||||||||||||||||||||||||||
| 18.5.2. Weights calculation | ||||||||||||||||||||||||||||||||||||||
Weights calculation method for sample surveys
|
||||||||||||||||||||||||||||||||||||||
| 18.6. Adjustment | ||||||||||||||||||||||||||||||||||||||
Not used. |
||||||||||||||||||||||||||||||||||||||
| 18.6.1. Seasonal adjustment | ||||||||||||||||||||||||||||||||||||||
Not requested. |
||||||||||||||||||||||||||||||||||||||
|
|||
|
|||
|
|||