|
 |
| For any question on data and metadata, please contact: Eurostat user support |
|
|||
| 1.1. Contact organisation | Statistical Office in Szczecin Statistics Poland |
||
| 1.2. Contact organisation unit | Centre for Science, Technology, Innovation and Information Society (Statistical Office in Szczecin) |
||
| 1.5. Contact mail address | Aneta Malesza Statistical Office in Szczecin Matejki Str. 22 70-530 Szczecin Poland
Joanna Piotrowska Statistical Office in Szczecin Matejki Str. 22 70-530 Szczecin Poland
Karolina Warno Central Statistical Office Poland |
||
|
|||
| 2.1. Metadata last certified | 30/05/2024 | ||
| 2.2. Metadata last posted | 30/05/2024 | ||
| 2.3. Metadata last update | 30/05/2024 | ||
|
||||||||||||||||||||||||||||||||||||||||||||||||||||
| 3.1. Data description | ||||||||||||||||||||||||||||||||||||||||||||||||||||
The Community Innovation Survey (CIS) is a survey about innovation activities in enterprises. The survey is designed to collect the information on types of innovation, processes of development of innovation like cooperation patterns, financing and expenditure, objectives of innovation activities or barriers for initiating or implementing innovation. The CIS provides statistics by type of innovators, economic activity and size class of enterprises. The survey is currently carried out every two years across the EU Member States, EFTA countries and EU candidate countries.
In order to ensure comparability across countries, Eurostat together with the countries develops a Harmonised Data Collection (HDC) questionnaire and drafts the methodological recommendations for implementation of each survey round.
CIS 2020 is a second in a row to implement concepts and methodology of the Oslo Manual 4th Edition revised in 2018. The changes in the CIS driven by the revision of the manual and their impact on collected indicators are described in the Statistics Explained article: Community Innovation Survey – new features.
The legal framework for CIS since 2012 is the Commission Regulation No 995/2012 that establishes the quality conditions for the data collection and transmission and identifies the obligatory cross-coverage of economic sectors, size class of enterprises and innovation indicators. The target population are enterprises with at least 10 employees classified in the core NACE economic sectors (see 3.3). Further activities may be covered on a voluntary basis in national datasets. Most statistics are based on the 3-year reference period (t, t-1, t-2), but some use only one calendar year (t or t-2). Please refer to the Annex section of the European metadata (ESMS) for details of the time coverage of collected indicators. |
||||||||||||||||||||||||||||||||||||||||||||||||||||
| 3.2. Classification system | ||||||||||||||||||||||||||||||||||||||||||||||||||||
Indicators related to the enterprises are classified by country, economic activity (NACE Rev. 2), size class of enterprises and type of innovation.
The main typology of classification of enterprises in reference to innovation is the distinction between innovation-active enterprises (INN) and not innovation-active enterprises (NINN). The enterprise is considered as innovative (INN) if during the reference period it successfully introduced a a) product or a) business process innovation, c) completed but not yet implemented the innovation, d) had ongoing innovation activities, e) abandoned innovation activities or was f) engaged in in-house R&D or R&D contracted out. Non-innovative (NINN) enterprises had no innovation activity mentioned above whatsoever during the reference period. |
||||||||||||||||||||||||||||||||||||||||||||||||||||
| 3.3. Coverage - sector | ||||||||||||||||||||||||||||||||||||||||||||||||||||
CIS covers main economic sectors according to NACE Rev.2 broken down by size class of enterprises and type of innovation activity. |
||||||||||||||||||||||||||||||||||||||||||||||||||||
| 3.3.1. Main economic sectors covered - NACE Rev.2 | ||||||||||||||||||||||||||||||||||||||||||||||||||||
In accordance with Commission Regulation 995/2012 on innovation statistics, the following industries and services are included in the core target population. Results are made available with these following breakdowns : All NACE – Core NACE (NACE Rev. 2 sections & divisions B-C-D-E-46-H-J-K-71-72-73 )
CORE INDUSTRY (excluding construction) (NACE Rev. 2 SECTIONS B_C_D_E) 10-12: Manufacture of food products, beverages and tobacco 13-15: Manufacture of textiles, wearing apparel, leather and related products 16-18: Manufacture of wood, paper, printing and reproduction 20: Manufacture of chemicals and chemical products 21: Manufacture of basic pharmaceutical products and pharmaceutical preparations 19-22: Manufacture of petroleum, chemical, pharmaceutical, rubber and plastic products 23: Manufacture of other non-metallic mineral products 24: Manufacture of basic metals 25: Manufacture of fabricated metal products, except machinery and equipment 26: Manufacture of computer, electronic and optical products 25-30: Manufacture of fabricated metal products (except machinery and equipment), computer, electronic and optical products, electrical equipment, motor vehicles and other transport equipment 31-33: Manufacture of furniture; jewellery, musical instruments, toys; repair and installation of machinery and equipment
D: ELECTRICITY, GAS, STEAM AND AIR CONDITIONING SUPPLY
E: WATER SUPPLY; SEWERAGE, WASTE MANAGEMENT AND REMEDIATION ACTIVITIES 36: Water collection, treatment and supply 37-39: Sewerage, waste management, remediation activities
CORE SERVICES (NACE Rev. 2 sections & divisions 46-H-J-K-71-72-73)(NACE code in the tables = G46-M73_INN) 46: Wholesale trade, except of motor vehicles and motorcycles
H: TRANSPORTATION AND STORAGE 49-51: Land transport and transport via pipelines, water transport and air transport 52-53: Warehousing and support activities for transportation and postal and courier activities
J: INFORMATION AND COMMUNICATION 58: Publishing activities 61: Telecommunications 62: Computer programming, consultancy and related activities 63: Information service activities
K: FINANCIAL AND INSURANCE ACTIVITIES 64: Financial service activities, except insurance and pension funding 65: Insurance, reinsurance and pension funding, except compulsory social security 66: Activities auxiliary to financial services and insurance activities
M: PROFESSIONAL, SCIENTIFIC AND TECHNICAL ACTIVITIES 71: Architectural and engineering activities; technical testing and analysis 72: Scientific research and development 73: Advertising and market research 71-73: Architectural and engineering activities; technical testing and analysis; Scientific research and development; Advertising and market research |
||||||||||||||||||||||||||||||||||||||||||||||||||||
| 3.3.1.1. Main economic sectors covered - NACE Rev.2 - national particularities | ||||||||||||||||||||||||||||||||||||||||||||||||||||
No deviations |
||||||||||||||||||||||||||||||||||||||||||||||||||||
| 3.3.2. Sector coverage - size class | ||||||||||||||||||||||||||||||||||||||||||||||||||||
In accordance with Commission Regulation 995/2012 on innovation statistics, the following size classes of enterprises according to number of employees are included in the core target population of the CIS:
|
||||||||||||||||||||||||||||||||||||||||||||||||||||
| 3.3.2.1. Sector coverage - size class - national particularities | ||||||||||||||||||||||||||||||||||||||||||||||||||||
Persons employed instead of employees |
||||||||||||||||||||||||||||||||||||||||||||||||||||
| 3.4. Statistical concepts and definitions | ||||||||||||||||||||||||||||||||||||||||||||||||||||
The description of concepts, definitions and main statistical variables is available in CIS 2020 European metadata file (ESMS) Results of the community innovation survey 2020 (CIS2020) (inn_cis12) in Eurostat database. |
||||||||||||||||||||||||||||||||||||||||||||||||||||
| 3.5. Statistical unit | ||||||||||||||||||||||||||||||||||||||||||||||||||||
Legal unit (as well as in the previous CIS waves for Poland) |
||||||||||||||||||||||||||||||||||||||||||||||||||||
| 3.6. Statistical population | ||||||||||||||||||||||||||||||||||||||||||||||||||||
Core target population are all enterprises in CORE NACE activities (see 3.3.1) with 10 or more employees. |
||||||||||||||||||||||||||||||||||||||||||||||||||||
| 3.7. Reference area | ||||||||||||||||||||||||||||||||||||||||||||||||||||
The national CIS data is published in Poland for NUTS2 regions, however the breakdown is not the same as for the CIS data for Poland send to Eurostat. |
||||||||||||||||||||||||||||||||||||||||||||||||||||
| 3.8. Coverage - Time | ||||||||||||||||||||||||||||||||||||||||||||||||||||
Several rounds of Community Innovation Survey have been conducted so far at two-year interval since end of 90’s. |
||||||||||||||||||||||||||||||||||||||||||||||||||||
| 3.8.1. Participation in the CIS waves | ||||||||||||||||||||||||||||||||||||||||||||||||||||
*two reference periods can be distinguished for CIS light: 2000-2002 and 2001-2003 |
||||||||||||||||||||||||||||||||||||||||||||||||||||
| 3.9. Base period | ||||||||||||||||||||||||||||||||||||||||||||||||||||
Not relevant. |
||||||||||||||||||||||||||||||||||||||||||||||||||||
|
|||
CIS indicators are available according to 3 units of measure:
NR: Number for number of enterprises and number of persons employed. THS_EUR: Thousands of euros. All financial variables are provided in thousands of euros, i.e. Turnover or Innovation expenditure. PC: Percentage. The percentage is the ratio between the selected combinations of indicators. |
|||
|
|||
For CIS 2020, the time covered by the survey is the 3-year period from the beginning of 2018 to the end of 2020. Some questions and indicators refer to one year — 2020. The list of indicators covering the 3-year period and referring to one year according to the HDC is available in the Annex section of the European metadata (ESMS). |
|||
|
|||
| 6.1. Institutional Mandate - legal acts and other agreements | |||
CIS surveys are based on the Commission Regulation No 995/2012, implementing Decision No 1608/2003/EC of the European Parliament and of the Council on the production and development of Community statistics on science and technology. This Regulation establishes innovation statistics on a statutory basis and makes the delivery of certain variables compulsory e.g. innovation activities, cooperation, development, expenditures and turnover (see the Regulation). Each survey wave may additionally include further variables. In addition, the Regulation defines the obligatory cross-coverage of economic sectors and size class of enterprises. |
|||
| 6.1.1. National legislation | |||
Programme of Statistical Surveys of Public Statistics for the year 2020, established by the Regulation of the Council of Ministers of October 11th, 2019 as amended (consolidated text published under JL 2021 item 698). |
|||
| 6.2. Institutional Mandate - data sharing | |||
Not requested. |
|||
|
|||
CIS data are transmitted to Eurostat via EDAMIS using the secured transmission system. |
|||
| 7.1. Confidentiality - policy | |||
The issue of statistical confidentiality in Poland is settled by the art. 10 and art. 38 of the Law on official statistics of June 29th 1995 (latest version: JL 2022, item 459) as amended. |
|||
| 7.2. Confidentiality - data treatment | |||
National confidentiality rules: if the aggregate consist of less than 3 records or one record consist over 75% of the whole aggregate, data is deemed confidential |
|||
|
|||
| 8.1. Release calendar | |||
There is a calendar of main publications of the innovation data. Publicly accessible are:
|
|||
| 8.2. Release calendar access | |||
|
|||
| 8.3. Release policy - user access | |||
The general rule for release the statistical data is that we are publishing the short information with the main indicators on the Statistics Poland website. (available in Polish only: https://stat.gov.pl/obszary-tematyczne/nauka-i-technika-spoleczenstwo-informacyjne/nauka-i-technika/dzialalnosc-innowacyjna-przedsiebiorstw-w-polsce-w-latach-2018-2020,14,8.html). Then the more detailed publications are prepared and published - also on the Statistics Poland website as well as in the traditional, paper form (paper form is for fee): https://stat.gov.pl/en/topics/science-and-technology/science-and-technology/innovation-activities-of-enterprises-in-the-years-2018-2020,3,6.html https://stat.gov.pl/en/topics/science-and-technology/science-and-technology/science-and-technology-in-2020,1,16.html Databases: https://bdl.stat.gov.pl/BDL/start https://strateg.stat.gov.pl/#/ http://swaid.stat.gov.pl/EN/SitePagesDBW/NaukaTechnika.aspx
All these releases are public, available for all users. Only publications in paper form are for fee, the electronic forms of publication are free. The information about the publication is published on Statistics Poland and Statistical Office in Szczecin websites and social media accounts. |
|||
|
|||
CIS is conducted and disseminated at two-year interval in pair years. In Poland innovation survey is annual, after CIS2022 we plan to change it and perform biannually only in CIS years. |
|||
|
|||||||||||||||
Accessibility and clarity refer to the simplicity and ease for users to access statistics using simple and user-friendly procedure, obtaining them in an expected form and within an acceptable time period, with the appropriate user information and assistance: a global context which finally enables them to make optimum use of the statistics. |
|||||||||||||||
| 10.1. Dissemination format - News release | |||||||||||||||
See below. |
|||||||||||||||
| 10.1.1. Availability of the releases | |||||||||||||||
|
|||||||||||||||
| 10.2. Dissemination format - Publications | |||||||||||||||
- Online database (containing all/most results) : Local Data Bank https://bdl.stat.gov.pl/BDL/start - Analytical publication (referring to all/most results) : https://stat.gov.pl/en/topics/science-and-technology/science-and-technology/innovation-activities-of-enterprises-in-the-years-2018-2020,3,6.html - Analytical publication (referring to specific results, e.g. only for one sector or one specific aspect) : publications where innovation activity is only one of more themes of science and technology domain: https://stat.gov.pl/en/topics/science-and-technology/science-and-technology/science-and-technology-in-2020,1,16.html , https://szczecin.stat.gov.pl/publikacje-i-foldery/nauka-technika/gospodarka-oparta-na-wiedzy-w-wojewodztwie-zachodniopomorskim-w-2021-r-,2,13.html |
|||||||||||||||
| 10.3. Dissemination format - online database | |||||||||||||||
https://bdl.stat.gov.pl/BDL/start |
|||||||||||||||
| 10.3.1. Data tables - consultations | |||||||||||||||
Not requested. |
|||||||||||||||
| 10.4. Dissemination format - microdata access | |||||||||||||||
No |
|||||||||||||||
| 10.4.1. Dissemination of microdata | |||||||||||||||
|
|||||||||||||||
| 10.5. Dissemination format - other | |||||||||||||||
None |
|||||||||||||||
| 10.5.1. Metadata - consultations | |||||||||||||||
Not requested. |
|||||||||||||||
| 10.6. Documentation on methodology | |||||||||||||||
The most detailed meta-information is included in the main publication (in Polish language: https://stat.gov.pl/en/topics/science-and-technology/science-and-technology/innovation-activities-of-enterprises-in-the-years-2018-2020,3,6.html). It consists: Definitions of terms used, scope of surveyed population according to Nace Rev.2 (in Poland - PKD2007) - current and historical, brief presentation of used classifications. The main definitions are also included in the Glossary of terms, being a part of Metainformation published on the Statistics Poland website (in Polish and English: https://stat.gov.pl/en/metainformation/glossary/ ) |
|||||||||||||||
| 10.6.1. Metadata completeness - rate | |||||||||||||||
Not requested. |
|||||||||||||||
| 10.7. Quality management - documentation | |||||||||||||||
Quality reports performed in Poland are publicly accessible only partly. The quality reports for innovation surveys managing CIS 2020 are not published yet. There's no dedicated quality study for innovation statistics in Poland. We use general documents, as well as good practices. They're also internal documents, but based inter alia on international guidelines. Publicly accessible is the Compendium of Knowledge from Quality in Statistics (available only in Polish): https://bip.stat.gov.pl/dzialalnosc-statystyki-publicznej/jakosc-w-statystyce/ocena-i-monitorowanie-jakosci-procesow-statystycznych/ |
|||||||||||||||
|
|||
| 11.1. Quality assurance | |||
Methodological concepts and definitions are based on Oslo Manual and Methodological recommendations. Quality management is based on documents and guidelines mentioned in point 10.7. Main strengths of Polish CIS:
Main weaknesses of Polish CIS: not indicated. |
|||
| 11.2. Quality management - assessment | |||
In every CIS wave we introduce new and improved validations, guideliness for enterprises, tools for statisticians etc. on the basis of previous experiences to improve the quality of the data. |
|||
|
|||||||||||||||||||||
Relevance is the degree to which statistics meet current and potential users’ needs. It includes the production of all needed statistics and the extent to which concepts used (definitions, classifications etc.) reflect user needs. The aim is to describe the extent to which the statistics are useful to, and used by, the broadest array of users. For this purpose, statisticians need to compile information, firstly about their users and their needs. The CIS is based on a common questionnaire and a common survey methodology in order to achieve comparable, harmonised and high quality results for EU Member States, EFTA countries, Candidates and Associated countries. |
|||||||||||||||||||||
| 12.1. Relevance - User Needs | |||||||||||||||||||||
The CIS2020 Polish questionnaires contains additional questions in the response to reported needs: the sale of goods (total and also new or improved), cluster cooperation, number of IPR applications and received protection rights and impact of COVID-19 situation on the enteprises' activities. The subject scope of survey on innovation in Poland is included in the Programme of Statistical Surveys of Public Statistics, which is a legal act implemented in the form of a regulation of the Council of Ministers. Like every legal act in Poland, the draft of this regulation is subject to interdepartmental agreements, opinions and public consultations. Some additional questions in Polish CIS questionnaire are therefore the result of comments and suggestions submitted as part of the consultation. Some institutions also submit their proposals on other occasions, e.g. meetings on a broader subject than CIS (e.g. questions on IPR agreed with the Polish Patent Office) or as a current demand (e.g. questions on COVID-19 situation impact). |
|||||||||||||||||||||
| 12.1.1. Needs at national level | |||||||||||||||||||||
|
|||||||||||||||||||||
| 12.2. Relevance - User Satisfaction | |||||||||||||||||||||
No user satisfaction survey has been undertaken |
|||||||||||||||||||||
| 12.3. Completeness | |||||||||||||||||||||
All mandatory sectors and indicators required by Regulation 995/2012 are covered in Polish CIS. Missingness in data is only due to Polish coverage of the survey - in Poland only core CIS coverage is surveyed. |
|||||||||||||||||||||
| 12.3.1. Data completeness - rate | |||||||||||||||||||||
Not requested. |
|||||||||||||||||||||
|
||||||||||||||||||||
| 13.1. Accuracy - overall | ||||||||||||||||||||
Accuracy in the statistical sense denotes the closeness of computations or estimates to the exact or true values. Statistics are not equal with the true values because of variability (the statistics change from implementation to implementation of the survey due to random effects) and bias (the average of the possible values of the statistics from implementation to implementation is not equal to the true value due to systematic effects). |
||||||||||||||||||||
| 13.2. Sampling error | ||||||||||||||||||||
That part of the difference between a population value and an estimate thereof, derived from a random sample, which is due to the fact that only a subset of the population is enumerated. |
||||||||||||||||||||
| 13.2.1. Sampling error - indicators | ||||||||||||||||||||
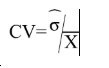
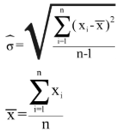
The main indicator used to measure sampling errors for CIS data is the coefficient of variation (CV).
Coefficient of Variation= (Square root of the estimate of the sampling variance) / (Estimated value) Formula: where
|
||||||||||||||||||||
| 13.2.1.1. Coefficient of variations for key variables | ||||||||||||||||||||
Coefficient of variation (%) for key variables by NACE categories and for enterprises with 10 and more employees
[1] = Coefficient of variation for the percentage of innovative enterprises (INN) in the total population of enterprises (ENT20) |
||||||||||||||||||||
| 13.2.1.2. Variance estimation method | ||||||||||||||||||||
Estimation of variance was based on linearization method for ratio of two variables and classical formulas used for variance of totals in stratified random sampling; practical computations were done in SAS using SURVEYMEANS procedure. |
||||||||||||||||||||
| 13.3. Non-sampling error | ||||||||||||||||||||
Non-sampling errors occur in all phases of a survey. They add to the sampling errors (if present) and contribute to decreasing overall accuracy. It is important to assess their relative weight in the total error and devote appropriate resources for their control and assessment. |
||||||||||||||||||||
| 13.3.1. Coverage error | ||||||||||||||||||||
Coverage errors (or frame errors) are due to divergences between the target population and the frame population. The frame population is the set of target population members that has a chance to be selected into the survey sample. It is a listing of all items in the population from which the sample is drawn that contains contact details as well as sufficient information to perform stratification and sampling. |
||||||||||||||||||||
| 13.3.1.1. Over-coverage - rate | ||||||||||||||||||||
Not requested. |
||||||||||||||||||||
| 13.3.1.2. Common units - proportion | ||||||||||||||||||||
Not requested. |
||||||||||||||||||||
| 13.3.1.3. Under covered groups of the target population | ||||||||||||||||||||
Over-coverage was not observed. We try to eliminate under coverage at the sampling stage - breakdowns with small number of enterprises are selected for the sample as a whole. |
||||||||||||||||||||
| 13.3.1.4. Coverage errors in coefficient variation | ||||||||||||||||||||
Coverage errors were not considered in calculation of the CVs |
||||||||||||||||||||
| 13.3.2. Measurement error | ||||||||||||||||||||
Measurement errors occur during data collection and generate bias by recording values different than the true ones. The survey questionnaire used for data collection may have led to the recording of wrong values, or there may be respondent or interviewer bias. |
||||||||||||||||||||
| 13.3.2.1. Measures for reducing measurement errors | ||||||||||||||||||||
On-line questionnaire with built-in validations and filters reduce bias. Questionnaire is tested by statistitians before the beginning if the data collection. We have exhaustive explanatory notes attached to the questionnaire. Before every survey we perform training for statistitians. |
||||||||||||||||||||
| 13.3.3. Non response error | ||||||||||||||||||||
Non response occurs when a survey fails to collect data on all survey variables from all the population units designated for data collection in a sample or complete enumeration. There are two types of non-response: 1) Unit non-response, which occurs when no data (or so little as to be unusable) are collected about a population unit designated for data collection. a) Un-weighted unit non-response rate (%) = 100*(Number of units with no response or not usable response) / (Total number of in-scope (eligible) units in the sample) b) Weighted unit non-response rate (%) = 100*(Number of weighted units with no response or not usable response) / (Total number of in-scope (eligible) units in the sample) 2) Item non-response, which occurs when only data on some, but not all survey data items are collected about a population unit designated for data collection. a) Un-weighted item non-response rate (%) = 100*(Number of units with no response at all for the item) / (Total number of eligible, for the item, units in the sample i.e. filters have to be taken into account)
In Polish CIS survey occured unit non-responses as well as item non-responses. |
||||||||||||||||||||
| 13.3.3.1. Unit non-response - rate | ||||||||||||||||||||
See below. |
||||||||||||||||||||
| 13.3.3.1.1. Un-weighted and weighted unit non-response rate by NACE categories and for enterprises with 10 or more employees | ||||||||||||||||||||
Un-weighted and weighted unit non-response rate by NACE categories and for enterprises with 10 or more persons employed
The number of eligible units is the number of sample units, which indeed belong to the target population. |
||||||||||||||||||||
| 13.3.3.1.2. Maximum number of recalls/reminders before coding | ||||||||||||||||||||
One e-mail reminder before the date of receipt, then after this date: 5 e-mail reminders for all non- responders and additionally urging notes, e-mails and phone calls for still non- responders. |
||||||||||||||||||||
| 13.3.3.2. Item non-response - rate | ||||||||||||||||||||
See below. |
||||||||||||||||||||
| 13.3.3.2.1. Item non-response rate for Turnover (in Core NACE: B-C-D-E-46-H-J-K-71-72-73 enterprises with 10 or more employees) | ||||||||||||||||||||
Item non-response rate for Turnover (in Core NACE: B-C-D-E-46-H-J-K-71-72-73 enterprises with 10 or more persons emloyed).
|
||||||||||||||||||||
| 13.3.3.2.2. Item non response rate for new questions | ||||||||||||||||||||
Item non-response rate for new questions in CIS t (in Core NACE: B-C-D-E-46-H-J-K-71-72-73 enterprises with 10 or more employees)
|
||||||||||||||||||||
| 13.3.4. Processing error | ||||||||||||||||||||
Insignificant. Most responses are received through online questionnaires. Manual data entry is used only in specific situations (when enterprise cannot fill the on-line questionnaire and sends paper one). |
||||||||||||||||||||
| 13.3.5. Model assumption error | ||||||||||||||||||||
Not requested. |
||||||||||||||||||||
|
|||
Timeliness and punctuality refer to time and dates, but in a different manner. |
|||
| 14.1. Timeliness | |||
The timeliness of statistics reflects the length of time between data availability and the event or phenomenon they describe. |
|||
| 14.1.1. Time lag - first result | |||
The date of release of national CIS2020 data is November 29th 2021. |
|||
| 14.1.2. Time lag - final result | |||
Not requested. |
|||
| 14.2. Punctuality | |||
Punctuality refers to the time lag between the release date of data and the target date on which they were scheduled for release as announced officially. |
|||
| 14.2.1. Punctuality - delivery and publication | |||
Date of transmission of complete and validated data to Eurostat (Number of days between that data and 30 June 2022) : 30 th June 2022 (0) |
|||
|
||||||||||||||||||||||
Comparability aims at measuring the impact of differences in applied statistical concepts and definitions on the comparison of statistics between geographical areas, non-geographical domains, or over time. The coherence of statistical outputs refers to the degree to which the statistical processes by which they were generated used the same concepts (classifications, definitions, and target populations) and harmonised methods. Coherent statistical outputs have the potential to be validly combined and used jointly. |
||||||||||||||||||||||
| 15.1. Comparability - geographical | ||||||||||||||||||||||
No problem at national nad NUTS 2 level. |
||||||||||||||||||||||
| 15.1.1. Asymmetry for mirror flow statistics - coefficient | ||||||||||||||||||||||
Not requested. |
||||||||||||||||||||||
| 15.1.2. National questionnaire – compliance with Eurostat model questionnaire | ||||||||||||||||||||||
Methodological deviations from the CIS Harmonised Data Collection (HDC)
|
||||||||||||||||||||||
| 15.1.3. National questionnaire – additional questions | ||||||||||||||||||||||
Methodological deviations from the CIS Harmonised Data Collection (HDC)
|
||||||||||||||||||||||
| 15.2. Comparability - over time | ||||||||||||||||||||||
Due to important methodological changes driven by Oslo Manual 2018, CIS 2018 and CIS 2020 cannot be directly compared with previous CIS waves. |
||||||||||||||||||||||
| 15.2.1. Length of comparable time series | ||||||||||||||||||||||
Not requested. |
||||||||||||||||||||||
| 15.3. Coherence - cross domain | ||||||||||||||||||||||
See the comparison between SBS and CIS data in the section 15.3.3 below. |
||||||||||||||||||||||
| 15.3.1. Coherence - sub annual and annual statistics | ||||||||||||||||||||||
Not requested. |
||||||||||||||||||||||
| 15.3.2. Coherence - National Accounts | ||||||||||||||||||||||
Not requested. |
||||||||||||||||||||||
| 15.3.3. Coherence – Structural Business Statistics (SBS) | ||||||||||||||||||||||
This part compares key variables for aggregated CIS data with SBS data IMPORTANT: Total Core NACE and Core services unable to compare in order to significant difference between SBS and CIS in surveing section K, data unweighted
* Numbers are to be provided for the last year of the reference period (t) |
||||||||||||||||||||||
| 15.4. Coherence - internal | ||||||||||||||||||||||
Not requested. |
||||||||||||||||||||||
|
|||
Confidential information on the production cost of the CIS. |
|||
|
|||
| 17.1. Data revision - policy | |||
Not requested. |
|||
| 17.2. Data revision - practice | |||
Not requested. |
|||
| 17.2.1. Data revision - average size | |||
Not requested. |
|||
|
||||||||||||||||||||||||||||||||||||||
| 18.1. Source data | ||||||||||||||||||||||||||||||||||||||
In Poland CIS2020 was performed as two surveys - PNT-02 - Innovation survey in industry and PNT-02/u - Innovation survey in service sector. The source database for compliling CIS2020 aggregates is prepared by combining the eligibile records from both surveys. |
||||||||||||||||||||||||||||||||||||||
| 18.1.1. Sampling frame (or census frame) | ||||||||||||||||||||||||||||||||||||||
The official, up-to-date, statistical business register of the country was used. |
||||||||||||||||||||||||||||||||||||||
| 18.1.2. Sampling design | ||||||||||||||||||||||||||||||||||||||
The samples were drawn separately for industry and service sector by the method of simple random sampling independently in every stratum. Strata were defined as intersections of NACE divisions, geographical regions (NUTS2 level voivodships) and enterprise sizes (10-49 persons employed, 50-249,250+). The samples were allocated into strata using historical data from previous surveys and numerical optimisation methods. Samples were allocated in such a way to meet the precision criteria from Eurostat's methodological recommendations. |
||||||||||||||||||||||||||||||||||||||
| 18.1.3. Target population and sample size | ||||||||||||||||||||||||||||||||||||||
|
||||||||||||||||||||||||||||||||||||||
| 18.1.4. Data source for pre-filled variables | ||||||||||||||||||||||||||||||||||||||
Variables and indicators filled or prefilled from other sources.
|
||||||||||||||||||||||||||||||||||||||
| 18.1.5. Data source and variables used for derivation and weighting | ||||||||||||||||||||||||||||||||||||||
|
||||||||||||||||||||||||||||||||||||||
| 18.2. Frequency of data collection | ||||||||||||||||||||||||||||||||||||||
According to the Commission Regulation (UE) 995/2012, the innovation statistics shall be provided to Eurostat every two years in each even year t+18. Data for Poland provided with no deviations. Generally in Poland innovation survey is performed annually. It will change after CIS2022 - it will be biannual, performed in CIS years. |
||||||||||||||||||||||||||||||||||||||
| 18.3. Data collection | ||||||||||||||||||||||||||||||||||||||
In Poland CIS2020 was performed as two surveys - PNT-02 - Innovation survey in industry and PNT-02/u - Innovation survey in service sector. |
||||||||||||||||||||||||||||||||||||||
| 18.3.1. Survey participation | ||||||||||||||||||||||||||||||||||||||
The survey was mandatory |
||||||||||||||||||||||||||||||||||||||
| 18.3.2. Survey type | ||||||||||||||||||||||||||||||||||||||
The survey was realised as a combination of sample survey and census. |
||||||||||||||||||||||||||||||||||||||
| 18.3.3. Combination of sample survey and census data | ||||||||||||||||||||||||||||||||||||||
The census was applied for the subpopulation of industrial enterprises (NACE sections B, C, D and E) with more than 49 persons employed and sample survey was used for industrial enterprises with 10-49 persons employed and for the service sector. |
||||||||||||||||||||||||||||||||||||||
| 18.3.4. Census criteria | ||||||||||||||||||||||||||||||||||||||
- NACE (industry) - size class (50 and more persons employed) |
||||||||||||||||||||||||||||||||||||||
| 18.3.5. Data collection method | ||||||||||||||||||||||||||||||||||||||
Data collection method
|
||||||||||||||||||||||||||||||||||||||
| 18.4. Data validation | ||||||||||||||||||||||||||||||||||||||
Not requested. |
||||||||||||||||||||||||||||||||||||||
| 18.5. Data compilation | ||||||||||||||||||||||||||||||||||||||
Operations performed on data to derive new information according to a given set of rules. |
||||||||||||||||||||||||||||||||||||||
| 18.5.1. Imputation - rate | ||||||||||||||||||||||||||||||||||||||
Imputation is the method of creating plausible (but artificial) substitute values for all those missing. Definition of imputation rate: Imputation rate (for the variable x) (%) = 100*(Number of replaced values) / (Total number of values for a given variable) Definition of weighted imputation rate: Weighted imputation rate= 100*(Number of total weighted replaced values) / (Total number of weighted values for a given variable) |
||||||||||||||||||||||||||||||||||||||
| 18.5.1.1. Imputation rate for metric variables | ||||||||||||||||||||||||||||||||||||||
Imputation rate for metric variables by NACE categories and for enterprises with 10 or more persons employed:
(1) = Total turnover in the last year of the reference period (t) (TUR) (2) = Share of the turnover in the last year of the reference period (t) due to new or improved product new to the market in the total turnover for product innovative enterprises TUR_PRD_NEW_MKT/TUR(INNO_PRD) (3) = R&D expenditure performed in-house (EXP_INNO_RND_IH) |
||||||||||||||||||||||||||||||||||||||
| 18.5.2. Weights calculation | ||||||||||||||||||||||||||||||||||||||
Weights calculation method for sample surveys
|
||||||||||||||||||||||||||||||||||||||
| 18.6. Adjustment | ||||||||||||||||||||||||||||||||||||||
The calibration was not used. |
||||||||||||||||||||||||||||||||||||||
| 18.6.1. Seasonal adjustment | ||||||||||||||||||||||||||||||||||||||
Not requested. |
||||||||||||||||||||||||||||||||||||||
|
|||
|
|||
|
|||
| CIS 2020 Polish questionnaire for industrial enterprises CIS 2020 Polish questionnaire for service enterprises |
|||