|
 |
| For any question on data and metadata, please contact: Eurostat user support |
|
|||
| 1.1. Contact organisation | Central Statistical Bureau of Latvia |
||
| 1.2. Contact organisation unit | Business Statistics Department Enterprise Structural and Financial Statistics Section |
||
| 1.5. Contact mail address | Central Statistical Bureau of Latvia Lāčplēša street 1, Rīga, LV 1301 Latvia |
||
|
|||
| 2.1. Metadata last certified | 30/05/2024 | ||
| 2.2. Metadata last posted | 30/05/2024 | ||
| 2.3. Metadata last update | 30/05/2024 | ||
|
||||||||||||||||||||||||||||||||||||||||||||||||||||
| 3.1. Data description | ||||||||||||||||||||||||||||||||||||||||||||||||||||
The Community Innovation Survey (CIS) is a survey about innovation activities in enterprises. The survey is designed to collect the information on types of innovation, processes of development of innovation like cooperation patterns, financing and expenditure, objectives of innovation activities or barriers for initiating or implementing innovation. The CIS provides statistics by type of innovators, economic activity and size class of enterprises. The survey is currently carried out every two years across the EU Member States, EFTA countries and EU candidate countries.
In order to ensure comparability across countries, Eurostat together with the countries develops a Harmonised Data Collection (HDC) questionnaire and drafts the methodological recommendations for implementation of each survey round.
CIS 2020 is a second in a row to implement concepts and methodology of the Oslo Manual 4th Edition revised in 2018. The changes in the CIS driven by the revision of the manual and their impact on collected indicators are described in the Statistics Explained article: Community Innovation Survey – new features. The legal framework for CIS since 2012 is the Commission Regulation No 995/2012 that establishes the quality conditions for the data collection and transmission and identifies the obligatory cross-coverage of economic sectors, size class of enterprises and innovation indicators. The target population are enterprises with at least 10 employees classified in the core NACE economic sectors (see 3.3). Further activities may be covered on a voluntary basis in national datasets. Most statistics are based on the 3-year reference period (t, t-1, t-2), but some use only one calendar year (t or t-2). Please refer to the Annex section of the European metadata (ESMS) for details of the time coverage of collected indicators. |
||||||||||||||||||||||||||||||||||||||||||||||||||||
| 3.2. Classification system | ||||||||||||||||||||||||||||||||||||||||||||||||||||
Indicators related to the enterprises are classified by country, economic activity (NACE Rev. 2), size class of enterprises and type of innovation.
The main typology of classification of enterprises in reference to innovation is the distinction between innovation-active enterprises (INN) and not innovation-active enterprises (NINN). The enterprise is considered as innovative (INN) if during the reference period it successfully introduced a a) product or a) business process innovation, c) completed but not yet implemented the innovation, d) had ongoing innovation activities, e) abandoned innovation activities or was f) engaged in in-house R&D or R&D contracted out. Non-innovative (NINN) enterprises had no innovation activity mentioned above whatsoever during the reference period. |
||||||||||||||||||||||||||||||||||||||||||||||||||||
| 3.3. Coverage - sector | ||||||||||||||||||||||||||||||||||||||||||||||||||||
CIS covers main economic sectors according to NACE Rev.2 broken down by size class of enterprises and type of innovation activity. |
||||||||||||||||||||||||||||||||||||||||||||||||||||
| 3.3.1. Main economic sectors covered - NACE Rev.2 | ||||||||||||||||||||||||||||||||||||||||||||||||||||
In accordance with Commission Regulation 995/2012 on innovation statistics, the following industries and services are included in the core target population. Results are made available with these following breakdowns : All NACE – Core NACE (NACE Rev. 2 sections & divisions B-C-D-E-46-H-J-K-71-72-73 )
CORE INDUSTRY (excluding construction) (NACE Rev. 2 SECTIONS B_C_D_E) 10-12: Manufacture of food products, beverages and tobacco 13-15: Manufacture of textiles, wearing apparel, leather and related products 16-18: Manufacture of wood, paper, printing and reproduction 20: Manufacture of chemicals and chemical products 21: Manufacture of basic pharmaceutical products and pharmaceutical preparations 19-22: Manufacture of petroleum, chemical, pharmaceutical, rubber and plastic products 23: Manufacture of other non-metallic mineral products 24: Manufacture of basic metals 25: Manufacture of fabricated metal products, except machinery and equipment 26: Manufacture of computer, electronic and optical products 25-30: Manufacture of fabricated metal products (except machinery and equipment), computer, electronic and optical products, electrical equipment, motor vehicles and other transport equipment 31-33: Manufacture of furniture; jewellery, musical instruments, toys; repair and installation of machinery and equipment
D: ELECTRICITY, GAS, STEAM AND AIR CONDITIONING SUPPLY
E: WATER SUPPLY; SEWERAGE, WASTE MANAGEMENT AND REMEDIATION ACTIVITIES 36: Water collection, treatment and supply 37-39: Sewerage, waste management, remediation activities
CORE SERVICES (NACE Rev. 2 sections & divisions 46-H-J-K-71-72-73)(NACE code in the tables = G46-M73_INN) 46: Wholesale trade, except of motor vehicles and motorcycles
H: TRANSPORTATION AND STORAGE 49-51: Land transport and transport via pipelines, water transport and air transport 52-53: Warehousing and support activities for transportation and postal and courier activities
J: INFORMATION AND COMMUNICATION 58: Publishing activities 61: Telecommunications 62: Computer programming, consultancy and related activities 63: Information service activities
K: FINANCIAL AND INSURANCE ACTIVITIES 64: Financial service activities, except insurance and pension funding 65: Insurance, reinsurance and pension funding, except compulsory social security 66: Activities auxiliary to financial services and insurance activities
M: PROFESSIONAL, SCIENTIFIC AND TECHNICAL ACTIVITIES 71: Architectural and engineering activities; technical testing and analysis 72: Scientific research and development 73: Advertising and market research 71-73: Architectural and engineering activities; technical testing and analysis; Scientific research and development; Advertising and market research
|
||||||||||||||||||||||||||||||||||||||||||||||||||||
| 3.3.1.1. Main economic sectors covered - NACE Rev.2 - national particularities | ||||||||||||||||||||||||||||||||||||||||||||||||||||
No deviations. Market activity enterprises in the NACE Rev. 2 sections B, C, D, E, H, J, K and in the NACE Rev. 2 divisions 46 and divisions 71, 72 and 73 are covered as stated in the Commission Implementing Regulation (EU) No 995/2012. |
||||||||||||||||||||||||||||||||||||||||||||||||||||
| 3.3.2. Sector coverage - size class | ||||||||||||||||||||||||||||||||||||||||||||||||||||
In accordance with Commission Regulation 995/2012 on innovation statistics, the following size classes of enterprises according to number of employees are included in the core target population of the CIS:
|
||||||||||||||||||||||||||||||||||||||||||||||||||||
| 3.3.2.1. Sector coverage - size class - national particularities | ||||||||||||||||||||||||||||||||||||||||||||||||||||
No deviations. |
||||||||||||||||||||||||||||||||||||||||||||||||||||
| 3.4. Statistical concepts and definitions | ||||||||||||||||||||||||||||||||||||||||||||||||||||
The description of concepts, definitions and main statistical variables is available in CIS 2020 European metadata file (ESMS) Results of the community innovation survey 2020 (CIS2020) (inn_cis12) in Eurostat database. |
||||||||||||||||||||||||||||||||||||||||||||||||||||
| 3.5. Statistical unit | ||||||||||||||||||||||||||||||||||||||||||||||||||||
Tha statistical unit of the survey is the enterprise. The enterprise is the combination of legal units that is an organizational unit producing goods or services, which benefits from certain degree of autonomy in decision making. An enterprise carries out one or more activities at one or more locations. An enterprise may be sole unit or combination of legal units. |
||||||||||||||||||||||||||||||||||||||||||||||||||||
| 3.6. Statistical population | ||||||||||||||||||||||||||||||||||||||||||||||||||||
Core target population are all enterprises in CORE NACE activities (see 3.3.1) with 10 or more employees. |
||||||||||||||||||||||||||||||||||||||||||||||||||||
| 3.7. Reference area | ||||||||||||||||||||||||||||||||||||||||||||||||||||
NUTS1 and NUTS2 are Latvia, but for national needs data are collected in NUTS3 level (LV003 Kurzeme, LV005 Latgale, LV006 Rīga, LV007 Pierīga, LV008 Vidzeme, LV009 Zemgale). |
||||||||||||||||||||||||||||||||||||||||||||||||||||
| 3.8. Coverage - Time | ||||||||||||||||||||||||||||||||||||||||||||||||||||
Several rounds of Community Innovation Survey have been conducted so far at two-year interval since end of 90’s. |
||||||||||||||||||||||||||||||||||||||||||||||||||||
| 3.8.1. Participation in the CIS waves | ||||||||||||||||||||||||||||||||||||||||||||||||||||
*two reference periods can be distinguished for CIS light: 2000-2002 and 2001-2003 |
||||||||||||||||||||||||||||||||||||||||||||||||||||
| 3.9. Base period | ||||||||||||||||||||||||||||||||||||||||||||||||||||
Not relevant. |
||||||||||||||||||||||||||||||||||||||||||||||||||||
|
|||
CIS indicators are available according to 3 units of measure:
NR: Number for number of enterprises and number of persons employed. THS_EUR: Thousands of euros. All financial variables are provided in thousands of euros, i.e. Turnover or Innovation expenditure. PC: Percentage. The percentage is the ratio between the selected combinations of indicators. |
|||
|
|||
For CIS 2020, the time covered by the survey is the 3-year period from the beginning of 2018 to the end of 2020. Some questions and indicators refer to one year — 2020. The list of indicators covering the 3-year period and referring to one year according to the HDC is available in the Annex section of the European metadata (ESMS). |
|||
|
|||
| 6.1. Institutional Mandate - legal acts and other agreements | |||
CIS surveys are based on the Commission Regulation No 995/2012, implementing Decision No 1608/2003/EC of the European Parliament and of the Council on the production and development of Community statistics on science and technology. This Regulation establishes innovation statistics on a statutory basis and makes the delivery of certain variables compulsory e.g. innovation activities, cooperation, development, expenditures and turnover (see the Regulation). Each survey wave may additionally include further variables. In addition, the Regulation defines the obligatory cross-coverage of economic sectors and size class of enterprises. |
|||
| 6.1.1. National legislation | |||
Statistics Law; Cabinet regulation Nr. 691 "Official Statistics Programme for 2021–2023" (only in Latvian). Annexes: Statistics Law Cabinet regulation Nr. 691 |
|||
| 6.2. Institutional Mandate - data sharing | |||
Not applicable. |
|||
|
|||
CIS data are transmitted to Eurostat via EDAMIS using the secured transmission system. |
|||
| 7.1. Confidentiality - policy | |||
Regulation (EC) No 223/2009 of the European Parliament and of the Council on European statistics Statistics Law |
|||
| 7.2. Confidentiality - data treatment | |||
Statistical data shall be considered confidential if they directly or indirectly allow for identification of the private individuals or State authorities regarding which personal statistical data have been provided (primary and secondary confidentiality are applied ). |
|||
|
|||
| 8.1. Release calendar | |||
The release policy and release calendar exists and they are publicly accessible. |
|||
| 8.2. Release calendar access | |||
See annexes. Annexes: Release calendar |
|||
| 8.3. Release policy - user access | |||
Users are informed that the data is being released by release calendar. Before the official time of publication, some officials are granted access to statistical data to ensure them time needed for data analysis, understanding and preparation of the point of view. Before provision of such information, the CSB assesses the need and benefits to the society, as well as concludes an agreement on compliance with data confidentiality. Information on the privileged access to statistical data is published on the CSB website. |
|||
|
|||
CIS is conducted and disseminated at two-year interval in pair years. |
|||
|
|||||||||||||||
Accessibility and clarity refer to the simplicity and ease for users to access statistics using simple and user-friendly procedure, obtaining them in an expected form and within an acceptable time period, with the appropriate user information and assistance: a global context which finally enables them to make optimum use of the statistics. |
|||||||||||||||
| 10.1. Dissemination format - News release | |||||||||||||||
See below. |
|||||||||||||||
| 10.1.1. Availability of the releases | |||||||||||||||
|
|||||||||||||||
| 10.2. Dissemination format - Publications | |||||||||||||||
- Online database (containing all/most results) : Yes - Analytical publication (referring to all/most results) : Yes - Analytical publication (referring to specific results, e.g. only for one sector or one specific aspect) : Yes Annexes: Publication that contains main results Online database |
|||||||||||||||
| 10.3. Dissemination format - online database | |||||||||||||||
Online database is available Annexes: Online database |
|||||||||||||||
| 10.3.1. Data tables - consultations | |||||||||||||||
No |
|||||||||||||||
| 10.4. Dissemination format - microdata access | |||||||||||||||
Microdata are available under some conditions. |
|||||||||||||||
| 10.4.1. Dissemination of microdata | |||||||||||||||
|
|||||||||||||||
| 10.5. Dissemination format - other | |||||||||||||||
No |
|||||||||||||||
| 10.5.1. Metadata - consultations | |||||||||||||||
No |
|||||||||||||||
| 10.6. Documentation on methodology | |||||||||||||||
Statistical publication "Innovation statistics" and core data in online database is accompanied with definitions and explanations. Oslo Manual 2018: Guidelines for Collecting, Reporting and Using Data on Innovation, 4th Edition. |
|||||||||||||||
| 10.6.1. Metadata completeness - rate | |||||||||||||||
Not applicable |
|||||||||||||||
| 10.7. Quality management - documentation | |||||||||||||||
A quality report is sent to Eurostat for each period of the innovation survey and reference metadata are available in CSB web page Annexes: Metadata |
|||||||||||||||
|
|||
| 11.1. Quality assurance | |||
CSB has introduced Quality Management System (QMS). The system is directed towards providing high user satisfaction and ensuring compliance with regulatory enactments. Based on the structure of Generic Statistical Business Process Model (GSBPM), QMS defines and at the level of procedures describes processes of statistical production as well as sets the persons responsible for the monitoring of processes at all stages of the statistical production. QMS defines the sequence how processes are implemented (i.e., activities to be performed (incl. verifications of processes and statistics, sequence and implementation requirements thereof, as well as persons responsible for the implementation)), procedures used in the evaluation of processes and statistics, as well as any improvements needed. |
|||
| 11.2. Quality management - assessment | |||
Quality of statistics is assessed in accordance with the existing requirements of external and internal regulatory enactments and in accordance with the established quality criteria. CIS 2018 methodology had a high quality respect to all quality criteria, e.g. high unit response rate, on-line questionnaires which decrease the number of errors in data, re-contacting enterprises when data were missing or inconsistencies were observed, confidentiality was respected. Weaknesses: "Innovation concept" as a whole, which makes it difficult for the enterprise to assess their own activities as innovative or not innovative, quantification of the turnover from innovative products because of the difficulty in highlighting these origins of the turnover. To enhance understanding of enterprises regarding innovation activities, informative material with additional explanations is being elaborated. |
|||
|
|||||||||||||||
Relevance is the degree to which statistics meet current and potential users’ needs. It includes the production of all needed statistics and the extent to which concepts used (definitions, classifications etc.) reflect user needs. The aim is to describe the extent to which the statistics are useful to, and used by, the broadest array of users. For this purpose, statisticians need to compile information, firstly about their users and their needs. The CIS is based on a common questionnaire and a common survey methodology in order to achieve comparable, harmonised and high quality results for EU Member States, EFTA countries, Candidates and Associated countries. |
|||||||||||||||
| 12.1. Relevance - User Needs | |||||||||||||||
The CIS 2020 data is beeing used in national, international and European level. Central Statistical Bureau of Latvia takes into account statistical data main user needs. |
|||||||||||||||
| 12.1.1. Needs at national level | |||||||||||||||
|
|||||||||||||||
| 12.2. Relevance - User Satisfaction | |||||||||||||||
No user satisfaction survey has been conducted. |
|||||||||||||||
| 12.3. Completeness | |||||||||||||||
No missing cells in the standard CIS 2020 output tabulation at national level. |
|||||||||||||||
| 12.3.1. Data completeness - rate | |||||||||||||||
Not applicable |
|||||||||||||||
|
||||||||||||||||||||
| 13.1. Accuracy - overall | ||||||||||||||||||||
Accuracy in the statistical sense denotes the closeness of computations or estimates to the exact or true values. Statistics are not equal with the true values because of variability (the statistics change from implementation to implementation of the survey due to random effects) and bias (the average of the possible values of the statistics from implementation to implementation is not equal to the true value due to systematic effects). |
||||||||||||||||||||
| 13.2. Sampling error | ||||||||||||||||||||
That part of the difference between a population value and an estimate thereof, derived from a random sample, which is due to the fact that only a subset of the population is enumerated. |
||||||||||||||||||||
| 13.2.1. Sampling error - indicators | ||||||||||||||||||||
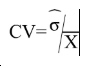
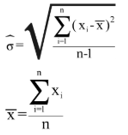
The main indicator used to measure sampling errors for CIS data is the coefficient of variation (CV).
Coefficient of Variation= (Square root of the estimate of the sampling variance) / (Estimated value) Formula: where
|
||||||||||||||||||||
| 13.2.1.1. Coefficient of variations for key variables | ||||||||||||||||||||
Coefficient of variation (%) for key variables by NACE categories and for enterprises with 10 and more employees
[1] = Coefficient of variation for the percentage of innovative enterprises (INN) in the total population of enterprises (ENT20) |
||||||||||||||||||||
| 13.2.1.2. Variance estimation method | ||||||||||||||||||||
The CVs is calculated according to the sampling design, taking in account weighting. R software is used for calculation of CVs. The precision estimation is done by the ultimate cluster method ( Hansen, Hurwitz and Madow, 1953) with Taylor linearization for non linear statistics. |
||||||||||||||||||||
| 13.3. Non-sampling error | ||||||||||||||||||||
Non-sampling errors occur in all phases of a survey. They add to the sampling errors (if present) and contribute to decreasing overall accuracy. It is important to assess their relative weight in the total error and devote appropriate resources for their control and assessment. |
||||||||||||||||||||
| 13.3.1. Coverage error | ||||||||||||||||||||
Coverage errors (or frame errors) are due to divergences between the target population and the frame population. The frame population is the set of target population members that has a chance to be selected into the survey sample. It is a listing of all items in the population from which the sample is drawn that contains contact details as well as sufficient information to perform stratification and sampling. |
||||||||||||||||||||
| 13.3.1.1. Over-coverage - rate | ||||||||||||||||||||
Not applicable. |
||||||||||||||||||||
| 13.3.1.2. Common units - proportion | ||||||||||||||||||||
Not applicable. |
||||||||||||||||||||
| 13.3.1.3. Under covered groups of the target population | ||||||||||||||||||||
Overcoverage was measured. |
||||||||||||||||||||
| 13.3.1.4. Coverage errors in coefficient variation | ||||||||||||||||||||
No |
||||||||||||||||||||
| 13.3.2. Measurement error | ||||||||||||||||||||
Measurement errors occur during data collection and generate bias by recording values different than the true ones. The survey questionnaire used for data collection may have led to the recording of wrong values, or there may be respondent or interviewer bias. |
||||||||||||||||||||
| 13.3.2.1. Measures for reducing measurement errors | ||||||||||||||||||||
Methodological material for statisticians was prepared to keep them informed about innovations in line with the Oslo Manual 4th Edition of 2018. The development of such a relatively short and concise material allowed statisticians to better communicate with enterprises in the data collection process, identify potential innovative enterprises and ask precise questions and provide the necessary explanations. One day training for statiscians took place in february 2021 before the data collection process started. |
||||||||||||||||||||
| 13.3.3. Non response error | ||||||||||||||||||||
Non response occurs when a survey fails to collect data on all survey variables from all the population units designated for data collection in a sample or complete enumeration. There are two types of non-response: 1) Unit non-response, which occurs when no data (or so little as to be unusable) are collected about a population unit designated for data collection. a) Un-weighted unit non-response rate (%) = 100*(Number of units with no response or not usable response) / (Total number of in-scope (eligible) units in the sample) b) Weighted unit non-response rate (%) = 100*(Number of weighted units with no response or not usable response) / (Total number of in-scope (eligible) units in the sample) 2) Item non-response, which occurs when only data on some, but not all survey data items are collected about a population unit designated for data collection. a) Un-weighted item non-response rate (%) = 100*(Number of units with no response at all for the item) / (Total number of eligible, for the item, units in the sample i.e. filters have to be taken into account)
CIS 2018 data were collected though online questionnaires (validation rules were prepared) which decrease the number of errors in data, in some cases statisticians recontacted enterprises when data were missing or inconsistencies were observed. |
||||||||||||||||||||
| 13.3.3.1. Unit non-response - rate | ||||||||||||||||||||
See below. |
||||||||||||||||||||
| 13.3.3.1.1. Un-weighted and weighted unit non-response rate by NACE categories and for enterprises with 10 or more employees | ||||||||||||||||||||
Un-weighted and weighted unit non-response rate by NACE categories and for enterprises with 10 or more employees
The number of eligible units is the number of sample units, which indeed belong to the target population. |
||||||||||||||||||||
| 13.3.3.1.2. Maximum number of recalls/reminders before coding | ||||||||||||||||||||
Approximately 4 e-mails and 4 calls |
||||||||||||||||||||
| 13.3.3.2. Item non-response - rate | ||||||||||||||||||||
See below. |
||||||||||||||||||||
| 13.3.3.2.1. Item non-response rate for Turnover (in Core NACE: B-C-D-E-46-H-J-K-71-72-73 enterprises with 10 or more employees) | ||||||||||||||||||||
Item non-response rate for Turnover (in Core NACE: B-C-D-E-46-H-J-K-71-72-73 enterprises with 10 or more employees).
|
||||||||||||||||||||
| 13.3.3.2.2. Item non response rate for new questions | ||||||||||||||||||||
Item non-response rate for new questions in CIS t (in Core NACE: B-C-D-E-46-H-J-K-71-72-73 enterprises with 10 or more employees)
|
||||||||||||||||||||
| 13.3.4. Processing error | ||||||||||||||||||||
In integrated statistical data management system of the CSB all indicators included in the questionnaire form were described: the obligatory ones necessary to fulfil the requirements of the Regulation, as well as all other. Validation rules were described with the help of preliminary survey experience and by creating new terms for the changed or new indicators. |
||||||||||||||||||||
| 13.3.5. Model assumption error | ||||||||||||||||||||
Not applicable. |
||||||||||||||||||||
|
|||
Timeliness and punctuality refer to time and dates, but in a different manner. |
|||
| 14.1. Timeliness | |||
The timeliness of statistics reflects the length of time between data availability and the event or phenomenon they describe. |
|||
| 14.1.1. Time lag - first result | |||
Timeliness of national data – date of first release of national level : 14.07.2022 |
|||
| 14.1.2. Time lag - final result | |||
|
|||
| 14.2. Punctuality | |||
Punctuality refers to the time lag between the release date of data and the target date on which they were scheduled for release as announced officially. |
|||
| 14.2.1. Punctuality - delivery and publication | |||
Date of transmission of complete and validated data to Eurostat (Number of days between that data and 30 June 2022) : 0 |
|||
|
||||||||||||||||||||||||||||
Comparability aims at measuring the impact of differences in applied statistical concepts and definitions on the comparison of statistics between geographical areas, non-geographical domains, or over time. The coherence of statistical outputs refers to the degree to which the statistical processes by which they were generated used the same concepts (classifications, definitions, and target populations) and harmonised methods. Coherent statistical outputs have the potential to be validly combined and used jointly. |
||||||||||||||||||||||||||||
| 15.1. Comparability - geographical | ||||||||||||||||||||||||||||
The data are comparable with countries which collect data. |
||||||||||||||||||||||||||||
| 15.1.1. Asymmetry for mirror flow statistics - coefficient | ||||||||||||||||||||||||||||
Not applicable |
||||||||||||||||||||||||||||
| 15.1.2. National questionnaire – compliance with Eurostat model questionnaire | ||||||||||||||||||||||||||||
Methodological deviations from the CIS Harmonised Data Collection (HDC)
|
||||||||||||||||||||||||||||
| 15.1.3. National questionnaire – additional questions | ||||||||||||||||||||||||||||
Methodological deviations from the CIS Harmonised Data Collection (HDC)
|
||||||||||||||||||||||||||||
| 15.2. Comparability - over time | ||||||||||||||||||||||||||||
Due to important methodological changes driven by Oslo Manual 2018, CIS 2018 and CIS 2020 cannot be directly compared with previous CIS waves. |
||||||||||||||||||||||||||||
| 15.2.1. Length of comparable time series | ||||||||||||||||||||||||||||
Not applicable |
||||||||||||||||||||||||||||
| 15.3. Coherence - cross domain | ||||||||||||||||||||||||||||
See the comparison between SBS and CIS data in the section 15.3.3 below. |
||||||||||||||||||||||||||||
| 15.3.1. Coherence - sub annual and annual statistics | ||||||||||||||||||||||||||||
Not applicable |
||||||||||||||||||||||||||||
| 15.3.2. Coherence - National Accounts | ||||||||||||||||||||||||||||
Not applicable |
||||||||||||||||||||||||||||
| 15.3.3. Coherence – Structural Business Statistics (SBS) | ||||||||||||||||||||||||||||
This part compares key variables for aggregated CIS data with SBS data
* Numbers are to be provided for the last year of the reference period (t) |
||||||||||||||||||||||||||||
| 15.4. Coherence - internal | ||||||||||||||||||||||||||||
Not applicable |
||||||||||||||||||||||||||||
|
|||
Confidential information on the production cost of the CIS. |
|||
|
|||
| 17.1. Data revision - policy | |||
Revision Policy is an important component of good governance practice addressed more and more often in the international statistical society. The objective of the Revision Policy is to lay down the order of review or revision of the prepared and published data. The first chapter of the present document explains the terms applied in the Revision Policy, the second chapter shortly characterises the CSB Revision Policy, whereas the third chapter stipulates the revision cycle of the statistical data produced by the CSB. Annexes: Revision policy guidelines |
|||
| 17.2. Data revision - practice | |||
Not applicable |
|||
| 17.2.1. Data revision - average size | |||
Not applicable |
|||
|
||||||||||||||||||||||||||||||||||||||
| 18.1. Source data | ||||||||||||||||||||||||||||||||||||||
See below: |
||||||||||||||||||||||||||||||||||||||
| 18.1.1. Sampling frame (or census frame) | ||||||||||||||||||||||||||||||||||||||
The population frame of the survey was drawn from the target population that was updated in November 2020, using the Statistical Business Register of Central Statistical Bureau. |
||||||||||||||||||||||||||||||||||||||
| 18.1.2. Sampling design | ||||||||||||||||||||||||||||||||||||||
The sampling design was stratified simple random sample. Enterprises were stratified by the size class of enterprise and economic activity by NACE 2.red. classifications. The number of strata was 663, sample size 3108 units. Optimized Neyman allocation is used. |
||||||||||||||||||||||||||||||||||||||
| 18.1.3. Target population and sample size | ||||||||||||||||||||||||||||||||||||||
|
||||||||||||||||||||||||||||||||||||||
| 18.1.4. Data source for pre-filled variables | ||||||||||||||||||||||||||||||||||||||
Variables and indicators filled or prefilled from other sources.
|
||||||||||||||||||||||||||||||||||||||
| 18.1.5. Data source and variables used for derivation and weighting | ||||||||||||||||||||||||||||||||||||||
|
||||||||||||||||||||||||||||||||||||||
| 18.2. Frequency of data collection | ||||||||||||||||||||||||||||||||||||||
According to the Commission Regulation (UE) 995/2012, the innovation statistics shall be provided to Eurostat every two years in each even year t+18. |
||||||||||||||||||||||||||||||||||||||
| 18.3. Data collection | ||||||||||||||||||||||||||||||||||||||
Data are collected with the statistical questionnaire “Innovation in business”. |
||||||||||||||||||||||||||||||||||||||
| 18.3.1. Survey participation | ||||||||||||||||||||||||||||||||||||||
According to the Law on State Statistics a respondent has a duty to prepare and submit statistical data upon the request of the Central Statistical Bureau. |
||||||||||||||||||||||||||||||||||||||
| 18.3.2. Survey type | ||||||||||||||||||||||||||||||||||||||
Data were collected through a combination of both census and sampling. The sample design is a stratified simple random sample. |
||||||||||||||||||||||||||||||||||||||
| 18.3.3. Combination of sample survey and census data | ||||||||||||||||||||||||||||||||||||||
Units that were covered by complete enumeration were: enterprises with more than 250 employees; enterprises that had reported activity in the survey CIS2018; enterprises which conducted innovative activity (information from other sources), enterprises with the following occupations in 2019 or 2020 - head/director of research department, deputy head/deputy director of research department, senior scientist, scientist. The rest of enterprises were covered through sampling. |
||||||||||||||||||||||||||||||||||||||
| 18.3.4. Census criteria | ||||||||||||||||||||||||||||||||||||||
Census was used for units with number of emploees 250 and more. Enterprises which in the previous innovation survey indicated at least one type of innovation activity (product, process, organisational, marketing, suspended before completion, still ongoing at the end of the 2018). Enterprises which conducted innovative activity (information from other sources). Enterprises with the following occupations in 2019 or 2020 - head/director of research department, deputy head/deputy director of research department, senior scientist, scientist. |
||||||||||||||||||||||||||||||||||||||
| 18.3.5. Data collection method | ||||||||||||||||||||||||||||||||||||||
Data collection method
|
||||||||||||||||||||||||||||||||||||||
| 18.4. Data validation | ||||||||||||||||||||||||||||||||||||||
When processing the data, the microdata are validated (logistic and mathematical control of microdata, comparison of the microdata with those in other reports and surveys as well as results of innovation surveys conducted prior). |
||||||||||||||||||||||||||||||||||||||
| 18.5. Data compilation | ||||||||||||||||||||||||||||||||||||||
Operations performed on data to derive new information according to a given set of rules. |
||||||||||||||||||||||||||||||||||||||
| 18.5.1. Imputation - rate | ||||||||||||||||||||||||||||||||||||||
Imputation is the method of creating plausible (but artificial) substitute values for all those missing. Definition of imputation rate: Imputation rate (for the variable x) (%) = 100*(Number of replaced values) / (Total number of values for a given variable) Definition of weighted imputation rate: Weighted imputation rate= 100*(Number of total weighted replaced values) / (Total number of weighted values for a given variable) |
||||||||||||||||||||||||||||||||||||||
| 18.5.1.1. Imputation rate for metric variables | ||||||||||||||||||||||||||||||||||||||
Imputation rate for metric variables by NACE categories and for enterprises with 10 or more employees:
No imputation was performed. (1) = Total turnover in the last year of the reference period (t) (TUR) (2) = Share of the turnover in the last year of the reference period (t) due to new or improved product new to the market in the total turnover for product innovative enterprises TUR_PRD_NEW_MKT/TUR(INNO_PRD) (3) = R&D expenditure performed in-house (EXP_INNO_RND_IH) |
||||||||||||||||||||||||||||||||||||||
| 18.5.2. Weights calculation | ||||||||||||||||||||||||||||||||||||||
Weights calculation method for sample surveys
|
||||||||||||||||||||||||||||||||||||||
| 18.6. Adjustment | ||||||||||||||||||||||||||||||||||||||
R package vardpoor used for calculation of CVs. |
||||||||||||||||||||||||||||||||||||||
| 18.6.1. Seasonal adjustment | ||||||||||||||||||||||||||||||||||||||
Not applicable |
||||||||||||||||||||||||||||||||||||||
|
|||
|
|||
|
|||