|
 |
| For any question on data and metadata, please contact: Eurostat user support |
|
|||
| 1.1. Contact organisation | ISTAT -Italian National Institute of Statistics |
||
| 1.2. Contact organisation unit | Directorate for Economic Statistics (DCSE) |
||
| 1.5. Contact mail address | Via Tuscolana 1788, 00173 Rome, Italy |
||
|
|||
| 2.1. Metadata last certified | 30/05/2024 | ||
| 2.2. Metadata last posted | 30/05/2024 | ||
| 2.3. Metadata last update | 30/05/2024 | ||
|
||||||||||||||||||||||||||||||||||||||||||||||||||||
| 3.1. Data description | ||||||||||||||||||||||||||||||||||||||||||||||||||||
The Community Innovation Survey (CIS) is a survey about innovation activities in enterprises. The survey is designed to collect the information on types of innovation, processes of development of innovation like cooperation patterns, financing and expenditure, objectives of innovation activities or barriers for initiating or implementing innovation. The CIS provides statistics by type of innovators, economic activity and size class of enterprises. The survey is currently carried out every two years across the EU Member States, EFTA countries and EU candidate countries.
In order to ensure comparability across countries, Eurostat together with the countries develops a Harmonised Data Collection (HDC) questionnaire and drafts the methodological recommendations for implementation of each survey round.
CIS 2020 is a second in a row to implement concepts and methodology of the Oslo Manual 4th Edition revised in 2018. The changes in the CIS driven by the revision of the manual and their impact on collected indicators are described in the Statistics Explained article: Community Innovation Survey – new features.
The legal framework for CIS since 2012 is the Commission Regulation No 995/2012 that establishes the quality conditions for the data collection and transmission and identifies the obligatory cross-coverage of economic sectors, size class of enterprises and innovation indicators. The target population are enterprises with at least 10 employees classified in the core NACE economic sectors (see 3.3). Further activities may be covered on a voluntary basis in national datasets. Most statistics are based on the 3-year reference period (t, t-1, t-2), but some use only one calendar year (t or t-2). Please refer to the Annex section of the European metadata (ESMS) for details of the time coverage of collected indicators. |
||||||||||||||||||||||||||||||||||||||||||||||||||||
| 3.2. Classification system | ||||||||||||||||||||||||||||||||||||||||||||||||||||
Indicators related to the enterprises are classified by country, economic activity (NACE Rev. 2), size class of enterprises and type of innovation. The main typology of classification of enterprises in reference to innovation is the distinction between innovation-active enterprises (INN) and not innovation-active enterprises (NINN). The enterprise is considered as innovative (INN) if during the reference period it successfully introduced a a) product or a) business process innovation, c) completed but not yet implemented the innovation, d) had ongoing innovation activities, e) abandoned innovation activities or was f) engaged in in-house R&D or R&D contracted out. Non-innovative (NINN) enterprises had no innovation activity mentioned above whatsoever during the reference period. |
||||||||||||||||||||||||||||||||||||||||||||||||||||
| 3.3. Coverage - sector | ||||||||||||||||||||||||||||||||||||||||||||||||||||
CIS covers main economic sectors according to NACE Rev.2 broken down by size class of enterprises and type of innovation activity. |
||||||||||||||||||||||||||||||||||||||||||||||||||||
| 3.3.1. Main economic sectors covered - NACE Rev.2 | ||||||||||||||||||||||||||||||||||||||||||||||||||||
In accordance with Commission Regulation 995/2012 on innovation statistics, the following industries and services are included in the core target population. Results are made available with these following breakdowns : All NACE – Core NACE (NACE Rev. 2 sections & divisions B-C-D-E-46-H-J-K-71-72-73 )
CORE INDUSTRY (excluding construction) (NACE Rev. 2 SECTIONS B_C_D_E) 10-12: Manufacture of food products, beverages and tobacco 13-15: Manufacture of textiles, wearing apparel, leather and related products 16-18: Manufacture of wood, paper, printing and reproduction 20: Manufacture of chemicals and chemical products 21: Manufacture of basic pharmaceutical products and pharmaceutical preparations 19-22: Manufacture of petroleum, chemical, pharmaceutical, rubber and plastic products 23: Manufacture of other non-metallic mineral products 24: Manufacture of basic metals 25: Manufacture of fabricated metal products, except machinery and equipment 26: Manufacture of computer, electronic and optical products 25-30: Manufacture of fabricated metal products (except machinery and equipment), computer, electronic and optical products, electrical equipment, motor vehicles and other transport equipment 31-33: Manufacture of furniture; jewellery, musical instruments, toys; repair and installation of machinery and equipment
D: ELECTRICITY, GAS, STEAM AND AIR CONDITIONING SUPPLY
E: WATER SUPPLY; SEWERAGE, WASTE MANAGEMENT AND REMEDIATION ACTIVITIES 36: Water collection, treatment and supply 37-39: Sewerage, waste management, remediation activities
CORE SERVICES (NACE Rev. 2 sections & divisions 46-H-J-K-71-72-73)(NACE code in the tables = G46-M73_INN) 46: Wholesale trade, except of motor vehicles and motorcycles
H: TRANSPORTATION AND STORAGE 49-51: Land transport and transport via pipelines, water transport and air transport 52-53: Warehousing and support activities for transportation and postal and courier activities
J: INFORMATION AND COMMUNICATION 58: Publishing activities 61: Telecommunications 62: Computer programming, consultancy and related activities 63: Information service activities
K: FINANCIAL AND INSURANCE ACTIVITIES 64: Financial service activities, except insurance and pension funding 65: Insurance, reinsurance and pension funding, except compulsory social security 66: Activities auxiliary to financial services and insurance activities
M: PROFESSIONAL, SCIENTIFIC AND TECHNICAL ACTIVITIES 71: Architectural and engineering activities; technical testing and analysis 72: Scientific research and development 73: Advertising and market research 71-73: Architectural and engineering activities; technical testing and analysis; Scientific research and development; Advertising and market research
|
||||||||||||||||||||||||||||||||||||||||||||||||||||
| 3.3.1.1. Main economic sectors covered - NACE Rev.2 - national particularities | ||||||||||||||||||||||||||||||||||||||||||||||||||||
The Italian survey covered the following non Eu-core sectors: NACE Rev. 2 section F and NACE Rev. 2 divisions 45, 47, 68, 69, 70, 74. |
||||||||||||||||||||||||||||||||||||||||||||||||||||
| 3.3.2. Sector coverage - size class | ||||||||||||||||||||||||||||||||||||||||||||||||||||
In accordance with Commission Regulation 995/2012 on innovation statistics, the following size classes of enterprises according to number of employees are included in the core target population of the CIS:
|
||||||||||||||||||||||||||||||||||||||||||||||||||||
| 3.3.2.1. Sector coverage - size class - national particularities | ||||||||||||||||||||||||||||||||||||||||||||||||||||
In the Italian Cis2018 size classes are defined by the number of persons employed and not by the number of employees. |
||||||||||||||||||||||||||||||||||||||||||||||||||||
| 3.4. Statistical concepts and definitions | ||||||||||||||||||||||||||||||||||||||||||||||||||||
The description of concepts, definitions and main statistical variables is available in CIS 2020 European metadata file (ESMS) Results of the community innovation survey 2020 (CIS2020) (inn_cis12) in Eurostat database. |
||||||||||||||||||||||||||||||||||||||||||||||||||||
| 3.5. Statistical unit | ||||||||||||||||||||||||||||||||||||||||||||||||||||
Legal unit |
||||||||||||||||||||||||||||||||||||||||||||||||||||
| 3.6. Statistical population | ||||||||||||||||||||||||||||||||||||||||||||||||||||
Core target population are all enterprises in CORE NACE activities (see 3.3.1) with 10 or more persons employed. |
||||||||||||||||||||||||||||||||||||||||||||||||||||
| 3.7. Reference area | ||||||||||||||||||||||||||||||||||||||||||||||||||||
NUTS level 2 |
||||||||||||||||||||||||||||||||||||||||||||||||||||
| 3.8. Coverage - Time | ||||||||||||||||||||||||||||||||||||||||||||||||||||
Several rounds of Community Innovation Survey have been conducted so far at two-year interval since end of 90’s. |
||||||||||||||||||||||||||||||||||||||||||||||||||||
| 3.8.1. Participation in the CIS waves | ||||||||||||||||||||||||||||||||||||||||||||||||||||
*two reference periods can be distinguished for CIS light: 2000-2002 and 2001-2003 |
||||||||||||||||||||||||||||||||||||||||||||||||||||
| 3.9. Base period | ||||||||||||||||||||||||||||||||||||||||||||||||||||
Not relevant. |
||||||||||||||||||||||||||||||||||||||||||||||||||||
|
|||
CIS indicators are available according to 3 units of measure:
NR: Number for number of enterprises and number of persons employed. THS_EUR: Thousands of euros. All financial variables are provided in thousands of euros, i.e. Turnover or Innovation expenditure. PC: Percentage. The percentage is the ratio between the selected combinations of indicators. |
|||
|
|||
For CIS 2020, the time covered by the survey is the 3-year period from the beginning of 2018 to the end of 2020. Some questions and indicators refer to one year — 2020. The list of indicators covering the 3-year period and referring to one year according to the HDC is available in the Annex section of the European metadata (ESMS). |
|||
|
|||
| 6.1. Institutional Mandate - legal acts and other agreements | |||
CIS surveys are based on the Commission Regulation No 995/2012, implementing Decision No 1608/2003/EC of the European Parliament and of the Council on the production and development of Community statistics on science and technology. This Regulation establishes innovation statistics on a statutory basis and makes the delivery of certain variables compulsory e.g. innovation activities, cooperation, development, expenditures and turnover (see the Regulation). Each survey wave may additionally include further variables. In addition, the Regulation defines the obligatory cross-coverage of economic sectors and size class of enterprises. |
|||
| 6.1.1. National legislation | |||
Decreto del Presidente della Repubblica 25 novembre 2020, di approvazione del Programma statistico nazionale 2017-2019 – Aggiornamento 2019 e dei collegati elenchi delle rilevazioni con obbligo di risposta per i soggetti privati e dei lavori per i quali la mancata fornitura dei dati configura violazione dell’obbligo di risposta sanzionata ai sensi degli artt. 7 e 11 del decreto legislativo 6 settembre 1989, n. 322 (S.O. n. 8 alla Gazzetta Ufficiale 11 febbraio 2021 - serie generale - n.35). |
|||
| 6.2. Institutional Mandate - data sharing | |||
Not requested. |
|||
|
|||
CIS data are transmitted to Eurostat via EDAMIS using the secured transmission system. |
|||
| 7.1. Confidentiality - policy | |||
- Regolamento (UE) 2016/679 del Parlamento europeo e del Consiglio, del 27 aprile 2016, relativo alla protezione delle persone fisiche con riguardo al trattamento dei dati personali, nonché alla libera circolazione di tali dati e che abroga la direttiva 95/46/CE (Regolamento generale sulla protezione dei dati). - Decreto legislativo 6 settembre 1989, n. 322, “Norme sul Sistema statistico nazionale e sulla riorganizzazione dell'Istituto nazionale di statistica” – art. 6 (compiti degli uffici di statistica), art. 6-bis (trattamenti di dati personali), art. 7 (obbligo di fornire dati statistici), art. 8 (segreto d'ufficio degli addetti agli uffici di statistica), art. 9 (disposizioni per la tutela del segreto statistico), art. 11 (sanzioni amministrative), art. 13 (Programma statistico nazionale). - Decreto legislativo 30 giugno 2003, n. 196 “Codice in materia di protezione dei dati personali”. - Regole deontologiche per trattamenti a fini statistici o di ricerca scientifica effettuati nell’ambito del Sistema statistico nazionale - Delibera del Garante per la Protezione dei dati personali n. 514 del 19 dicembre 2018. |
|||
| 7.2. Confidentiality - data treatment | |||
Confidentiality flags are when just one or two enterprise dominate the data. |
|||
|
|||
| 8.1. Release calendar | |||
The last statistical release was the 5th of May 2022: L’innovazione nelle imprese (istat.it). |
|||
| 8.2. Release calendar access | |||
Not available. |
|||
| 8.3. Release policy - user access | |||
Istat’s dissemination policy is oriented towards different target groups: citizens, who want data on the country, researchers, who require statistical classification and “ad hoc” analyses, students, surveys respondents and, of course, the media. The Institute has set up different channels for each target, in order to better meet the requests for information. Press releases are issued according to a fixed press release calendar. The press releases are simultaneously distributed by e-mail to institutions, all media and press members and research institutes, and are published on this website. |
|||
|
|||
CIS is conducted and disseminated at two-year interval in pair years. |
|||
|
|||||||||||||||
Accessibility and clarity refer to the simplicity and ease for users to access statistics using simple and user-friendly procedure, obtaining them in an expected form and within an acceptable time period, with the appropriate user information and assistance: a global context which finally enables them to make optimum use of the statistics. |
|||||||||||||||
| 10.1. Dissemination format - News release | |||||||||||||||
Regular press releases linked to the data. The last one is available on the following website: L'innovazione nelle imprese. Anni 2018-2020 |
|||||||||||||||
| 10.1.1. Availability of the releases | |||||||||||||||
|
|||||||||||||||
| 10.2. Dissemination format - Publications | |||||||||||||||
- Online database (containing all/most results) : Istat Statistics - Analytical publication (referring to all/most results) : L'innovazione nelle imprese. Anni 2018-2020 - Analytical publication (referring to specific results, e.g. only for one sector or one specific aspect) : |
|||||||||||||||
| 10.3. Dissemination format - online database | |||||||||||||||
An online database is available on the following website: dati.istat.it |
|||||||||||||||
| 10.3.1. Data tables - consultations | |||||||||||||||
Not requested. |
|||||||||||||||
| 10.4. Dissemination format - microdata access | |||||||||||||||
Microdata are disseminated through the Laboratory for Elementary Data Analysis (ADELE)- It is a “safe” environment in which researchers from universities or research institutions or bodies to which the Code of conduct and professional practice applying to processing of personal data for statistical and scientific purposes applies may conduct statistical analyses that require the use of elementary data, where information already available with other tools is not sufficient (I.Stat data warehouse). Within the Laboratory, data security and statistical confidentiality are guaranteed by the control of both the working methods and the results of the analyzes conducted by the users. Once the processing is complete, the output is evaluated in terms of statistical confidentiality by the experts of the ADELE Laboratory. Only results that positively comply with the Rules for the release of results can be issued. Microdata are also disseminated through microdata files, that are collections of elementary data. ISTAT releases microdata files free of charge. |
|||||||||||||||
| 10.4.1. Dissemination of microdata | |||||||||||||||
|
|||||||||||||||
| 10.5. Dissemination format - other | |||||||||||||||
No other data dissemination was done |
|||||||||||||||
| 10.5.1. Metadata - consultations | |||||||||||||||
Not requested. |
|||||||||||||||
| 10.6. Documentation on methodology | |||||||||||||||
Information on target population, sampling design, data collection and data treatment, weights calculation method, dissemination of the data is available in the Report published at every edition of the survey's edition. The last one is available at the following website: L'innovazione nelle imprese. Anni 2018-2020 |
|||||||||||||||
| 10.6.1. Metadata completeness - rate | |||||||||||||||
Not requested. |
|||||||||||||||
| 10.7. Quality management - documentation | |||||||||||||||
Clarity is difficult to assess and relates to the quality of statistical metadata which are disseminated alongside a statistical product. In effect, it refers to the extent to which the metadata satisfy users needs. Assessment requires information from both the producer for the description of the accompanying information and from the user, for assessing the adequacy and appropriateness of such information for future use. A full technical and practical support is given to facilitate users understanding and usability of Italian CIS data. To our knowledge, users are quite satisfied with clarity of aggregated data and micro-data made available and their accompanying information. |
|||||||||||||||
|
|||
| 11.1. Quality assurance | |||
Istat quality policy is consistent with the European quality framework developed by Eurostat, and transposes its main principles and definitions. The endorsement in 2005 of the European Statistics Code of Practice (last revised in 2017) established the principles to be applied in order to ensure and strengthen both the trust and the quality of the European Statistical System. Essential points of Istat quality policy are:
|
|||
| 11.2. Quality management - assessment | |||
This edition of Cis was fully conducted via Web through a on line questionnaire. In particular, we tested a new electronic data capture, a generalized system for aided development and monitoring of web surveys called GINO++ [much more than Gathering INformation Online] that allows the survey manager himself (that is without software developers) to perform three key phases of a survey: designing, capturing and monitoring. About the response rate, we reach a 66.0% considering the EU core target population. As a whole (considering the Nace section F and other non Eu-core service sectors), after cleaning the initial sample from the frame and coverage errors, especially due to the out-of-scope and dead units, we got a total response rate of 62,3%. About the accuracy of the data, the main perceived problems in CIS2020 are confirmed in the quantification of the turnover from innovative products (Question 3.3), the innovation expenditures (Question 3.8), other enterprise's enpenditures (Question 4.6). For what concerns the question with the highest non response rate (innovation expenditures), direct contacts with respondents confirmed, as in the previous editions, that some respondents consider the collection of such detailed information a very difficult and time-consuming activity. |
|||
|
||||||||||||||||||
Relevance is the degree to which statistics meet current and potential users needs. It includes the production of all needed statistics and the extent to which concepts used (definitions, classifications etc.) reflect user needs. The aim is to describe the extent to which the statistics are useful to, and used by, the broadest array of users. For this purpose, statisticians need to compile information, firstly about their users and their needs. The CIS is based on a common questionnaire and a common survey methodology, as laid down in the 3rd edition of Oslo Manual (2005 edition), in order to achieve comparable, harmonised and high quality results for EU Member States, EFTA countries, Candidates and Associated countries. |
||||||||||||||||||
| 12.1. Relevance - User Needs | ||||||||||||||||||
Since one of our main purposes is to fulfil the needs defined at European level (by adopting a questionnaire as consistent as possible with the Eu one) and since one of the main priorities of our institute is to minimize as much as possible the statistical burden on respondents, we chose to be in line with the Eu questionnaire and to not introduce relevant changes if not really necessary for our various institutions or communities. |
||||||||||||||||||
| 12.1.1. Needs at national level | ||||||||||||||||||
Italian National Institute of Statistics
|
||||||||||||||||||
| 12.2. Relevance - User Satisfaction | ||||||||||||||||||
No user satisfaction survey was undertaken. |
||||||||||||||||||
| 12.3. Completeness | ||||||||||||||||||
The data are available for all the compulsory cells in the standard CIS 2020 output tabulation, except for the Nace 12 (included in the Nace 11). The voluntary cells that were missing refer to Non-Eu core Nace division that were not covered in the Italian survey (such as agriculture and some services). Information on all the variables required by standard CIS 2020 output tabulation was provided. |
||||||||||||||||||
| 12.3.1. Data completeness - rate | ||||||||||||||||||
Not requested. |
||||||||||||||||||
|
||||||||||||||||||||
| 13.1. Accuracy - overall | ||||||||||||||||||||
Accuracy in the statistical sense denotes the closeness of computations or estimates to the exact or true values. Statistics are not equal with the true values because of variability (the statistics change from implementation to implementation of the survey due to random effects) and bias (the average of the possible values of the statistics from implementation to implementation is not equal to the true value due to systematic effects). |
||||||||||||||||||||
| 13.2. Sampling error | ||||||||||||||||||||
That part of the difference between a population value and an estimate thereof, derived from a random sample, which is due to the fact that only a subset of the population is enumerated. |
||||||||||||||||||||
| 13.2.1. Sampling error - indicators | ||||||||||||||||||||
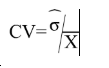
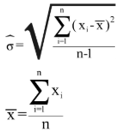
The main indicator used to measure sampling errors for CIS data is the coefficient of variation (CV).
Coefficient of Variation= (Square root of the estimate of the sampling variance) / (Estimated value) Formula: where
|
||||||||||||||||||||
| 13.2.1.1. Coefficient of variations for key variables | ||||||||||||||||||||
Coefficient of variation (%) for key variables by NACE categories and for enterprises with 10 and more employees
[1] = Coefficient of variation for the percentage of innovative enterprises (INN) in the total population of enterprises (ENT20) |
||||||||||||||||||||
| 13.2.1.2. Variance estimation method | ||||||||||||||||||||
The coefficient of variation is the ratio of the square root of the variance of the estimator to the expected value. It is estimated by the ratio of the square root of the estimation of the sampling variance to the estimated value. Sampling design, weighting and changes of strata of sampling units are taken into account in the estimation of the sampling variance. |
||||||||||||||||||||
| 13.3. Non-sampling error | ||||||||||||||||||||
Non-sampling errors occur in all phases of a survey. They add to the sampling errors (if present) and contribute to decreasing overall accuracy. It is important to assess their relative weight in the total error and devote appropriate resources for their control and assessment. |
||||||||||||||||||||
| 13.3.1. Coverage error | ||||||||||||||||||||
Coverage errors (or frame errors) are due to divergences between the target population and the frame population. The frame population is the set of target population members that has a chance to be selected into the survey sample. It is a listing of all items in the population from which the sample is drawn that contains contact details as well as sufficient information to perform stratification and sampling. |
||||||||||||||||||||
| 13.3.1.1. Over-coverage - rate | ||||||||||||||||||||
Not requested. |
||||||||||||||||||||
| 13.3.1.2. Common units - proportion | ||||||||||||||||||||
Not requested. |
||||||||||||||||||||
| 13.3.1.3. Under covered groups of the target population | ||||||||||||||||||||
Coverage errors arise mainly from over-coverage. The main discrepancies between target and frame population include: out-of-scope units, dead units, changes of strata, changes in address. |
||||||||||||||||||||
| 13.3.1.4. Coverage errors in coefficient variation | ||||||||||||||||||||
The estimation of the CVs have taken into account the sampling design and the changes of strata of sampling units. |
||||||||||||||||||||
| 13.3.2. Measurement error | ||||||||||||||||||||
Measurement errors occur during data collection and generate bias by recording values different than the true ones. The survey questionnaire used for data collection may have led to the recording of wrong values, or there may be respondent or interviewer bias. |
||||||||||||||||||||
| 13.3.2.1. Measures for reducing measurement errors | ||||||||||||||||||||
No measure for reducing measurement errors. |
||||||||||||||||||||
| 13.3.3. Non response error | ||||||||||||||||||||
Non response occurs when a survey fails to collect data on all survey variables from all the population units designated for data collection in a sample or complete enumeration. There are two types of non-response: 1) Unit non-response, which occurs when no data (or so little as to be unusable) are collected about a population unit designated for data collection. a) Un-weighted unit non-response rate (%) = 100*(Number of units with no response or not usable response) / (Total number of in-scope (eligible) units in the sample) b) Weighted unit non-response rate (%) = 100*(Number of weighted units with no response or not usable response) / (Total number of in-scope (eligible) units in the sample) 2) Item non-response, which occurs when only data on some, but not all survey data items are collected about a population unit designated for data collection. a) Un-weighted item non-response rate (%) = 100*(Number of units with no response at all for the item) / (Total number of eligible, for the item, units in the sample i.e. filters have to be taken into account) |
||||||||||||||||||||
| 13.3.3.1. Unit non-response - rate | ||||||||||||||||||||
See below. |
||||||||||||||||||||
| 13.3.3.1.1. Un-weighted and weighted unit non-response rate by NACE categories and for enterprises with 10 or more employees | ||||||||||||||||||||
Un-weighted and weighted unit non-response rate by NACE categories and for enterprises with 10 or more persons employed
|
||||||||||||||||||||
| 13.3.3.1.2. Maximum number of recalls/reminders before coding | ||||||||||||||||||||
Two reminders are undertaken before coding an enterprise as non-responding. |
||||||||||||||||||||
| 13.3.3.2. Item non-response - rate | ||||||||||||||||||||
See below. |
||||||||||||||||||||
| 13.3.3.2.1. Item non-response rate for Turnover (in Core NACE: B-C-D-E-46-H-J-K-71-72-73 enterprises with 10 or more employees) | ||||||||||||||||||||
| Restricted from publication | ||||||||||||||||||||
| 13.3.3.2.2. Item non response rate for new questions | ||||||||||||||||||||
Item non-response rate for new questions in CIS t (in Core NACE: B-C-D-E-46-H-J-K-71-72-73 enterprises with 10 or more employees)
|
||||||||||||||||||||
| 13.3.4. Processing error | ||||||||||||||||||||
Web techniques were used for CIS 2020 data capturing. Respondents - through their browsers - can access an electronic questionnaire, put on the Istat web site (https://imprese.istat.it) and fill in it online. The data capture technique used in this edition is a generalised system called GINO++ [much more than Gathering INformation Online] that allowed - without software developers - to design, capture and check on the data entered and monitor the progress of the survey in real-time. It allowed thus to insert some types of hard or soft rules associated with some variables to help in preventing from non sampling errors. With regard to the checking rules which were activated in the electronic questionnaire, we decided to contain them and to limit the hard checks (which prevent the respondent from going on without correcting his errors) so to minimise the risk that respondents give up to fill in the form. Further, we introduced interactive edits so to ask respondents for checking the entered data (and correcting them if necessary) in order to minimise the follow up from the operators. In particular, the system enabled/disabled the possibility of filling in some fields and activated some blocking checks on the questions of the Section 3 and some non-blocking consistency checks on Sections 2 and 4. |
||||||||||||||||||||
| 13.3.5. Model assumption error | ||||||||||||||||||||
Not requested. |
||||||||||||||||||||
|
|||
Timeliness and punctuality refer to time and dates, but in a different manner. |
|||
| 14.1. Timeliness | |||
The timeliness of statistics reflects the length of time between data availability and the event or phenomenon they describe. |
|||
| 14.1.1. Time lag - first result | |||
Timeliness of national data – date of first release of national level : 5 May 2022 |
|||
| 14.1.2. Time lag - final result | |||
Not requested. |
|||
| 14.2. Punctuality | |||
Punctuality refers to the time lag between the release date of data and the target date on which they were scheduled for release as announced officially. |
|||
| 14.2.1. Punctuality - delivery and publication | |||
Date of transmission of complete and validated data to Eurostat (Number of days between that data and 30 June 2022) : 1st June 2022 (29 days before the European deadline) |
|||
|
||||||||||||||||||||
Comparability aims at measuring the impact of differences in applied statistical concepts and definitions on the comparison of statistics between geographical areas, non-geographical domains, or over time. The coherence of statistical outputs refers to the degree to which the statistical processes by which they were generated used the same concepts (classifications, definitions, and target populations) and harmonised methods. Coherent statistical outputs have the potential to be validly combined and used jointly. |
||||||||||||||||||||
| 15.1. Comparability - geographical | ||||||||||||||||||||
The Community Innovation Survey still suffers from some critical methodological drawbacks when it is used for regional analyses. One of the key question has to do with the adoption of the ‘enterprise’ used as statistical unit for data collection. The problem here is to what extent this methodological choice can represent ts the best one for measuring the regional dimension of innovation. The CIS gives the status of innovative to the enterprise as a whole and the criterion used for the regionalisation of the CIS data consists of assigning the overall innovation activity to the region where enterprises’ headquarters are located. This introduces a significant regional bias. Such a problem is especially found in multi-plant enterprises, whose innovation activities can be spread across different regions. More precisely, if regionalization is straightforward for enterprises with only one local unit, it becomes problematic for those with several local units in different regions. According to the traditional regionalisation approach, the enterprises with establishments in more than one region are considered as performing all their innovation activities in the region of the head office. It means that the local units involved in innovation activity and placed in other regions turn out undetectable with the consequence that the survey fails to take into account where innovation activities really take place. In other terms, the conventional CIS regional attribution of innovation activities thus might lead to biased results of the actual spatial distribution of innovation and, namely, lead to an underestimation of the innovation activities of those regions which host productive units of enterprises whose head offices are located elsewhere. A case in point is in out country, where many firms located in the Northern regions have production facilities in the South: this approach would not allow the innovation capabilities in the South to emerge. |
||||||||||||||||||||
| 15.1.1. Asymmetry for mirror flow statistics - coefficient | ||||||||||||||||||||
Not requested. |
||||||||||||||||||||
| 15.1.2. National questionnaire – compliance with Eurostat model questionnaire | ||||||||||||||||||||
Methodological deviations from the CIS Harmonised Data Collection (HDC)
|
||||||||||||||||||||
| 15.1.3. National questionnaire – additional questions | ||||||||||||||||||||
Methodological deviations from the CIS Harmonised Data Collection (HDC)
|
||||||||||||||||||||
| 15.2. Comparability - over time | ||||||||||||||||||||
Due to important methodological changes driven by Oslo Manual 2018, CIS 2018 and CIS 2020 cannot be directly compared with previous CIS waves. |
||||||||||||||||||||
| 15.2.1. Length of comparable time series | ||||||||||||||||||||
Not requested. |
||||||||||||||||||||
| 15.3. Coherence - cross domain | ||||||||||||||||||||
See the comparison between SBS and CIS data in the section 15.3.3 below. |
||||||||||||||||||||
| 15.3.1. Coherence - sub annual and annual statistics | ||||||||||||||||||||
Not requested. |
||||||||||||||||||||
| 15.3.2. Coherence - National Accounts | ||||||||||||||||||||
Not requested. |
||||||||||||||||||||
| 15.3.3. Coherence – Structural Business Statistics (SBS) | ||||||||||||||||||||
This part compares key variables for aggregated CIS data with SBS data
* Numbers are to be provided for the last year of the reference period (t) |
||||||||||||||||||||
| 15.4. Coherence - internal | ||||||||||||||||||||
Not requested. |
||||||||||||||||||||
|
|||
Confidential information on the production cost of the CIS. |
|||
|
|||
| 17.1. Data revision - policy | |||
Not requested. |
|||
| 17.2. Data revision - practice | |||
Not requested. |
|||
| 17.2.1. Data revision - average size | |||
Not requested. |
|||
|
||||||||||||||||||||||||||||||||||||||
| 18.1. Source data | ||||||||||||||||||||||||||||||||||||||
See below. |
||||||||||||||||||||||||||||||||||||||
| 18.1.1. Sampling frame (or census frame) | ||||||||||||||||||||||||||||||||||||||
The sampling frame is the official statistical business register, called ASIA (Archivio Statistico delle Imprese Attive - statistical business register of active enterprises). ASIA provides both the key variables for the stratification (number of employees, NACE economic activity, NUTS geographical information) and the identification characters (enterprise name, address, etc.). Since the most updated version of Asia (reference year: 2020) was used, the CIS2020 survey universe consisted of all the profit enterprises and independent professional units active in 2020. |
||||||||||||||||||||||||||||||||||||||
| 18.1.2. Sampling design | ||||||||||||||||||||||||||||||||||||||
The sample survey is based on a stratified random sample with equal inclusion probabilities for all population units. The target population with less than 250 persons employed was broken down into strata. The stratification was made taking mainly into account the study-domains for the output tabulation defined at European level. |
||||||||||||||||||||||||||||||||||||||
| 18.1.3. Target population and sample size | ||||||||||||||||||||||||||||||||||||||
|
||||||||||||||||||||||||||||||||||||||
| 18.1.4. Data source for pre-filled variables | ||||||||||||||||||||||||||||||||||||||
Variables and indicators filled or prefilled from other sources.
|
||||||||||||||||||||||||||||||||||||||
| 18.1.5. Data source and variables used for derivation and weighting | ||||||||||||||||||||||||||||||||||||||
|
||||||||||||||||||||||||||||||||||||||
| 18.2. Frequency of data collection | ||||||||||||||||||||||||||||||||||||||
According to the Commission Regulation (UE) 995/2012, the innovation statistics shall be provided to Eurostat every two years in each even year t+18. |
||||||||||||||||||||||||||||||||||||||
| 18.3. Data collection | ||||||||||||||||||||||||||||||||||||||
See below: |
||||||||||||||||||||||||||||||||||||||
| 18.3.1. Survey participation | ||||||||||||||||||||||||||||||||||||||
It is a mandatory survey included in the National Statistical Programme that regulates the production of official statistical information. |
||||||||||||||||||||||||||||||||||||||
| 18.3.2. Survey type | ||||||||||||||||||||||||||||||||||||||
It is a combination of sample and census survey. |
||||||||||||||||||||||||||||||||||||||
| 18.3.3. Combination of sample survey and census data | ||||||||||||||||||||||||||||||||||||||
The census refers to the enterprises with 250 + persons employed. For the rest of population, a stratified random sample has been built. |
||||||||||||||||||||||||||||||||||||||
| 18.3.4. Census criteria | ||||||||||||||||||||||||||||||||||||||
The census refers to the enterprises with 250 + persons employed. For the rest of population, a stratified random sample has been built. |
||||||||||||||||||||||||||||||||||||||
| 18.3.5. Data collection method | ||||||||||||||||||||||||||||||||||||||
Data collection method
|
||||||||||||||||||||||||||||||||||||||
| 18.4. Data validation | ||||||||||||||||||||||||||||||||||||||
Not requested. |
||||||||||||||||||||||||||||||||||||||
| 18.5. Data compilation | ||||||||||||||||||||||||||||||||||||||
Operations performed on data to derive new information according to a given set of rules. |
||||||||||||||||||||||||||||||||||||||
| 18.5.1. Imputation - rate | ||||||||||||||||||||||||||||||||||||||
Imputation is the method of creating plausible (but artificial) substitute values for all those missing. Definition of imputation rate: Imputation rate (for the variable x) (%) = 100*(Number of replaced values) / (Total number of values for a given variable) Definition of weighted imputation rate: Weighted imputation rate= 100*(Number of total weighted replaced values) / (Total number of weighted values for a given variable) |
||||||||||||||||||||||||||||||||||||||
| 18.5.1.1. Imputation rate for metric variables | ||||||||||||||||||||||||||||||||||||||
Imputation rate for metric variables by NACE categories and for enterprises with 10 or more persons employed:
(1) = Total turnover in the last year of the reference period (t) (TUR) (2) = Share of the turnover in the last year of the reference period (t) due to new or improved product new to the market in the total turnover for product innovative enterprises TUR_PRD_NEW_MKT/TUR(INNO_PRD) (3) = R&D expenditure performed in-house (EXP_INNO_RND_IH) |
||||||||||||||||||||||||||||||||||||||
| 18.5.2. Weights calculation | ||||||||||||||||||||||||||||||||||||||
Weights calculation method for sample surveys
|
||||||||||||||||||||||||||||||||||||||
| 18.6. Adjustment | ||||||||||||||||||||||||||||||||||||||
Calibration estimators methodology, currently applied at Istat, was used for the estimation process [Deville, J.C. and Srndal, C.E. (1992) Calibration estimators in survey sampling, Journal of the American Statistical Association 87, 367.382]. It can be applied to the extent that the known totals of some auxiliary variables, strictly correlated to the variables of interest, are available. These calibration estimators have the following properties: they are more efficient than the direct estimators because of the auxiliary information used; they reduce the bias effect due to the non-response and the under coverage; they produce estimates of auxiliary variables that equal the known totals of such variables. |
||||||||||||||||||||||||||||||||||||||
| 18.6.1. Seasonal adjustment | ||||||||||||||||||||||||||||||||||||||
Not requested. |
||||||||||||||||||||||||||||||||||||||
|
|||
|
|||
|
|||
| Italian questionnaire |
|||