|
 |
| For any question on data and metadata, please contact: Eurostat user support |
|
|||
| 1.1. Contact organisation | Hungarian Central Statistical Office |
||
| 1.2. Contact organisation unit | Business Statistics Department; Internal Trade, Research and Development Statistics Section |
||
| 1.5. Contact mail address | H-1024 Budapest, Keleti Károly street 5–7. |
||
|
|||
| 2.1. Metadata last certified | 30/05/2024 | ||
| 2.2. Metadata last posted | 30/05/2024 | ||
| 2.3. Metadata last update | 30/05/2024 | ||
|
||||||||||||||||||||||||||||||||||||||||||||||||||||
| 3.1. Data description | ||||||||||||||||||||||||||||||||||||||||||||||||||||
The Community Innovation Survey (CIS) is a survey about innovation activities in enterprises. The survey is designed to collect the information on types of innovation, processes of development of innovation like cooperation patterns, financing and expenditure, objectives of innovation activities or barriers for initiating or implementing innovation. The CIS provides statistics by type of innovators, economic activity and size class of enterprises. The survey is currently carried out every two years across the EU Member States, EFTA countries and EU candidate countries.
In order to ensure comparability across countries, Eurostat together with the countries develops a Harmonised Data Collection (HDC) questionnaire and drafts the methodological recommendations for implementation of each survey round.
CIS 2020 is a second in a row to implement concepts and methodology of the Oslo Manual 4th Edition revised in 2018. The changes in the CIS driven by the revision of the manual and their impact on collected indicators are described in the Statistics Explained article: Community Innovation Survey – new features.
The legal framework for CIS since 2012 is the Commission Regulation No 995/2012 that establishes the quality conditions for the data collection and transmission and identifies the obligatory cross-coverage of economic sectors, size class of enterprises and innovation indicators. The target population are enterprises with at least 10 employees classified in the core NACE economic sectors (see 3.3). Further activities may be covered on a voluntary basis in national datasets. Most statistics are based on the 3-year reference period (t, t-1, t-2), but some use only one calendar year (t or t-2). Please refer to the Annex section of the European metadata (ESMS) for details of the time coverage of collected indicators. |
||||||||||||||||||||||||||||||||||||||||||||||||||||
| 3.2. Classification system | ||||||||||||||||||||||||||||||||||||||||||||||||||||
Indicators related to the enterprises are classified by country, economic activity (NACE Rev. 2), size class of enterprises and type of innovation.
The main typology of classification of enterprises in reference to innovation is the distinction between innovation-active enterprises (INN) and not innovation-active enterprises (NINN). The enterprise is considered as innovative (INN) if during the reference period it successfully introduced a a) product or a) business process innovation, c) completed but not yet implemented the innovation, d) had ongoing innovation activities, e) abandoned innovation activities or was f) engaged in in-house R&D or R&D contracted out. Non-innovative (NINN) enterprises had no innovation activity mentioned above whatsoever during the reference period. |
||||||||||||||||||||||||||||||||||||||||||||||||||||
| 3.3. Coverage - sector | ||||||||||||||||||||||||||||||||||||||||||||||||||||
CIS covers main economic sectors according to NACE Rev.2 broken down by size class of enterprises and type of innovation activity. |
||||||||||||||||||||||||||||||||||||||||||||||||||||
| 3.3.1. Main economic sectors covered - NACE Rev.2 | ||||||||||||||||||||||||||||||||||||||||||||||||||||
In accordance with Commission Regulation 995/2012 on innovation statistics, the following industries and services are included in the core target population. Results are made available with these following breakdowns : All NACE – Core NACE (NACE Rev. 2 sections & divisions B-C-D-E-46-H-J-K-71-72-73 )
CORE INDUSTRY (excluding construction) (NACE Rev. 2 SECTIONS B_C_D_E) 10-12: Manufacture of food products, beverages and tobacco 13-15: Manufacture of textiles, wearing apparel, leather and related products 16-18: Manufacture of wood, paper, printing and reproduction 20: Manufacture of chemicals and chemical products 21: Manufacture of basic pharmaceutical products and pharmaceutical preparations 19-22: Manufacture of petroleum, chemical, pharmaceutical, rubber and plastic products 23: Manufacture of other non-metallic mineral products 24: Manufacture of basic metals 25: Manufacture of fabricated metal products, except machinery and equipment 26: Manufacture of computer, electronic and optical products 25-30: Manufacture of fabricated metal products (except machinery and equipment), computer, electronic and optical products, electrical equipment, motor vehicles and other transport equipment 31-33: Manufacture of furniture; jewellery, musical instruments, toys; repair and installation of machinery and equipment
D: ELECTRICITY, GAS, STEAM AND AIR CONDITIONING SUPPLY
E: WATER SUPPLY; SEWERAGE, WASTE MANAGEMENT AND REMEDIATION ACTIVITIES 36: Water collection, treatment and supply 37-39: Sewerage, waste management, remediation activities
CORE SERVICES (NACE Rev. 2 sections & divisions 46-H-J-K-71-72-73)(NACE code in the tables = G46-M73_INN) 46: Wholesale trade, except of motor vehicles and motorcycles
H: TRANSPORTATION AND STORAGE 49-51: Land transport and transport via pipelines, water transport and air transport 52-53: Warehousing and support activities for transportation and postal and courier activities
J: INFORMATION AND COMMUNICATION 58: Publishing activities 61: Telecommunications 62: Computer programming, consultancy and related activities 63: Information service activities
K: FINANCIAL AND INSURANCE ACTIVITIES 64: Financial service activities, except insurance and pension funding 65: Insurance, reinsurance and pension funding, except compulsory social security 66: Activities auxiliary to financial services and insurance activities
M: PROFESSIONAL, SCIENTIFIC AND TECHNICAL ACTIVITIES 71: Architectural and engineering activities; technical testing and analysis 72: Scientific research and development 73: Advertising and market research 71-73: Architectural and engineering activities; technical testing and analysis; Scientific research and development; Advertising and market research |
||||||||||||||||||||||||||||||||||||||||||||||||||||
| 3.3.1.1. Main economic sectors covered - NACE Rev.2 - national particularities | ||||||||||||||||||||||||||||||||||||||||||||||||||||
No deviation |
||||||||||||||||||||||||||||||||||||||||||||||||||||
| 3.3.2. Sector coverage - size class | ||||||||||||||||||||||||||||||||||||||||||||||||||||
In accordance with Commission Regulation 995/2012 on innovation statistics, the following size classes of enterprises according to number of employees are included in the core target population of the CIS:
|
||||||||||||||||||||||||||||||||||||||||||||||||||||
| 3.3.2.1. Sector coverage - size class - national particularities | ||||||||||||||||||||||||||||||||||||||||||||||||||||
No deviation |
||||||||||||||||||||||||||||||||||||||||||||||||||||
| 3.4. Statistical concepts and definitions | ||||||||||||||||||||||||||||||||||||||||||||||||||||
The description of concepts, definitions and main statistical variables is available in CIS 2020 European metadata file (ESMS) Results of the community innovation survey 2020 (CIS2020) (inn_cis12) in Eurostat database. |
||||||||||||||||||||||||||||||||||||||||||||||||||||
| 3.5. Statistical unit | ||||||||||||||||||||||||||||||||||||||||||||||||||||
Enterprise |
||||||||||||||||||||||||||||||||||||||||||||||||||||
| 3.6. Statistical population | ||||||||||||||||||||||||||||||||||||||||||||||||||||
Core target population are all enterprises in CORE NACE activities (see 3.3.1) with 10 or more employees. |
||||||||||||||||||||||||||||||||||||||||||||||||||||
| 3.7. Reference area | ||||||||||||||||||||||||||||||||||||||||||||||||||||
Territory of Hungary. Data is available at NUTS2 level. |
||||||||||||||||||||||||||||||||||||||||||||||||||||
| 3.8. Coverage - Time | ||||||||||||||||||||||||||||||||||||||||||||||||||||
Several rounds of Community Innovation Survey have been conducted so far at two-year interval since end of 90’s. |
||||||||||||||||||||||||||||||||||||||||||||||||||||
| 3.8.1. Participation in the CIS waves | ||||||||||||||||||||||||||||||||||||||||||||||||||||
*two reference periods can be distinguished for CIS light: 2000-2002 and 2001-2003 |
||||||||||||||||||||||||||||||||||||||||||||||||||||
| 3.9. Base period | ||||||||||||||||||||||||||||||||||||||||||||||||||||
Not relevant. |
||||||||||||||||||||||||||||||||||||||||||||||||||||
|
|||
CIS indicators are available according to 3 units of measure:
NR: Number for number of enterprises and number of persons employed. THS_EUR: Thousands of euros. All financial variables are provided in thousands of euros, i.e. Turnover or Innovation expenditure. PC: Percentage. The percentage is the ratio between the selected combinations of indicators. |
|||
|
|||
For CIS 2020, the time covered by the survey is the 3-year period from the beginning of 2018 to the end of 2020. Some questions and indicators refer to one year — 2020. The list of indicators covering the 3-year period and referring to one year according to the HDC is available in the Annex section of the European metadata (ESMS). |
|||
|
|||
| 6.1. Institutional Mandate - legal acts and other agreements | |||
CIS surveys are based on the Commission Regulation No 995/2012, implementing Decision No 1608/2003/EC of the European Parliament and of the Council on the production and development of Community statistics on science and technology. This Regulation establishes innovation statistics on a statutory basis and makes the delivery of certain variables compulsory e.g. innovation activities, cooperation, development, expenditures and turnover (see the Regulation). Each survey wave may additionally include further variables. In addition, the Regulation defines the obligatory cross-coverage of economic sectors and size class of enterprises. |
|||
| 6.1.1. National legislation | |||
Data collection was carried out according to the national Government Decree on The National Statistical Data Collection Programme enacting the surveys of the reference period, and in line with the Act CLV of 2016 on Official Statistics. According to the national legislation, CIS is a mandatory survey. |
|||
| 6.2. Institutional Mandate - data sharing | |||
Not requested. |
|||
|
|||
CIS data are transmitted to Eurostat via EDAMIS using the secured transmission system. |
|||
| 7.1. Confidentiality - policy | |||
Legislation and policy at national level:
HCSO ensures confidentiality for all the data reported by data providers and the exclusive use of the data for statistical purposes. We disseminate only aggregated data in full compliance with the rules of confidentiality. Individual data, as well as aggregated data consisting of fewer than 3 enterprises are regarded as confidential. Researchers have access to de-identified data sets and to anonymised micro data for scientific purposes with appropriate legal and methodological guaranties in place. As for the employees, they can work with datasets in their competence with registered and controlled access rights. |
|||
| 7.2. Confidentiality - data treatment | |||
According to Hungarian Act on Statistics those aggregates which come from less than 3 data providers are deemed to be confidential. To publish these values we need a permission from each affected data provider. |
|||
|
|||
| 8.1. Release calendar | |||
There is a release policy in place for the CIS data set. The release calendar is publicly available on the website. |
|||
| 8.2. Release calendar access | |||
HCSO's publication and revision calendar is publicly available on the website: |
|||
| 8.3. Release policy - user access | |||
Data is disseminated to the public according to the release policy and release calendar. At t+M16, some key, preliminary results are published in the online summary tables. Dissemination of the final data in the database and as part of the online publication is coordinated and takes place between t+M18-M22. |
|||
|
|||
CIS is conducted and disseminated at two-year interval in pair years. |
|||
|
|||||||||||||||
Accessibility and clarity refer to the simplicity and ease for users to access statistics using simple and user-friendly procedure, obtaining them in an expected form and within an acceptable time period, with the appropriate user information and assistance: a global context which finally enables them to make optimum use of the statistics. |
|||||||||||||||
| 10.1. Dissemination format - News release | |||||||||||||||
See below. |
|||||||||||||||
| 10.1.1. Availability of the releases | |||||||||||||||
|
|||||||||||||||
| 10.2. Dissemination format - Publications | |||||||||||||||
- Online database (containing all/most results) : Yes. The online 'dissemaniation database' includes key results and is accessible to the public. Online summary table sets (STADAT) are also published on some key results. Both publications are accessible on HCSO's website, in English and in the national language. http://statinfo.ksh.hu/Statinfo/themeSelector.jsp?&lang=en - Analytical publication (referring to all/most results) : Yes, an online publication with most results is published. It is posted on the website, and is available in the national language. - Analytical publication (referring to specific results, e.g. only for one sector or one specific aspect) : No. |
|||||||||||||||
| 10.3. Dissemination format - online database | |||||||||||||||
The dissemination database is accessible at: http://statinfo.ksh.hu/Statinfo/themeSelector.jsp?&lang=en |
|||||||||||||||
| 10.3.1. Data tables - consultations | |||||||||||||||
Not requested. |
|||||||||||||||
| 10.4. Dissemination format - microdata access | |||||||||||||||
In order to support scientific research, HCSO opens up data files for accredited researchers. CIS microdata is disseminated at HCSO' Safe Center. Several channels of Data access are offered for scientific purposes: Access to anonymised microdata sets; Safe Centre access; Remote access. |
|||||||||||||||
| 10.4.1. Dissemination of microdata | |||||||||||||||
|
|||||||||||||||
| 10.5. Dissemination format - other | |||||||||||||||
No other means of dissemination. |
|||||||||||||||
| 10.5.1. Metadata - consultations | |||||||||||||||
Not requested. |
|||||||||||||||
| 10.6. Documentation on methodology | |||||||||||||||
Each publication contains the main definition and concepts of CIS. Detailed CIS metadata are available on the website of Hungarian Central Statistical Office. |
|||||||||||||||
| 10.6.1. Metadata completeness - rate | |||||||||||||||
Not requested. |
|||||||||||||||
| 10.7. Quality management - documentation | |||||||||||||||
User-oriented quality reports on statistical domains are prepared in the framework of methodological documentation and are published as metainformation on the HCSO website: http://www.ksh.hu/apps/meta.main?p_lang=EN. The quality report on innovations statistics domain has been updated and is in line with the CIS 2020 Harmonised Questionnaire and the OM4. An updated Methodological Guideline on innovation statistics was compiled in Hungarian to support the interpretation of CIS 2020 data by the data users. The Guidelines incorporate key methodological principles of OM4, new concepts, definitions and explanatory notes. This document is available on HCSO’s website and accessible for the public along with the metadata information of the innovation statistics (http://www.ksh.hu/docs/eng/modsz/modsz34.html). Special focus was paid to provide guidelines on the limitations and scope of comparability of new data with datasets before CIS2018. |
|||||||||||||||
|
|||
| 11.1. Quality assurance | |||
The HCSO Quality Policy lays out the principles and commitments related to the quality of statistics. The document is consistent with the goals set out in the Mission and Vision statements and with the principles of the European Statistics Code of Practice and is publicly available on the HCSO website. The European Statistics Code of Practice is available on the website of the HCSO. Also, HCSO together with the member-organisations of the Hungarian Official Statistical Service created a National Statistics Code of Practice based on the European Statistics Code of Practice. Quality Guidelines are meant to ensure the quality of the statistical processes. The document has been in place since 2007 (1st revision in 2009, 2nd revision in 2014). The latest version (2015) is available on the HCSO website. At HCSO, special attention is given to quality measurement, monitoring and documentation. Procedures are in place in order to ensure updated documentation on product quality. An internal quality report is prepared by HCSO, and a quality report is provided to Eurostat as well. All statistical processes of the national CIS 2020 survey were carried out in accordance with HCSO’s Quality Policy, Quality Guidelines and in line with the National Statistics Code of Practice that is consistent with the principles of the European Statistics Code of Practice. In the innovation data collection, principles relevant for the institutional environment, the statistical procedures and statistical output were observed. |
|||
| 11.2. Quality management - assessment | |||
The methodology recommended by Eurostat was fully adopted and experiences of the previous rounds of the national innovation data collections were taken into account. An updated metadata that is in line with the OM4 and the HQ were recorded in HCSO’s Metadata System for the national CIS 2020 data collection that provided a solid methodological basis for all the statistical processes carried out. The statistical processes and activities were supported by HCSO’s main, integrated, metadata-driven IT systems that are in line with the statistical planning and development conventions. Statistical processes of CIS 2020 data collection were monitored based on quality indicators built into these IT systems (Integrated Survey Control System for Business and Social Surveys, Integrated Electronic Data Collection System, Integrated Data Processing System, Data Entry and Validation System). Main strengths: Electronic data collection. High unit response rate (89,14%). Good quality for all variables were achieved by implementing a complex and consistent set of validation rules. Quality checks of interval level data were conducted for selected variables and data were confronted with other data sources, i.e. R&D survey data and SBS data. Regional level data are available. Main weaknesses: |
|||
|
|||||||||||||||
Relevance is the degree to which statistics meet current and potential users needs. It includes the production of all needed statistics and the extent to which concepts used (definitions, classifications etc.) reflect user needs. The aim is to describe the extent to which the statistics are useful to, and used by, the broadest array of users. For this purpose, statisticians need to compile information, firstly about their users and their needs. The CIS is based on a common questionnaire and a common survey methodology, as laid down in the 4th edition of Oslo Manual (2018 edition), in order to achieve comparable, harmonised and high quality results for EU Member States, EFTA countries, Candidates and Associated countries. |
|||||||||||||||
| 12.1. Relevance - User Needs | |||||||||||||||
The concepts and methods are based on European legislation. The main international users are the Eurostat and the OECD. The principal domestic users are the Ministries (e.g. Ministry of Culture and Innovation), the National Research, Development and Innovations Office, the universities and other research centers. |
|||||||||||||||
| 12.1.1. Needs at national level | |||||||||||||||
The national innovation data collection is fully guided by the CIS Harmonised Data Collection. There is a regular consultation on survey questions and on the produced innovation data with data users at the national policy making bodies (e.g. Ministry of Culture and Innovation, the National Research, Development and Innovations Office), so the collection of data that are key for the monitoring of the national R&D&I strategies are also prioritized. |
|||||||||||||||
| 12.2. Relevance - User Satisfaction | |||||||||||||||
National user satisfaction survey has not been carried out. |
|||||||||||||||
| 12.3. Completeness | |||||||||||||||
Data for all the obligatory and optional variables were collected and are available in CIS2020. |
|||||||||||||||
| 12.3.1. Data completeness - rate | |||||||||||||||
Not requested. |
|||||||||||||||
|
||||||||||||||||||||
| 13.1. Accuracy - overall | ||||||||||||||||||||
Accuracy in the statistical sense denotes the closeness of computations or estimates to the exact or true values. Statistics are not equal with the true values because of variability (the statistics change from implementation to implementation of the survey due to random effects) and bias (the average of the possible values of the statistics from implementation to implementation is not equal to the true value due to systematic effects). |
||||||||||||||||||||
| 13.2. Sampling error | ||||||||||||||||||||
That part of the difference between a population value and an estimate thereof, derived from a random sample, which is due to the fact that only a subset of the population is enumerated. |
||||||||||||||||||||
| 13.2.1. Sampling error - indicators | ||||||||||||||||||||
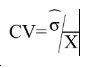
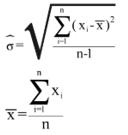
The main indicator used to measure sampling errors for CIS data is the coefficient of variation (CV).
Coefficient of Variation= (Square root of the estimate of the sampling variance) / (Estimated value) Formula: where
|
||||||||||||||||||||
| 13.2.1.1. Coefficient of variations for key variables | ||||||||||||||||||||
Coefficient of variation (%) for key variables by NACE categories and for enterprises with 10 and more employees
[1] = Coefficient of variation for the percentage of innovative enterprises (INN) in the total population of enterprises (ENT20) |
||||||||||||||||||||
| 13.2.1.2. Variance estimation method | ||||||||||||||||||||
The sample design and weighting have been taken into account, no deviation from method described in CIS documents. |
||||||||||||||||||||
| 13.3. Non-sampling error | ||||||||||||||||||||
Non-sampling errors occur in all phases of a survey. They add to the sampling errors (if present) and contribute to decreasing overall accuracy. It is important to assess their relative weight in the total error and devote appropriate resources for their control and assessment. |
||||||||||||||||||||
| 13.3.1. Coverage error | ||||||||||||||||||||
Coverage errors (or frame errors) are due to divergences between the target population and the frame population. The frame population is the set of target population members that has a chance to be selected into the survey sample. It is a listing of all items in the population from which the sample is drawn that contains contact details as well as sufficient information to perform stratification and sampling. |
||||||||||||||||||||
| 13.3.1.1. Over-coverage - rate | ||||||||||||||||||||
Not requested. |
||||||||||||||||||||
| 13.3.1.2. Common units - proportion | ||||||||||||||||||||
Not requested. |
||||||||||||||||||||
| 13.3.1.3. Under covered groups of the target population | ||||||||||||||||||||
We have no information on undercoverage. |
||||||||||||||||||||
| 13.3.1.4. Coverage errors in coefficient variation | ||||||||||||||||||||
Yes, CVs contain the effects of coverage errors |
||||||||||||||||||||
| 13.3.2. Measurement error | ||||||||||||||||||||
Measurement errors occur during data collection and generate bias by recording values different than the true ones. The survey questionnaire used for data collection may have led to the recording of wrong values, or there may be respondent or interviewer bias. |
||||||||||||||||||||
| 13.3.2.1. Measures for reducing measurement errors | ||||||||||||||||||||
CIS data collection was conducted in line with HCSO's Quality Managament system in order to minimize measurement errors. An interactive data validation procedure also took place in the online data collection system, including warnings and error messages, in order to block submission of data with significant errors, and to prevent inconsistencies. |
||||||||||||||||||||
| 13.3.3. Non response error | ||||||||||||||||||||
Non response occurs when a survey fails to collect data on all survey variables from all the population units designated for data collection in a sample or complete enumeration. There are two types of non-response: 1) Unit non-response, which occurs when no data (or so little as to be unusable) are collected about a population unit designated for data collection. a) Un-weighted unit non-response rate (%) = 100*(Number of units with no response or not usable response) / (Total number of in-scope (eligible) units in the sample) b) Weighted unit non-response rate (%) = 100*(Number of weighted units with no response or not usable response) / (Total number of in-scope (eligible) units in the sample) 2) Item non-response, which occurs when only data on some, but not all survey data items are collected about a population unit designated for data collection. a) Un-weighted item non-response rate (%) = 100*(Number of units with no response at all for the item) / (Total number of eligible, for the item, units in the sample i.e. filters have to be taken into account) |
||||||||||||||||||||
| 13.3.3.1. Unit non-response - rate | ||||||||||||||||||||
See below. |
||||||||||||||||||||
| 13.3.3.1.1. Un-weighted and weighted unit non-response rate by NACE categories and for enterprises with 10 or more employees | ||||||||||||||||||||
Un-weighted and weighted unit non-response rate by NACE categories and for enterprises with 10 or more employees
The number of eligible units is the number of sample units, which indeed belong to the target population. |
||||||||||||||||||||
| 13.3.3.1.2. Maximum number of recalls/reminders before coding | ||||||||||||||||||||
One week before the questionnaire deadline, non-respondents who provided their e-mail address to the Statistical Office got a reminding letter. The second reminding e-mail was sent to them 4 days after the deadline and a third one one week after that. Those who still sent no response got a reminder letter by post. Those enterprises which did not provide their e-mail address got one or two postal reminder letters. In case of non-response, telephone calls followed these letters (minimum 1 per non-respondent, but in most cases more attempts were made). |
||||||||||||||||||||
| 13.3.3.2. Item non-response - rate | ||||||||||||||||||||
See below. |
||||||||||||||||||||
| 13.3.3.2.1. Item non-response rate for Turnover (in Core NACE: B-C-D-E-46-H-J-K-71-72-73 enterprises with 10 or more employees) | ||||||||||||||||||||
Item non-response rate for Turnover (in Core NACE: B-C-D-E-46-H-J-K-71-72-73 enterprises with 10 or more employees).
|
||||||||||||||||||||
| 13.3.3.2.2. Item non response rate for new questions | ||||||||||||||||||||
Item non-response rate for new questions in CIS t (in Core NACE: B-C-D-E-46-H-J-K-71-72-73 enterprises with 10 or more employees)
|
||||||||||||||||||||
| 13.3.4. Processing error | ||||||||||||||||||||
We use online questionnaire, no significant processing error occured. |
||||||||||||||||||||
| 13.3.5. Model assumption error | ||||||||||||||||||||
Not requested. |
||||||||||||||||||||
|
|||
Timeliness and punctuality refer to time and dates, but in a different manner. |
|||
| 14.1. Timeliness | |||
The timeliness of statistics reflects the length of time between data availability and the event or phenomenon they describe. |
|||
| 14.1.1. Time lag - first result | |||
Timeliness of national data – date of first release of national level: April 30, 2022 (t+M16) - only for some key results June 30, 2022 (t+M18) - release of final data
|
|||
| 14.1.2. Time lag - final result | |||
Not requested. |
|||
| 14.2. Punctuality | |||
Punctuality refers to the time lag between the release date of data and the target date on which they were scheduled for release as announced officially. |
|||
| 14.2.1. Punctuality - delivery and publication | |||
Date of transmission of complete and validated data to Eurostat (Number of days between that data and 30 June 2022) : -9 |
|||
|
||||||||||||||||||||
Comparability aims at measuring the impact of differences in applied statistical concepts and definitions on the comparison of statistics between geographical areas, non-geographical domains, or over time. The coherence of statistical outputs refers to the degree to which the statistical processes by which they were generated used the same concepts (classifications, definitions, and target populations) and harmonised methods. Coherent statistical outputs have the potential to be validly combined and used jointly. |
||||||||||||||||||||
| 15.1. Comparability - geographical | ||||||||||||||||||||
There is one, unified national data collection on innovation in Hungary, therefore there is no comparability issue for the innovation data between the regions within the country. The Hungarian CIS questionnaire was the exact translation of Eurostat's CIS Harmonized Questionnaire, no question was omitted, the international standards, concepts and definitions of OM4 (2018) and the Eurostat Guidelines were followed and implemented in the data collection. Therefore the Hungarian CIS data collection is fully comparable with the CIS Harmonized Data Collection, there is no methodological deviation or comparability issue. |
||||||||||||||||||||
| 15.1.1. Asymmetry for mirror flow statistics - coefficient | ||||||||||||||||||||
Not requested. |
||||||||||||||||||||
| 15.1.2. National questionnaire – compliance with Eurostat model questionnaire | ||||||||||||||||||||
Methodological deviations from the CIS Harmonised Data Collection (HDC)
|
||||||||||||||||||||
| 15.1.3. National questionnaire – additional questions | ||||||||||||||||||||
Methodological deviations from the CIS Harmonised Data Collection (HDC)
|
||||||||||||||||||||
| 15.2. Comparability - over time | ||||||||||||||||||||
Due to important methodological changes driven by Oslo Manual 2018, CIS 2018 and CIS 2020 cannot be directly compared with previous CIS waves. |
||||||||||||||||||||
| 15.2.1. Length of comparable time series | ||||||||||||||||||||
Not requested. |
||||||||||||||||||||
| 15.3. Coherence - cross domain | ||||||||||||||||||||
See the comparison between SBS and CIS data in the section 15.3.3 below. |
||||||||||||||||||||
| 15.3.1. Coherence - sub annual and annual statistics | ||||||||||||||||||||
Not requested. |
||||||||||||||||||||
| 15.3.2. Coherence - National Accounts | ||||||||||||||||||||
Not requested. |
||||||||||||||||||||
| 15.3.3. Coherence – Structural Business Statistics (SBS) | ||||||||||||||||||||
This part compares key variables for aggregated CIS data with SBS data
* Numbers are to be provided for the last year of the reference period (t) |
||||||||||||||||||||
| 15.4. Coherence - internal | ||||||||||||||||||||
Not requested. |
||||||||||||||||||||
|
|||
Confidential information on the production cost of the CIS. |
|||
|
|||
| 17.1. Data revision - policy | |||
Not requested. |
|||
| 17.2. Data revision - practice | |||
Not requested. |
|||
| 17.2.1. Data revision - average size | |||
Not requested. |
|||
|
||||||||||||||||||||||||||||||||||||||
| 18.1. Source data | ||||||||||||||||||||||||||||||||||||||
See below. |
||||||||||||||||||||||||||||||||||||||
| 18.1.1. Sampling frame (or census frame) | ||||||||||||||||||||||||||||||||||||||
The National Business Register was used as a sampling frame. |
||||||||||||||||||||||||||||||||||||||
| 18.1.2. Sampling design | ||||||||||||||||||||||||||||||||||||||
A stratified sample was selected. The stratification variables were:
The number of strata with enterprises was 1766, out of which there were 843 strata with 100% sampling rate. |
||||||||||||||||||||||||||||||||||||||
| 18.1.3. Target population and sample size | ||||||||||||||||||||||||||||||||||||||
|
||||||||||||||||||||||||||||||||||||||
| 18.1.4. Data source for pre-filled variables | ||||||||||||||||||||||||||||||||||||||
Variables and indicators filled or prefilled from other sources.
|
||||||||||||||||||||||||||||||||||||||
| 18.1.5. Data source and variables used for derivation and weighting | ||||||||||||||||||||||||||||||||||||||
|
||||||||||||||||||||||||||||||||||||||
| 18.2. Frequency of data collection | ||||||||||||||||||||||||||||||||||||||
According to the Commission Regulation (UE) 995/2012, the innovation statistics shall be provided to Eurostat every two years in each even year t+18. |
||||||||||||||||||||||||||||||||||||||
| 18.3. Data collection | ||||||||||||||||||||||||||||||||||||||
Combined type survey. |
||||||||||||||||||||||||||||||||||||||
| 18.3.1. Survey participation | ||||||||||||||||||||||||||||||||||||||
According to Hungarian regulation CIS survey in Hungary is mandatory. |
||||||||||||||||||||||||||||||||||||||
| 18.3.2. Survey type | ||||||||||||||||||||||||||||||||||||||
Data are collected through combination of census and sample survey. |
||||||||||||||||||||||||||||||||||||||
| 18.3.3. Combination of sample survey and census data | ||||||||||||||||||||||||||||||||||||||
Enterprises with at least 100 employees are covered by census, and enterprises with less than 100 employees are covered by sampling. |
||||||||||||||||||||||||||||||||||||||
| 18.3.4. Census criteria | ||||||||||||||||||||||||||||||||||||||
Number of employees >99 |
||||||||||||||||||||||||||||||||||||||
| 18.3.5. Data collection method | ||||||||||||||||||||||||||||||||||||||
Data collection method
|
||||||||||||||||||||||||||||||||||||||
| 18.4. Data validation | ||||||||||||||||||||||||||||||||||||||
Not requested. |
||||||||||||||||||||||||||||||||||||||
| 18.5. Data compilation | ||||||||||||||||||||||||||||||||||||||
Operations performed on data to derive new information according to a given set of rules. |
||||||||||||||||||||||||||||||||||||||
| 18.5.1. Imputation - rate | ||||||||||||||||||||||||||||||||||||||
Imputation is the method of creating plausible (but artificial) substitute values for all those missing. Definition of imputation rate: Imputation rate (for the variable x) (%) = 100*(Number of replaced values) / (Total number of values for a given variable) Definition of weighted imputation rate: Weighted imputation rate= 100*(Number of total weighted replaced values) / (Total number of weighted values for a given variable) |
||||||||||||||||||||||||||||||||||||||
| 18.5.1.1. Imputation rate for metric variables | ||||||||||||||||||||||||||||||||||||||
Imputation rate for metric variables by NACE categories and for enterprises with 10 or more employees: No imputation.
(1) = Total turnover in the last year of the reference period (t) (TUR) (2) = Share of the turnover in the last year of the reference period (t) due to new or improved product new to the market in the total turnover for product innovative enterprises TUR_PRD_NEW_MKT/TUR(INNO_PRD) (3) = R&D expenditure performed in-house (EXP_INNO_RND_IH) |
||||||||||||||||||||||||||||||||||||||
| 18.5.2. Weights calculation | ||||||||||||||||||||||||||||||||||||||
Weights calculation method for sample surveys
|
||||||||||||||||||||||||||||||||||||||
| 18.6. Adjustment | ||||||||||||||||||||||||||||||||||||||
No calibration was made. |
||||||||||||||||||||||||||||||||||||||
| 18.6.1. Seasonal adjustment | ||||||||||||||||||||||||||||||||||||||
Not requested. |
||||||||||||||||||||||||||||||||||||||
|
|||
|
|||
|
|||