|
 |
| For any question on data and metadata, please contact: Eurostat user support |
|
|||
| 1.1. Contact organisation | Statistics Denmark |
||
| 1.2. Contact organisation unit | Science, Technology and Culture |
||
| 1.5. Contact mail address | Sejrgade 11, 2100 Kbenhavn, Denmark |
||
|
|||
| 2.1. Metadata last certified | 11/10/2022 | ||
| 2.2. Metadata last posted | 28/05/2024 | ||
| 2.3. Metadata last update | 28/05/2024 | ||
|
||||||||||||||||||||||||||||||||||||||||||||||||||||
| 3.1. Data description | ||||||||||||||||||||||||||||||||||||||||||||||||||||
The Community Innovation Survey (CIS) is a survey about innovation activities in enterprises. The survey is designed to collect the information on types of innovation, processes of development of innovation like cooperation patterns, expenditure, objectives of innovation activities or barriers for initiating or implementing innovation. The CIS provides statistics by type of innovators, economic activity and size class of enterprises. The survey is currently carried out every two years across the EU Member States, EFTA countries and EU candidate countries. In order to ensure comparability across countries, Eurostat together with the countries develops a Harmonised Data Collection (HDC) questionnaire and drafts the methodological recommendations for implementation of each survey round. CIS 2020 is a second in a row to implement concepts and methodology of the Oslo Manual 4th Edition revised in 2018. The changes in the CIS driven by the revision of the manual and their impact on collected indicators are described in the Statistics Explained article: Community Innovation Survey – new features. The legal framework for CIS since 2012 is the Commission Regulation No 995/2012 that establishes the quality conditions for the data collection and transmission and identifies the obligatory cross-coverage of economic sectors, size class of enterprises and innovation indicators. The target population are enterprises with at least 10 employees classified in the core NACE economic sectors (see 3.3). Further activities may be covered on a voluntary basis in national datasets. Most statistics are based on the 3-year reference period (t, t-1, t-2), but some use only one calendar year (t or t-2). Please refer to the Annex section of the European metadata (ESMS) for details of the time coverage of collected indicators. |
||||||||||||||||||||||||||||||||||||||||||||||||||||
| 3.2. Classification system | ||||||||||||||||||||||||||||||||||||||||||||||||||||
Indicators related to the enterprises are classified by country, economic activity (NACE Rev. 2), size class of enterprises and type of innovation. The main typology of classification of enterprises in reference to innovation is the distinction between innovation-active enterprises (INN) and not innovation-active enterprises (NINN). The enterprise is considered as innovative (INN) if during the reference period it successfully introduced a a) product or a) business process innovation, c) completed but not yet implemented the innovation, d) had ongoing innovation activities, e) abandoned innovation activities or was f) engaged in in-house R&D or R&D contracted out. Non-innovative (NINN) enterprises had no innovation activity mentioned above whatsoever during the reference period. |
||||||||||||||||||||||||||||||||||||||||||||||||||||
| 3.3. Coverage - sector | ||||||||||||||||||||||||||||||||||||||||||||||||||||
CIS covers main economic sectors according to NACE Rev.2 broken down by size class of enterprises and type of innovation activity. |
||||||||||||||||||||||||||||||||||||||||||||||||||||
| 3.3.1. Main economic sectors covered - NACE Rev.2 | ||||||||||||||||||||||||||||||||||||||||||||||||||||
In accordance with Commission Regulation 995/2012 on innovation statistics, the following industries and services are included in the core target population. Results are made available with these following breakdowns : All NACE – Core NACE (NACE Rev. 2 sections & divisions B-C-D-E-46-H-J-K-71-72-73 )
CORE INDUSTRY (excluding construction) (NACE Rev. 2 SECTIONS B_C_D_E) 10-12: Manufacture of food products, beverages and tobacco 13-15: Manufacture of textiles, wearing apparel, leather and related products 16-18: Manufacture of wood, paper, printing and reproduction 20: Manufacture of chemicals and chemical products 21: Manufacture of basic pharmaceutical products and pharmaceutical preparations 19-22: Manufacture of petroleum, chemical, pharmaceutical, rubber and plastic products 23: Manufacture of other non-metallic mineral products 24: Manufacture of basic metals 25: Manufacture of fabricated metal products, except machinery and equipment 26: Manufacture of computer, electronic and optical products 25-30: Manufacture of fabricated metal products (except machinery and equipment), computer, electronic and optical products, electrical equipment, motor vehicles and other transport equipment 31-33: Manufacture of furniture; jewellery, musical instruments, toys; repair and installation of machinery and equipment
D: ELECTRICITY, GAS, STEAM AND AIR CONDITIONING SUPPLY
E: WATER SUPPLY; SEWERAGE, WASTE MANAGEMENT AND REMEDIATION ACTIVITIES 36: Water collection, treatment and supply 37-39: Sewerage, waste management, remediation activities
CORE SERVICES (NACE Rev. 2 sections & divisions 46-H-J-K-71-72-73)(NACE code in the tables = G46-M73_INN) 46: Wholesale trade, except of motor vehicles and motorcycles
H: TRANSPORTATION AND STORAGE 49-51: Land transport and transport via pipelines, water transport and air transport 52-53: Warehousing and support activities for transportation and postal and courier activities
J: INFORMATION AND COMMUNICATION 58: Publishing activities 61: Telecommunications 62: Computer programming, consultancy and related activities 63: Information service activities
K: FINANCIAL AND INSURANCE ACTIVITIES 64: Financial service activities, except insurance and pension funding 65: Insurance, reinsurance and pension funding, except compulsory social security 66: Activities auxiliary to financial services and insurance activities
M: PROFESSIONAL, SCIENTIFIC AND TECHNICAL ACTIVITIES 71: Architectural and engineering activities; technical testing and analysis 72: Scientific research and development 73: Advertising and market research 71-73: Architectural and engineering activities; technical testing and analysis; Scientific research and development; Advertising and market research |
||||||||||||||||||||||||||||||||||||||||||||||||||||
| 3.3.1.1. Main economic sectors covered - NACE Rev.2 - national particularities | ||||||||||||||||||||||||||||||||||||||||||||||||||||
No deviation. Enterprises in the private business sector are covered. |
||||||||||||||||||||||||||||||||||||||||||||||||||||
| 3.3.2. Sector coverage - size class | ||||||||||||||||||||||||||||||||||||||||||||||||||||
In accordance with Commission Regulation 995/2012 on innovation statistics, the following size classes of enterprises according to number of employees are included in the core target population of the CIS:
|
||||||||||||||||||||||||||||||||||||||||||||||||||||
| 3.3.2.1. Sector coverage - size class - national particularities | ||||||||||||||||||||||||||||||||||||||||||||||||||||
Size class of enterprise, based on number of full-time equivalents by the following size classes:
|
||||||||||||||||||||||||||||||||||||||||||||||||||||
| 3.4. Statistical concepts and definitions | ||||||||||||||||||||||||||||||||||||||||||||||||||||
The description of concepts, definitions and main statistical variables is available in CIS 2020 European metadata file (ESMS) Results of the community innovation survey 2020 (CIS2020) (inn_cis12) in Eurostat database. |
||||||||||||||||||||||||||||||||||||||||||||||||||||
| 3.5. Statistical unit | ||||||||||||||||||||||||||||||||||||||||||||||||||||
Enterprises (economic units). |
||||||||||||||||||||||||||||||||||||||||||||||||||||
| 3.6. Statistical population | ||||||||||||||||||||||||||||||||||||||||||||||||||||
Core target population are all enterprises in CORE NACE activities (see 3.3.1) with 10 or more employees. |
||||||||||||||||||||||||||||||||||||||||||||||||||||
| 3.7. Reference area | ||||||||||||||||||||||||||||||||||||||||||||||||||||
Denmark The statistics are distributed by region. |
||||||||||||||||||||||||||||||||||||||||||||||||||||
| 3.8. Coverage - Time | ||||||||||||||||||||||||||||||||||||||||||||||||||||
Several rounds of Community Innovation Survey have been conducted so far at two-year interval since end of 90’s. |
||||||||||||||||||||||||||||||||||||||||||||||||||||
| 3.8.1. Participation in the CIS waves | ||||||||||||||||||||||||||||||||||||||||||||||||||||
*two reference periods can be distinguished for CIS light: 2000-2002 and 2001-2003 |
||||||||||||||||||||||||||||||||||||||||||||||||||||
| 3.9. Base period | ||||||||||||||||||||||||||||||||||||||||||||||||||||
Not relevant. |
||||||||||||||||||||||||||||||||||||||||||||||||||||
|
|||
CIS indicators are available according to 3 units of measure:
NR: Number for number of enterprises and number of persons employed. THS_EUR: Thousands of euros. All financial variables are provided in thousands of euros, i.e. Turnover or Innovation expenditure. PC: Percentage. The percentage is the ratio between the selected combinations of indicators. |
|||
|
|||
For CIS 2020, the time covered by the survey is the 3-year period from the beginning of 2018 to the end of 2020. Some questions and indicators refer to one year — 2020. The list of indicators covering the 3-year period and referring to one year according to the HDC is available in the Annex section of the European metadata (ESMS). |
|||
|
|||
| 6.1. Institutional Mandate - legal acts and other agreements | |||
CIS surveys are based on the Commission Regulation No 995/2012, implementing Decision No 1608/2003/EC of the European Parliament and of the Council on the production and development of Community statistics on science and technology. This Regulation establishes innovation statistics on a statutory basis and makes the delivery of certain variables compulsory e.g. innovation activities, cooperation, development, expenditures and turnover (see the Regulation). Each survey wave may additionally include further variables. In addition, the Regulation defines the obligatory cross-coverage of economic sectors and size class of enterprises. |
|||
| 6.1.1. National legislation | |||
Section 8 of the Act on Statistics Denmark (Consolidated act No 610 of 30 May 2018). Act on Statistics Denmark (Lov om Danmarks Statistik § 8, jf. Lovbekendtgørelse nr. 610 af 30. maj 2018) https://www.dst.dk/da/OmDS/lovgivning |
|||
| 6.2. Institutional Mandate - data sharing | |||
Not requested. |
|||
|
|||
CIS data are transmitted to Eurostat via EDAMIS using the secured transmission system. |
|||
| 7.1. Confidentiality - policy | |||
The description of Data confidentiality policy for Statistics Denmark is available in the annexed document. Annexes: Data Confidentiality Policy for Statistics Denmark |
|||
| 7.2. Confidentiality - data treatment | |||
Cells are flagged confidential if one or two enterprises dominate the strata. |
|||
|
|||
| 8.1. Release calendar | |||
Final data for CIS 2020 was published in December 2021. |
|||
| 8.2. Release calendar access | |||
Scheduled release calendar access via Statistics Denmarks web-side. Innovation in the business sector (2022) is planned to be published in December 2023. Annexes: Scheduled Releases from Statistics Denmark - Innovation by the business sector 2020 |
|||
| 8.3. Release policy - user access | |||
Innovation by the business sector is expected to be published app. 11 months after the end of the reference period. |
|||
|
|||
CIS is conducted and disseminated at two-year interval in pair years. |
|||
|
|||||||||||||||
Accessibility and clarity refer to the simplicity and ease for users to access statistics using simple and user-friendly procedure, obtaining them in an expected form and within an acceptable time period, with the appropriate user information and assistance: a global context which finally enables them to make optimum use of the statistics. |
|||||||||||||||
| 10.1. Dissemination format - News release | |||||||||||||||
See below. |
|||||||||||||||
| 10.1.1. Availability of the releases | |||||||||||||||
|
|||||||||||||||
| 10.2. Dissemination format - Publications | |||||||||||||||
- Online database (containing all/most results) : https://www.statbank.dk/10149 - Analytical publication (referring to all/most results) : - Analytical publication (referring to specific results, e.g. only for one sector or one specific aspect) : |
|||||||||||||||
| 10.3. Dissemination format - online database | |||||||||||||||
Business enterprise innovation is published in Statbank under Innovation and patents in the following tables:
Annexes: Enterprises innovation expenditure by industry and sizeclass, region and type of expenses Innovative enterprises by industry and sizeclass, region and type of innovation Product innovative enterprises by industry and sizeclass, region and product innovation type Procesinnovative enterprises by industry and sizeclass, region and proces innovation type Enterprises by industry and sizeclass, region and cooperation subject |
|||||||||||||||
| 10.3.1. Data tables - consultations | |||||||||||||||
Not requested. |
|||||||||||||||
| 10.4. Dissemination format - microdata access | |||||||||||||||
Data are stored electronically, and micro-data can be used for research purposes. Microdata containing more detailed tables than those published can be provided. |
|||||||||||||||
| 10.4.1. Dissemination of microdata | |||||||||||||||
|
|||||||||||||||
| 10.5. Dissemination format - other | |||||||||||||||
Tables are accessible on Eurostat and OECD's homepages and databases, through which international comparisons can be made. |
|||||||||||||||
| 10.5.1. Metadata - consultations | |||||||||||||||
Not requested. |
|||||||||||||||
| 10.6. Documentation on methodology | |||||||||||||||
Colectica Quality Statement. The statistics completely match the specifications of the EU-regulation and comes up to existing guidelines as the Oslo manual concerning statistics on innovation. Other documentation on methodology is only available in Danish. |
|||||||||||||||
| 10.6.1. Metadata completeness - rate | |||||||||||||||
Not requested. |
|||||||||||||||
| 10.7. Quality management - documentation | |||||||||||||||
Results from the quality evaluation of products and selected processes are available in detail for each statistics and in summary reports for the Working Group on Quality. |
|||||||||||||||
|
|||
| 11.1. Quality assurance | |||
Statistics Denmark follows the principles in the Code of Practice for European Statistics (CoP) and uses the Quality Assurance Framework of the European Statistical System (QAF) for the implementation of the principles. This involves continuous decentralized and central control of products and processes based on documentation following international standards. The central quality assurance function reports to the Working Group on Quality. Reports include suggestions for improvement that are assessed, decided and subsequently implemented. As part of the general quality control, a quality handbook has been published for the statistics on R&D and innovation. Annexes: Quality manual for the statistics on R&D and innovation. |
|||
| 11.2. Quality management - assessment | |||
The general assessment is that the quality of the Danish Innovation Survey is high. The methodology used is in line with recommandations from the Oslo Manual. As the survey is based on a sample, uncertainty is attached to all the figures in the form of random variation. This applies, in particular, to the results broken down according to the most detailed industry, region and sizeclass figures, where the figures should only be regarded as normative. Errors in the data reports and problems for enterprises with determining exact amounts that are used on innovation, and when it is innovation and innovation activities. |
|||
|
||||||||||||||||||
Relevance is the degree to which statistics meet current and potential users’ needs. It includes the production of all needed statistics and the extent to which concepts used (definitions, classifications etc.) reflect user needs. The aim is to describe the extent to which the statistics are useful to, and used by, the broadest array of users. For this purpose, statisticians need to compile information, firstly about their users and their needs. The CIS is based on a common questionnaire and a common survey methodology in order to achieve comparable, harmonised and high quality results for EU Member States, EFTA countries, Candidates and Associated countries. The results are used by ministries, organizations, researchers and journalists etc., as a basis for political interventions, analyses, articles etc. It is used for research, publications from ministries and for international comparison. Indicators based on the statistics are included in the EU Innovation Scoreboard. The on-going development of the survey contents takes place in close dialogue with national stakeholders as well as in EU fora. |
||||||||||||||||||
| 12.1. Relevance - User Needs | ||||||||||||||||||
At European level, European Commission users are the principal users of the data and contribute in identifying/defining the topics to be covered. Hence, Eurostat is consulted regularly (at hearings, task forces) to clarify which data is to be compiled. Eurostat is involved in the process of the development of the model questionnaires at a very early stage. User needs are considered throughout the whole discussion process of the model questionnaires aiming at providing relevant statistical data for monitoring and benchmarking of European policies. National users: Ministries, organizations, journalists, private enterprises, researchers and students. Statistical Denmark has an on-going dialogue with a variety of national users about the contents and usage of the survey. Ministry of Higher Education and Science is the main national user. Micro data (anonymized) are made available for the purpose of research. |
||||||||||||||||||
| 12.1.1. Needs at national level | ||||||||||||||||||
|
||||||||||||||||||
| 12.2. Relevance - User Satisfaction | ||||||||||||||||||
No systematic information on user satisfaction is collected for this statistics. |
||||||||||||||||||
| 12.3. Completeness | ||||||||||||||||||
The statistics completely matches the specifications of the EU-regulation and comes up to existing guidelines as the Oslo manual concerning statistics on innovation. |
||||||||||||||||||
| 12.3.1. Data completeness - rate | ||||||||||||||||||
Not requested. |
||||||||||||||||||
|
||||||||||||||||||||
The survey is sample based and consequently there is some uncertainty in the results in the form of random variation from the detailed indusrty, region and enterprise size class. Every year uncertainty calculations are produced, and these show that the sampling uncertainty is limited. The results from the survey for enterprises are based on data from 3,407 enterprises from a total population of 18,639 enterprises. The overall response rate is 97 percent. Mesurement error will occur when enterprises do not respond according to the objective reality. This can be due to the respondent's lack of overview of the entire innovation activity in the enterprise. |
||||||||||||||||||||
| 13.1. Accuracy - overall | ||||||||||||||||||||
Accuracy in the statistical sense denotes the closeness of computations or estimates to the exact or true values. Statistics are not equal with the true values because of variability (the statistics change from implementation to implementation of the survey due to random effects) and bias (the average of the possible values of the statistics from implementation to implementation is not equal to the true value due to systematic effects). |
||||||||||||||||||||
| 13.2. Sampling error | ||||||||||||||||||||
That part of the difference between a population value and an estimate thereof, derived from a random sample, which is due to the fact that only a subset of the population is enumerated. As the survey is based on a sample, uncertainty is attached to all the figures in the form of random variation. This applies, in particular, to the results broken down according to the most detailed industry, region and size class figures, where the figures should only be regarded as normative. Errors in the data reports and problems for enterprises with determining exact amounts that are used on innovation. The results are based on data from 3,407 enterprises from a total population of 18,639 enterprises. The overall response rate was 97 percent. |
||||||||||||||||||||
| 13.2.1. Sampling error - indicators | ||||||||||||||||||||
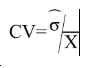
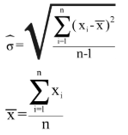
The main indicator used to measure sampling errors for CIS data is the coefficient of variation (CV). Coefficient of Variation= (Square root of the estimate of the sampling variance) / (Estimated value) Formula:
where
|
||||||||||||||||||||
| 13.2.1.1. Coefficient of variations for key variables | ||||||||||||||||||||
Coefficient of variation (%) for key variables by NACE categories and for enterprises with 10 and more employees
[1] = Coefficient of variation for the percentage of innovative enterprises (INN) in the total population of enterprises (ENT20) |
||||||||||||||||||||
| 13.2.1.2. Variance estimation method | ||||||||||||||||||||
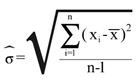
Definition of coefficient of variation: Coefficient of Variation= (Square root of the estimate of the sampling variance) / (Estimated value).
Formula:
where
|
||||||||||||||||||||
| 13.3. Non-sampling error | ||||||||||||||||||||
Non-sampling errors occur in all phases of a survey. They add to the sampling errors (if present) and contribute to decreasing overall accuracy. It is important to assess their relative weight in the total error and devote appropriate resources for their control and assessment. |
||||||||||||||||||||
| 13.3.1. Coverage error | ||||||||||||||||||||
Coverage errors (or frame errors) are due to divergences between the target population and the frame population. The frame population is the set of target population members that has a chance to be selected into the survey sample. There are no observed divergences between the target population and the frame population. |
||||||||||||||||||||
| 13.3.1.1. Over-coverage - rate | ||||||||||||||||||||
Not requested. |
||||||||||||||||||||
| 13.3.1.2. Common units - proportion | ||||||||||||||||||||
Not requested. |
||||||||||||||||||||
| 13.3.1.3. Under covered groups of the target population | ||||||||||||||||||||
No |
||||||||||||||||||||
| 13.3.1.4. Coverage errors in coefficient variation | ||||||||||||||||||||
No |
||||||||||||||||||||
| 13.3.2. Measurement error | ||||||||||||||||||||
Measurement errors occur during data collection and generate bias by recording values different than the true ones. The survey questionnaire used for data collection may have led to the recording of wrong values, or there may be respondent or interviewer bias. Mesurement error will occur when enterprises do not respond according to the objective reality. This can be due to the respondent's lack of overview of the entire innovation activity in the enterprise. |
||||||||||||||||||||
| 13.3.2.1. Measures for reducing measurement errors | ||||||||||||||||||||
Data for this statistics are collected via questionnaires for app. 3,500 respondents among a population of app. 18,500 enterprises. The material is validated already during the response from the enterprise, and afterwards followed by computer-aided validation and manual validation. |
||||||||||||||||||||
| 13.3.3. Non response error | ||||||||||||||||||||
Non sampling relates to unit and item non-response. Non response occurs when a survey fails to collect data on all survey variables from all the population units designated for data collection in a sample or complete enumeration.
There are two types of non-response: 1) Unit non-response, which occurs when no data (or so little as to be unusable) are collected about a population unit designated for data collection. a) Un-weighted unit non-response rate (%) = 100*(Number of units with no response or not usable response) / (Total number of in-scope (eligible) units in the sample) b) Weighted unit non-response rate (%) = 100*(Number of weighted units with no response or not usable response) / (Total number of in-scope (eligible) units in the sample) 2) Item non-response, which occurs when only data on some, but not all survey data items are collected about a population unit designated for data collection. a) Un-weighted item non-response rate (%) = 100*(Number of units with no response at all for the item) / (Total number of eligible, for the item, units in the sample i.e. filters have to be taken into account) |
||||||||||||||||||||
| 13.3.3.1. Unit non-response - rate | ||||||||||||||||||||
See below. |
||||||||||||||||||||
| 13.3.3.1.1. Un-weighted and weighted unit non-response rate by NACE categories and for enterprises with 10 or more employees | ||||||||||||||||||||
Un-weighted and weighted unit non-response rate by NACE categories and for enterprises with 10 or more employees
When the sample is drawn a design-weight is calculated. When the data collection is closed a final calibrated weight is calculated, compensating the non-response. |
||||||||||||||||||||
| 13.3.3.1.2. Maximum number of recalls/reminders before coding | ||||||||||||||||||||
The maximum numbers of recalls/reminders are 5. |
||||||||||||||||||||
| 13.3.3.2. Item non-response - rate | ||||||||||||||||||||
See below. |
||||||||||||||||||||
| 13.3.3.2.1. Item non-response rate for Turnover (in Core NACE: B-C-D-E-46-H-J-K-71-72-73 enterprises with 10 or more employees) | ||||||||||||||||||||
Item non-response rate for Turnover (in Core NACE: B-C-D-E-46-H-J-K-71-72-73 enterprises with 10 or more employees).
|
||||||||||||||||||||
| 13.3.3.2.2. Item non response rate for new questions | ||||||||||||||||||||
Item non-response rate for new questions in CIS t (in Core NACE: B-C-D-E-46-H-J-K-71-72-73 enterprises with 10 or more employees)
|
||||||||||||||||||||
| 13.3.4. Processing error | ||||||||||||||||||||
There are no detected processing errors between data collection and data processing. |
||||||||||||||||||||
| 13.3.5. Model assumption error | ||||||||||||||||||||
Not requested. |
||||||||||||||||||||


|
|||
Timeliness and punctuality refer to time and dates, but in a different manner. |
|||
| 14.1. Timeliness | |||
The timeliness of statistics reflects the length of time between data availability and the event or phenomenon they describe. |
|||
| 14.1.1. Time lag - first result | |||
Timeliness of national data – date of first release of national level : December 2021 Final data for CIS 2020 was published in December 2021. |
|||
| 14.1.2. Time lag - final result | |||
Final data for CIS 2020 was published in December 2021. |
|||
| 14.2. Punctuality | |||
Punctuality refers to the time lag between the release date of data and the target date on which they were scheduled for release as announced officially. |
|||
| 14.2.1. Punctuality - delivery and publication | |||
Date of transmission of complete and validated data to Eurostat (Number of days between that data and 30 June 2022) : Final data for CIS 2020 was transmitted via Edamis 2022-07-14. |
|||
|
||||||||||||||||||||
Comparability aims at measuring the impact of differences in applied statistical concepts and definitions on the comparison of statistics between geographical areas, non-geographical domains, or over time. The coherence of statistical outputs refers to the degree to which the statistical processes by which they were generated used the same concepts (classifications, definitions, and target populations) and harmonised methods. Coherent statistical outputs have the potential to be validly combined and used jointly. |
||||||||||||||||||||
| 15.1. Comparability - geographical | ||||||||||||||||||||
Delivery of data to Eurostat follows the minimum rules laid down in the regulation, which means that the data cover the types of activities and size classes of enterprises, which are defined by the regulation. Thereby the statistics is comparable to the similar statistics of other EU countries for the types of activities and size classes covered by the statistics. |
||||||||||||||||||||
| 15.1.1. Asymmetry for mirror flow statistics - coefficient | ||||||||||||||||||||
Not requested. |
||||||||||||||||||||
| 15.1.2. National questionnaire – compliance with Eurostat model questionnaire | ||||||||||||||||||||
Methodological deviations from the CIS Harmonised Data Collection (HDC)
|
||||||||||||||||||||
| 15.1.3. National questionnaire – additional questions | ||||||||||||||||||||
Methodological deviations from the CIS Harmonised Data Collection (HDC)
|
||||||||||||||||||||
| 15.2. Comparability - over time | ||||||||||||||||||||
Due to important methodological changes driven by Oslo Manual 2018, CIS 2018 and CIS 2020 cannot be directly compared with previous CIS waves. |
||||||||||||||||||||
| 15.2.1. Length of comparable time series | ||||||||||||||||||||
Not requested. |
||||||||||||||||||||
| 15.3. Coherence - cross domain | ||||||||||||||||||||
See the comparison between SBS and CIS data in the section 15.3.3 below. |
||||||||||||||||||||
| 15.3.1. Coherence - sub annual and annual statistics | ||||||||||||||||||||
Not requested. |
||||||||||||||||||||
| 15.3.2. Coherence - National Accounts | ||||||||||||||||||||
Not requested. |
||||||||||||||||||||
| 15.3.3. Coherence – Structural Business Statistics (SBS) | ||||||||||||||||||||
There are no other comparable Danish statistics. The results can be compared to those of other EU countries, since there is a harmonized methodological foundation. No differences between CIS data and SBS. This part compares key variables for aggregated CIS data with SBS data
* Numbers are to be provided for the last year of the reference period (t) |
||||||||||||||||||||
| 15.4. Coherence - internal | ||||||||||||||||||||
The data are to a large extent consistent, partly as a consequence of the electronic questionnaire guiding the respondents, and partly as a reflection of validation and correction. |
||||||||||||||||||||
|
|||
Confidential information on the production cost of the CIS. |
|||
|
|||
| 17.1. Data revision - policy | |||
Statistics Denmark revises published figures in accordance with the Revision Policy for Statistics Denmark. The common procedures and principles of the Revision Policy are for some statistics supplemented by a specific revision practice. Annexes: Revision policy in Statistics Denmark |
|||
| 17.2. Data revision - practice | |||
Not requested. |
|||
| 17.2.1. Data revision - average size | |||
Not requested. |
|||
|
||||||||||||||||||||||||||||||||||||||
| 18.1. Source data | ||||||||||||||||||||||||||||||||||||||
The statistics are compiled on the basis of questionnaires collected from app. 3,500 enterprises drawn as a sample from a population of app. 18,500 enterprises. The statistics are collected as one part of a single questionnaire, that also covers enterprises' research and development (R&D). |
||||||||||||||||||||||||||||||||||||||
| 18.1.1. Sampling frame (or census frame) | ||||||||||||||||||||||||||||||||||||||
The frame population is drawn from the Business Register, and consists of a population of 18,639 enterprises in 2020. |
||||||||||||||||||||||||||||||||||||||
| 18.1.2. Sampling design | ||||||||||||||||||||||||||||||||||||||
The enterprises are sampled depending on the number of full-time equivalents and type of activity (NACE). All enterprises with 100 or more full-time equivalents are included in the sample, and the likeliness of being chosen for the sample decreases in line with decrease in number of full-time equivalents. The enterprises in the sample are randomly selected. |
||||||||||||||||||||||||||||||||||||||
| 18.1.3. Target population and sample size | ||||||||||||||||||||||||||||||||||||||
|
||||||||||||||||||||||||||||||||||||||
| 18.1.4. Data source for pre-filled variables | ||||||||||||||||||||||||||||||||||||||
Variables and indicators filled or prefilled from other sources.
|
||||||||||||||||||||||||||||||||||||||
| 18.1.5. Data source and variables used for derivation and weighting | ||||||||||||||||||||||||||||||||||||||
|
||||||||||||||||||||||||||||||||||||||
| 18.2. Frequency of data collection | ||||||||||||||||||||||||||||||||||||||
According to the Commission Regulation (UE) 995/2012, the innovation statistics shall be provided to Eurostat every two years in each even year t+18. |
||||||||||||||||||||||||||||||||||||||
| 18.3. Data collection | ||||||||||||||||||||||||||||||||||||||
The statistics are collected via http://www.virk.dk as an electronic questionnaire. |
||||||||||||||||||||||||||||||||||||||
| 18.3.1. Survey participation | ||||||||||||||||||||||||||||||||||||||
Mandatory |
||||||||||||||||||||||||||||||||||||||
| 18.3.2. Survey type | ||||||||||||||||||||||||||||||||||||||
The statistics are collected via combination of a random survey and census. http://www.virk.dk as an electronic questionnaire. |
||||||||||||||||||||||||||||||||||||||
| 18.3.3. Combination of sample survey and census data | ||||||||||||||||||||||||||||||||||||||
Combination of survey and a census |
||||||||||||||||||||||||||||||||||||||
| 18.3.4. Census criteria | ||||||||||||||||||||||||||||||||||||||
The enterprises in the census are characterized by at least one of the following criterias.
Enterprises in the census all received a questionnaire and therefore they are automatically part of the sample. |
||||||||||||||||||||||||||||||||||||||
| 18.3.5. Data collection method | ||||||||||||||||||||||||||||||||||||||
Data collection method
Annexes: Enterprises' access to the online survey of the latest year. |
||||||||||||||||||||||||||||||||||||||
| 18.4. Data validation | ||||||||||||||||||||||||||||||||||||||
A comprehensive validation of the data is carried out: In the electronic questionnaire validation is performed on a range of the variables, e.g. on totals. After the data collection the data are mechanically validated and to some extent corrected. The ICT-programs that checks the data for errors also forms lists of likely or de facto errors. The types of errors that are identified as those having the greatest influence on the quality of the statistics are listed together with identification numbers of the respondents and checked manually. Finally outlier tests are carried out for key variables/combinations of these. A minor part of the data collected is compared to other sources with the aim of assessing whether the response is likely correct or should be corrected. This applies to e.g. to the innovation expenses, which are compared to the total turnover of the enterprise, which comes from The Central Business Register. Also public accounts from the enterprises are used as a supplying source of information. |
||||||||||||||||||||||||||||||||||||||
| 18.5. Data compilation | ||||||||||||||||||||||||||||||||||||||
Operations performed on data to derive new information according to a given set of rules. The final, corrected data material is compared to the original sample. In 2020 some enterprises had their response calculated from imputation. A calibrated weighting is carried out. |
||||||||||||||||||||||||||||||||||||||
| 18.5.1. Imputation - rate | ||||||||||||||||||||||||||||||||||||||
In 2020 some enterprises had their response calculated from imputation. Imputation is the method of creating plausible (but artificial) substitute values for all those missing.
Definition of imputation rate: Imputation rate (for the variable x) (%) = 100*(Number of replaced values) / (Total number of values for a given variable)
Definition of weighted imputation rate: Weighted imputation rate= 100*(Number of total weighted replaced values) / (Total number of weighted values for a given variable) |
||||||||||||||||||||||||||||||||||||||
| 18.5.1.1. Imputation rate for metric variables | ||||||||||||||||||||||||||||||||||||||
Imputation rate for metric variables by NACE categories and for enterprises with 10 or more employees:
(1) = Total turnover in the last year of the reference period (t) (TUR) (2) = Share of the turnover in the last year of the reference period (t) due to new or improved product new to the market in the total turnover for product innovative enterprises TUR_PRD_NEW_MKT/TUR(INNO_PRD) (3) = R&D expenditure performed in-house (EXP_INNO_RND_IH) |
||||||||||||||||||||||||||||||||||||||
| 18.5.2. Weights calculation | ||||||||||||||||||||||||||||||||||||||
Weights calculation method for sample surveys: The results are raised to 100 percent of the surveyed population based on the stratums used in the sampling procedure. By grossing up a reweighting and calibration using regression techniques is applied to the weight of the individual enterprise. Units nonresponse is handling through reweighting as part of the grossing up procedure. Grossing up is done using CLAN with the assistance of in‐house methodology experts.
|
||||||||||||||||||||||||||||||||||||||
| 18.6. Adjustment | ||||||||||||||||||||||||||||||||||||||
Weight = Nstrata - nstrata Software SAS and CLAN Calibration via the SAS-macro CLAN (Andersson and Nordberg, 1998). The aim of the calibration is to correct skewness as a result of non-response, via using the knowledge on population level for number of units together with the additional variables turnover and number of full-time equivalents. No weighting for cut-off. |
||||||||||||||||||||||||||||||||||||||
| 18.6.1. Seasonal adjustment | ||||||||||||||||||||||||||||||||||||||
Not requested. |
||||||||||||||||||||||||||||||||||||||
|
|||
|
|||
|
|||