|
 |
| For any question on data and metadata, please contact: Eurostat user support |
|
|||
| 1.1. Contact organisation | Statistics Sweden |
||
| 1.2. Contact organisation unit | Economic Statistics Department Industry indicators, R&D and IT unit |
||
| 1.5. Contact mail address | SCB |
||
|
|||
| 2.1. Metadata last certified | 30/06/2020 | ||
| 2.2. Metadata last posted | 12/11/2019 | ||
| 2.3. Metadata last update | 03/11/2019 | ||
|
||||||||||||||||||||||||||||||||||||||||||||||||
| 3.1. Data description | ||||||||||||||||||||||||||||||||||||||||||||||||
The Community Innovation Survey (CIS) is a survey about innovation activities in enterprises. The survey is designed to collect the information on different types of innovation, various aspects of the development of an innovation, objectives of innovation activities, sources of information, public funding or expenditure on innovation. Its aim is to measure the innovativeness of sectors and enable the analysis of the factors of innovation. The CIS provides statistics by type of innovators, economic activities and size class of enterprises. The survey is currently carried out every two years across the EU Member States, EFTA countries and EU candidate countries. In order to ensure comparability across countries, Eurostat together with the countries developed a Harmonised Data Collection (HDC) questionnaire accompanied by a set of definitions and methodological recommendations. CIS 2018 concepts and its underlying methodology are based on the Oslo Manual (2018) 4th Edition. New reviews of the CIS2018 aims to meet several objectives : 1: Reduce subjectivity and biases in the main CIS indicators 2: Improve reporting about innovation activities and capabilities in the firm 3: Ensure international comparability (including compliance with the OM4) 4: Broaden the basis CIS information on enterprise management 5: Take better account the diversity of enterprises in the EU 6: Improve reporting about external drivers and enablers of innovation 7: Improve timeliness 8: Ensure the feasibility of data collection 9: Ensure continuity with the CIS 2016 10: Improve reporting about the output and impact of innovation CIS2018 is conducted under Commission Regulation No 995/2012. This Regulation defines the mandatory target population of the survey referring to enterprises in the Core NACE economic sectors (see section 3.3.) with at least 10 employees. Further activities may be covered on a voluntary basis in national datasets. Most statistics are based on the 3-year reference period (t, t-1, t-2), but some use only one calendar year (t or t-2). Please consider CIS t to be the survey that refers to the same year of the quality report and CIS t-2 to be the previous survey e.g.: CIS 2018= CIS t then, CIS t-2=CIS 2016 |
||||||||||||||||||||||||||||||||||||||||||||||||
| 3.2. Classification system | ||||||||||||||||||||||||||||||||||||||||||||||||
Indicators related to the enterprises are classified by country, economic activity (NACE Rev. 2), size class of enterprises and type of innovation. The main typology of classification of enterprises in reference to innovation is the distinction between innovation-active enterprises (INN) and not innovation-active enterprises (NINN). The enterprise is considered as innovative (INN) if during the reference period it successfully introduced a product or business process innovation, had ongoing innovation activities, abandoned innovation activities or was engaged in in-house R&D or R&D contracted out. Non-innovative (NINN) enterprises had no innovation activity mentioned above whatsoever during the reference period. |
||||||||||||||||||||||||||||||||||||||||||||||||
| 3.3. Coverage - sector | ||||||||||||||||||||||||||||||||||||||||||||||||
CIS covers main economic sectors according to NACE Rev.2 broken down by size class of enterprises and type of innovation activity. |
||||||||||||||||||||||||||||||||||||||||||||||||
| 3.3.1. Main economic sectors covered - NACE Rev.2 | ||||||||||||||||||||||||||||||||||||||||||||||||
In accordance with Commission Regulation 995/2012 on innovation statistics, the following industries and services are included in the core target population. Results are made available with these following breakdowns : All NACE – Core NACE (NACE Rev. 2 sections & divisions B-C-D-E-46-H-J-K-71-72-73 ) CORE INDUSTRY (excluding construction) (NACE Rev. 2 SECTIONS B_C_D_E) 10-12: Manufacture of food products, beverages and tobacco 13-15: Manufacture of textiles, wearing apparel, leather and related products 16-18: Manufacture of wood, paper, printing and reproduction 20: Manufacture of chemicals and chemical products 21: Manufacture of basic pharmaceutical products and pharmaceutical preparations 19-22: Manufacture of petroleum, chemical, pharmaceutical, rubber and plastic products 23: Manufacture of other non-metallic mineral products 24: Manufacture of basic metals 25: Manufacture of fabricated metal products, except machinery and equipment 26: Manufacture of computer, electronic and optical products 25-30: Manufacture of fabricated metal products (except machinery and equipment), computer, electronic and optical products, electrical equipment, motor vehicles and other transport equipment 31-33: Manufacture of furniture; jewellery, musical instruments, toys; repair and installation of machinery and equipment D: ELECTRICITY, GAS, STEAM AND AIR CONDITIONING SUPPLY E: WATER SUPPLY; SEWERAGE, WASTE MANAGEMENT AND REMEDIATION ACTIVITIES 36: Water collection, treatment and supply 37-39: Sewerage, waste management, remediation activities CORE SERVICES (NACE Rev. 2 sections & divisions 46-H-J-K-71-72-73)(NACE code in the tables = G46-M73_INN) 46: Wholesale trade, except of motor vehicles and motorcycles H: TRANSPORTATION AND STORAGE 49-51: Land transport and transport via pipelines, water transport and air transport 52-53: Warehousing and support activities for transportation and postal and courier activities J: INFORMATION AND COMMUNICATION 58: Publishing activities 61: Telecommunications 62: Computer programming, consultancy and related activities 63: Information service activities K: FINANCIAL AND INSURANCE ACTIVITIES 64: Financial service activities, except insurance and pension funding 65: Insurance, reinsurance and pension funding, except compulsory social security 66: Activities auxiliary to financial services and insurance activities M: PROFESSIONAL, SCIENTIFIC AND TECHNICAL ACTIVITIES 71: Architectural and engineering activities; technical testing and analysis 72: Scientific research and development 73: Advertising and market research 71-73: Architectural and engineering activities; technical testing and analysis; Scientific research and development; Advertising and market research |
||||||||||||||||||||||||||||||||||||||||||||||||
| 3.3.1.1. Main economic sectors covered - NACE Rev.2 - national particularities | ||||||||||||||||||||||||||||||||||||||||||||||||
The following NACE are covered in addition: NACE 41-43 Construction, NACE 45 Wholesale and retail trade and repair of motor vehicles and motorcycles, NACE 47 Retail and trade, except of motor vehicles and motorcycles, NACE 55-56 Accommodation and food service activities, NACE 69 Legal and accounting activities, NACE 70 Activities of head offices; management consultancy activities, NACE 74 Other professional, scientific and technical activities, NACE 77-82 Administrative and support service activities were covered. |
||||||||||||||||||||||||||||||||||||||||||||||||
| 3.3.2. Sector coverage - size class | ||||||||||||||||||||||||||||||||||||||||||||||||
In accordance with Commission Regulation 995/2012 on innovation statistics, the following size classes of enterprises according to number of employees are included in the core target population of the CIS:
|
||||||||||||||||||||||||||||||||||||||||||||||||
| 3.3.2.1. Sector coverage - size class - national particularities | ||||||||||||||||||||||||||||||||||||||||||||||||
No deviations |
||||||||||||||||||||||||||||||||||||||||||||||||
| 3.4. Statistical concepts and definitions | ||||||||||||||||||||||||||||||||||||||||||||||||
The description of concepts, definitions and main statistical variables is available in CIS 2018 European metadata file (ESMS) Results of the community innovation survey 2018 (CIS2018) (inn_cis11) in Eurostat database. |
||||||||||||||||||||||||||||||||||||||||||||||||
| 3.5. Statistical unit | ||||||||||||||||||||||||||||||||||||||||||||||||
Enterprise |
||||||||||||||||||||||||||||||||||||||||||||||||
| 3.6. Statistical population | ||||||||||||||||||||||||||||||||||||||||||||||||
Core target population are all enterprises in CORE NACE activities (see 3.3.1) with 10 or more employees. |
||||||||||||||||||||||||||||||||||||||||||||||||
| 3.7. Reference area | ||||||||||||||||||||||||||||||||||||||||||||||||
No deviations. |
||||||||||||||||||||||||||||||||||||||||||||||||
| 3.8. Coverage - Time | ||||||||||||||||||||||||||||||||||||||||||||||||
Several rounds of Community Innovation Survey have been conducted so far at two-year interval since end of 90’s. |
||||||||||||||||||||||||||||||||||||||||||||||||
| 3.8.1. Participation in the CIS waves | ||||||||||||||||||||||||||||||||||||||||||||||||
*two reference periods can be distinguished for CIS light: 2000-2002 and 2001-2003 ** No deviations from reference period. |
||||||||||||||||||||||||||||||||||||||||||||||||
| 3.9. Base period | ||||||||||||||||||||||||||||||||||||||||||||||||
Not relevant. |
||||||||||||||||||||||||||||||||||||||||||||||||
|
|||
CIS indicators are available according to 3 units of measure:
NR: Number for number of enterprises and number of persons employed. THS_EUR: Thousands of euros. All financial variables are provided in thousands of euros, i.e. Turnover or Innovation expenditure. PC: Percentage. The percentage is the ratio between the selected combinations of indicators. |
|||
|
|||
For CIS 2018, the time covered by the survey is the 3-year period from the beginning of 2016 to the end of 2018. Some questions and indicators refer to one year — 2018. The list of indicators covering the 3-year period and referring to one year according to the HDC is available in the Annex section of the European metadata (ESMS). |
|||
|
|||
| 6.1. Institutional Mandate - legal acts and other agreements | |||
CIS surveys are based on the Commission Regulation No 995/2012, implementing Decision No 1608/2003/EC of the European Parliament and of the Council on the production and development of Community statistics on science and technology. This Regulation establishes innovation statistics on a statutory basis and makes the delivery of certain variables compulsory e.g. innovation activities, cooperation, development, expenditures and turnover (see the Regulation). Each survey wave may additionally include further variables. In addition, the Regulation defines the obligatory cross-coverage of economic sectors and size class of enterprises. |
|||
| 6.1.1. National legislation | |||
CIS surveys are based on the Commission Regulation No 995/2012, implementing Decision No 1608/2003/EC of the European Parliament and of the Council on the production and development of Community statistics on science and technology. This Regulation establishes innovation statistics on a statutory basis and makes the delivery of certain variables compulsory e.g. innovation activities, cooperation, development, expenditures and turnover (see the Regulation). Each survey wave may additionally include further variables. In addition, the Regulation defines the obligatory cross-coverage of economic sectors and size class of enterprises. |
|||
| 6.2. Institutional Mandate - data sharing | |||
Not requested. |
|||
|
|||
CIS data are transmitted to Eurostat via EDAMIS using the secured transmission system. |
|||
| 7.1. Confidentiality - policy | |||
Confidenciality is regulated in the law of official statistics of Sweden (2001:99) where the Community Innovation Survey is obliged to maintain confidentiality in publication of macrodata. |
|||
| 7.2. Confidentiality - data treatment | |||
For frequency tables, the rule applied is the value of a cell should be above a certain value n, othervise the cell is considered sensitive. For magnitude tables, the rule applied is p% rule. The formula for p% rule is as following: The cell is considered as sensitive if X-x2-x1>p%*x1, where X=cell total, x1=biggest contributor to the cell, x2=second biggest contributor to the cell. |
|||
|
|||
| 8.1. Release calendar | |||
National publication: 2019-11-12 Report publication, national: 2020-04-07 National microdata: 2019-11-15 |
|||
| 8.2. Release calendar access | |||
| 8.3. Release policy - user access | |||
Microdata is released when requested. Permission must be requested through MONA, Statistics Sweden microdata database (MONA – SCB:s plattform för mikrodata). |
|||
|
|||
CIS is conducted and disseminated at two-year interval in pair years. |
|||
|
|||||||||||||||
Accessibility and clarity refer to the simplicity and ease for users to access statistics using simple and user-friendly procedure, obtaining them in an expected form and within an acceptable time period, with the appropriate user information and assistance: a global context which finally enables them to make optimum use of the statistics. |
|||||||||||||||
| 10.1. Dissemination format - News release | |||||||||||||||
See below. |
|||||||||||||||
| 10.1.1. Availability of the releases | |||||||||||||||
|
|||||||||||||||
| 10.2. Dissemination format - Publications | |||||||||||||||
- Online database (containing all/most results) :yes - Analytical publication (referring to all/most results) : - Analytical publication (referring to specific results, e.g. only for one sector or one specific aspect) : |
|||||||||||||||
| 10.3. Dissemination format - online database | |||||||||||||||
Free access, www.scb.se/uf0315 |
|||||||||||||||
| 10.3.1. Data tables - consultations | |||||||||||||||
Not requested. |
|||||||||||||||
| 10.4. Dissemination format - microdata access | |||||||||||||||
Only avaliable via SAFE centre. At national level micro data are transmitted to research project using MONA-database (Micro data Online Access). The MONA system provides secure access to micro data at Statistics Sweden from an Internet connection and protected password. Not free of charge. |
|||||||||||||||
| 10.4.1. Dissemination of microdata | |||||||||||||||
*Microdata are availabe to researchers using MONA-database (Microdata Online Access). The MONA system provides secure access to microdata at Statistics Sweden from an Internet connection password. Not free of charge. |
|||||||||||||||
| 10.5. Dissemination format - other | |||||||||||||||
No other means of dissemination. |
|||||||||||||||
| 10.5.1. Metadata - consultations | |||||||||||||||
Not requested. |
|||||||||||||||
| 10.6. Documentation on methodology | |||||||||||||||
There is documentation about the microdata, the quality of the statistics and the process of producing the statistics. All the documentation can be found at our homepage (only in Swedish). |
|||||||||||||||
| 10.6.1. Metadata completeness - rate | |||||||||||||||
Not requested. |
|||||||||||||||
| 10.7. Quality management - documentation | |||||||||||||||
Documentation concerning quality management of the published data is avaliable here (only in Swedish): Innovationsverksamhet i Sverige (scb.se) |
|||||||||||||||
|
|||
| 11.1. Quality assurance | |||
Documentataion avaliable here (only in Swedish): Innovationsverksamhet i Sverige (scb.se) |
|||
| 11.2. Quality management - assessment | |||
The quality is considered to be good. The methodology used is based on the Oslo Manual recommendations and the questionnaire follows the CISt core questionnaire. For the sampling frame we used the national business register updated in November 2016. For imputation we use Banff from Statistics Canada. All variables except Expenditure and the module on Logistics innovation use Hot Deck-imputation. Expenditure use Cold Deck-imputation if possible, else mean within stratum. No imputation is made for the variables in the growth module. |
|||
|
||||||||||||||||||
Relevance is the degree to which statistics meet current and potential users’ needs. It includes the production of all needed statistics and the extent to which concepts used (definitions, classifications etc.) reflect user needs. The aim is to describe the extent to which the statistics are useful to, and used by, the broadest array of users. For this purpose, statisticians need to compile information, firstly about their users and their needs. The CIS is based on a common questionnaire and a common survey methodology, as laid down in the 3rd edition of Oslo Manual (2005 edition), in order to achieve comparable, harmonised and high quality results for EU Member States, EFTA countries, Candidates and Associated countries. |
||||||||||||||||||
| 12.1. Relevance - User Needs | ||||||||||||||||||
User needs and requests are mostly vioced by the R&D/inovation council in Sweden (Användarrådet för FoU-statistik (scb.se)). The interest group consists of research intitutes and other organisatios that have great use for the Community Innovation Survey. Specific requestst from users are collected and thereafter judged on merits such as user demand as well as cost analysis. |
||||||||||||||||||
| 12.1.1. Needs at national level | ||||||||||||||||||
|
||||||||||||||||||
| 12.2. Relevance - User Satisfaction | ||||||||||||||||||
In 2012 a satisfaction survey was carried out among users of CIS and R&D statistics. The users said that metadata has to be easy to find and understand. They also requested more statistics at regional level. In order to accomodate this effort Statistics Sweden initialized publication of more regional statsitics in the form of a report, published evey second year. |
||||||||||||||||||
| 12.3. Completeness | ||||||||||||||||||
All mandatory indicators are included and published in national CIS as well as transmitted to Eurostat. Both regarding mandatory NACE, size classes and variables. |
||||||||||||||||||
| 12.3.1. Data completeness - rate | ||||||||||||||||||
Not requested. |
||||||||||||||||||
|
||||||||||||||||||||||||||||||||||||||||||||||||||||
| 13.1. Accuracy - overall | ||||||||||||||||||||||||||||||||||||||||||||||||||||
Accuracy in the statistical sense denotes the closeness of computations or estimates to the exact or true values. Statistics are not equal with the true values because of variability (the statistics change from implementation to implementation of the survey due to random effects) and bias (the average of the possible values of the statistics from implementation to implementation is not equal to the true value due to systematic effects). |
||||||||||||||||||||||||||||||||||||||||||||||||||||
| 13.2. Sampling error | ||||||||||||||||||||||||||||||||||||||||||||||||||||
That part of the difference between a population value and an estimate thereof, derived from a random sample, which is due to the fact that only a subset of the population is enumerated. |
||||||||||||||||||||||||||||||||||||||||||||||||||||
| 13.2.1. Sampling error - indicators | ||||||||||||||||||||||||||||||||||||||||||||||||||||
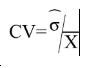
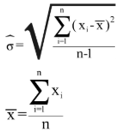
The main indicator used to measure sampling errors for CIS data is the coefficient of variation (CV).
Coefficient of Variation= (Square root of the estimate of the sampling variance) / (Estimated value) Formula: where
|
||||||||||||||||||||||||||||||||||||||||||||||||||||
| 13.2.1.1. Coefficient of variations for key variables | ||||||||||||||||||||||||||||||||||||||||||||||||||||
Coefficient of variation (%) for key variables by NACE categories and for enterprises with 10 and more employees
[1] = Coefficient of variation for the percentage of innovative enterprises (INN) in the total population of enterprises (ENT18) |
||||||||||||||||||||||||||||||||||||||||||||||||||||
| 13.2.1.2. Variance estimation method | ||||||||||||||||||||||||||||||||||||||||||||||||||||
Horvitz-Thompson is used for variance estimation. The sample weights Nh/nh has been adjusted with nh/nhR in each stratum. |
||||||||||||||||||||||||||||||||||||||||||||||||||||
| 13.3. Non-sampling error | ||||||||||||||||||||||||||||||||||||||||||||||||||||
Non-sampling errors occur in all phases of a survey. They add to the sampling errors (if present) and contribute to decreasing overall accuracy. It is important to assess their relative weight in the total error and devote appropriate resources for their control and assessment. No reports have been issued attempting to quantify the non-sampling error for CIS t=2018.
|
||||||||||||||||||||||||||||||||||||||||||||||||||||
| 13.3.1. Coverage error | ||||||||||||||||||||||||||||||||||||||||||||||||||||
Coverage errors (or frame errors) are due to divergences between the target population and the frame population. The frame population is the set of target population members that has a chance to be selected into the survey sample. It is a listing of all items in the population from which the sample is drawn that contains contact details as well as sufficient information to perform stratification and sampling.
|
||||||||||||||||||||||||||||||||||||||||||||||||||||
| 13.3.1.1. Over-coverage - rate | ||||||||||||||||||||||||||||||||||||||||||||||||||||
Not requested. |
||||||||||||||||||||||||||||||||||||||||||||||||||||
| 13.3.1.2. Common units - proportion | ||||||||||||||||||||||||||||||||||||||||||||||||||||
Not requested. |
||||||||||||||||||||||||||||||||||||||||||||||||||||
| 13.3.1.3. Under covered groups of the target population | ||||||||||||||||||||||||||||||||||||||||||||||||||||
No under covered groups of the target population has been detected. To receive our frame population we used our national business register (updated in November 2018). No under-coverage is observed. There is some over-coverage in the frame population, due to enterprises have gone bankrupt. |
||||||||||||||||||||||||||||||||||||||||||||||||||||
| 13.3.1.4. Coverage errors in coefficient variation | ||||||||||||||||||||||||||||||||||||||||||||||||||||
The effects of coverage errors due to the found over-coverage is not incorporated in the CVs (see table in 13.2.1.1). |
||||||||||||||||||||||||||||||||||||||||||||||||||||
| 13.3.2. Measurement error | ||||||||||||||||||||||||||||||||||||||||||||||||||||
Measurement errors occur during data collection and generate bias by recording values different than the true ones. The survey questionnaire used for data collection may have led to the recording of wrong values, or there may be respondent or interviewer bias. |
||||||||||||||||||||||||||||||||||||||||||||||||||||
| 13.3.2.1. Measures for reducing measurement errors | ||||||||||||||||||||||||||||||||||||||||||||||||||||
Before sending out the survey Statistics Sweden tested the questionnaire, both the paper questionnaire and the web based questionnaire. The paper questionnaire was tested by experts on survey methodology. In the web-questionnaire there are controls that generates error messages if the the enterprises gives inconsistent answers or if they do not answer parts of questions, to reduce item non-response. In the web-based questionnaire the filter instructions are automatic depending on the answers. |
||||||||||||||||||||||||||||||||||||||||||||||||||||
| 13.3.3. Non response error | ||||||||||||||||||||||||||||||||||||||||||||||||||||
Non response occurs when a survey fails to collect data on all survey variables from all the population units designated for data collection in a sample or complete enumeration. There are two types of non-response: 1) Unit non-response, which occurs when no data (or so little as to be unusable) are collected about a population unit designated for data collection. a) Un-weighted unit non-response rate (%) = 100*(Number of units with no response or not usable response) / (Total number of in-scope (eligible) units in the sample) b) Weighted unit non-response rate (%) = 100*(Number of weighted units with no response or not usable response) / (Total number of in-scope (eligible) units in the sample) 2) Item non-response, which occurs when only data on some, but not all survey data items are collected about a population unit designated for data collection. a) Un-weighted item non-response rate (%) = 100*(Number of units with no response at all for the item) / (Total number of eligible, for the item, units in the sample i.e. filters have to be taken into account) |
||||||||||||||||||||||||||||||||||||||||||||||||||||
| 13.3.3.1. Unit non-response - rate | ||||||||||||||||||||||||||||||||||||||||||||||||||||
See below. |
||||||||||||||||||||||||||||||||||||||||||||||||||||
| 13.3.3.1.1. Un-weighted and weighted unit non-response rate by NACE categories and for enterprises with 10 or more employees | ||||||||||||||||||||||||||||||||||||||||||||||||||||
Un-weighted and weighted unit non-response rate by NACE categories and for enterprises with 10 or more employees
The number of eligible units is the number of sample units, which indeed belong to the target population. |
||||||||||||||||||||||||||||||||||||||||||||||||||||
| 13.3.3.1.2. Maximum number of recalls/reminders before coding | ||||||||||||||||||||||||||||||||||||||||||||||||||||
3 reminders were sent out to the enterprises before they were coded as a non-responding enterprise. Some of the enterprises were also reminded one more time using telephone-reminders. |
||||||||||||||||||||||||||||||||||||||||||||||||||||
| 13.3.3.2. Item non-response - rate | ||||||||||||||||||||||||||||||||||||||||||||||||||||
See below. |
||||||||||||||||||||||||||||||||||||||||||||||||||||
| 13.3.3.2.1. Item non-response rate for Turnover (in Core NACE: B-C-D-E-46-H-J-K-71-72-73 enterprises with 10 or more employees) | ||||||||||||||||||||||||||||||||||||||||||||||||||||
Item non-response rate for Turnover (in Core NACE: B-C-D-E-46-H-J-K-71-72-73 enterprises with 10 or more employees). Unknown for CIS2018.
|
||||||||||||||||||||||||||||||||||||||||||||||||||||
| 13.3.3.2.2. Item non response rate for new questions | ||||||||||||||||||||||||||||||||||||||||||||||||||||
Item non-response rate for new questions in CIS t (in Core NACE: B-C-D-E-46-H-J-K-71-72-73 enterprises with 10 or more employees) Unknown for CIS2018.
|
||||||||||||||||||||||||||||||||||||||||||||||||||||
| 13.3.4. Processing error | ||||||||||||||||||||||||||||||||||||||||||||||||||||
The data from the web-based survey were automatically transferred to our data collecting program. The paper questionnaires were scanned in to our data collecting program. |
||||||||||||||||||||||||||||||||||||||||||||||||||||
| 13.3.5. Model assumption error | ||||||||||||||||||||||||||||||||||||||||||||||||||||
Not requested. |
||||||||||||||||||||||||||||||||||||||||||||||||||||
|
|||
Timeliness and punctuality refer to time and dates, but in a different manner. |
|||
| 14.1. Timeliness | |||
The timeliness of statistics reflects the length of time between data availability and the event or phenomenon they describe. |
|||
| 14.1.1. Time lag - first result | |||
Timeliness of national data – date of first release of national level : 2019-11-12 (12th of november 2019). |
|||
| 14.1.2. Time lag - final result | |||
Not requested. |
|||
| 14.2. Punctuality | |||
Punctuality refers to the time lag between the release date of data and the target date on which they were scheduled for release as announced officially. |
|||
| 14.2.1. Punctuality - delivery and publication | |||
Date of transmission of complete and validated data to Eurostat (Number of days between that data and 30 June 2020) : 2021-03-04 (4th of march 2021). |
|||
|
||||||||||||||||||||
Comparability aims at measuring the impact of differences in applied statistical concepts and definitions on the comparison of statistics between geographical areas, non-geographical domains, or over time. The coherence of statistical outputs refers to the degree to which the statistical processes by which they were generated used the same concepts (classifications, definitions, and target populations) and harmonised methods. Coherent statistical outputs have the potential to be validly combined and used jointly. |
||||||||||||||||||||
| 15.1. Comparability - geographical | ||||||||||||||||||||
National design of the CIS questionnaire is done through compliance with the 4th edition of the Oslo Manual as well as the harmonised questionnnaire. All mandatory questions are included from the hamonised questionnaire, as well as a selection of the very important and important questions. |
||||||||||||||||||||
| 15.1.1. Asymmetry for mirror flow statistics - coefficient | ||||||||||||||||||||
Not requested. |
||||||||||||||||||||
| 15.1.2. National questionnaire – compliance with Eurostat model questionnaire | ||||||||||||||||||||
Methodological deviations from the CIS Harmonised Data Collection (HDC)
|
||||||||||||||||||||
| 15.1.3. National questionnaire – additional questions | ||||||||||||||||||||
Methodological deviations from the CIS Harmonised Data Collection (HDC)
|
||||||||||||||||||||
| 15.2. Comparability - over time | ||||||||||||||||||||
Due to important methodological changes in CIS 2018 driven by Oslo Manual 2018, the data 2018 cannot be directly compared with previous CIS waves. |
||||||||||||||||||||
| 15.2.1. Length of comparable time series | ||||||||||||||||||||
Not requested. |
||||||||||||||||||||
| 15.3. Coherence - cross domain | ||||||||||||||||||||
See the comparison between SBS and CIS data in the section 15.3.3 below. |
||||||||||||||||||||
| 15.3.1. Coherence - sub annual and annual statistics | ||||||||||||||||||||
Not requested. |
||||||||||||||||||||
| 15.3.2. Coherence - National Accounts | ||||||||||||||||||||
Not requested. |
||||||||||||||||||||
| 15.3.3. Coherence – Structural Business Statistics (SBS) | ||||||||||||||||||||
This part compares key variables for aggregated CIS data with SBS data
* Numbers are to be provided for the last year of the reference period (t) |
||||||||||||||||||||
| 15.4. Coherence - internal | ||||||||||||||||||||
Not requested. |
||||||||||||||||||||
|
|||
Confidential information on the production cost of the CIS. |
|||
|
|||
| 17.1. Data revision - policy | |||
Not requested. |
|||
| 17.2. Data revision - practice | |||
Not requested. |
|||
| 17.2.1. Data revision - average size | |||
Not requested. |
|||
|
||||||||||||||||||||||||||||||||||||||
| 18.1. Source data | ||||||||||||||||||||||||||||||||||||||
See below: |
||||||||||||||||||||||||||||||||||||||
| 18.1.1. Sampling frame (or census frame) | ||||||||||||||||||||||||||||||||||||||
National business register was used. |
||||||||||||||||||||||||||||||||||||||
| 18.1.2. Sampling design | ||||||||||||||||||||||||||||||||||||||
The stratification variables were NACE (two digit level), Size classes (10-49 emp, 50-199 emp, 200-249 emp, 250-499 emp, 500- emp) and NUTS2 (only size classes 10-49 emp, 50-199 emp and 200-249 emp). This formed 1 014 strata and sample size 9 297. The strata including the largest enterprises (with at least 200 emp) where completely enumerated. Enterprises in NACE 72 with more than 10 employees were enumerated |
||||||||||||||||||||||||||||||||||||||
| 18.1.3. Target population and sample size | ||||||||||||||||||||||||||||||||||||||
|
||||||||||||||||||||||||||||||||||||||
| 18.1.4. Data source for pre-filled variables | ||||||||||||||||||||||||||||||||||||||
Variables and indicators filled or prefilled from other sources.
|
||||||||||||||||||||||||||||||||||||||
| 18.1.5. Data source and variables used for derivation and weighting | ||||||||||||||||||||||||||||||||||||||
Not avaliable. |
||||||||||||||||||||||||||||||||||||||
| 18.2. Frequency of data collection | ||||||||||||||||||||||||||||||||||||||
According to the Commission Regulation (UE) 995/2012, the innovation statistics shall be provided to Eurostat every two years in each even year. The data collection takes place every second year in year t-2 preceding the data provision. |
||||||||||||||||||||||||||||||||||||||
| 18.3. Data collection | ||||||||||||||||||||||||||||||||||||||
Mandatory survey. |
||||||||||||||||||||||||||||||||||||||
| 18.3.1. Survey participation | ||||||||||||||||||||||||||||||||||||||
Mandatory survey. |
||||||||||||||||||||||||||||||||||||||
| 18.3.2. Survey type | ||||||||||||||||||||||||||||||||||||||
Data are collected through census and sample survey. |
||||||||||||||||||||||||||||||||||||||
| 18.3.3. Combination of sample survey and census data | ||||||||||||||||||||||||||||||||||||||
Sample survey for enterprises with 10-199 employees. For enterprises with 200 employees or more and enterprises in NACE 72 with 10 or more employees, a census was used. |
||||||||||||||||||||||||||||||||||||||
| 18.3.4. Census criteria | ||||||||||||||||||||||||||||||||||||||
Size class and a specific sector (NACE 72). For enterprises with 200 employees or more and enterprises in NACE 72 with 10 or more employees, a census was used. |
||||||||||||||||||||||||||||||||||||||
| 18.3.5. Data collection method | ||||||||||||||||||||||||||||||||||||||
Data collection method
|
||||||||||||||||||||||||||||||||||||||
| 18.4. Data validation | ||||||||||||||||||||||||||||||||||||||
Not requested. |
||||||||||||||||||||||||||||||||||||||
| 18.5. Data compilation | ||||||||||||||||||||||||||||||||||||||
Operations performed on data to derive new information according to a given set of rules. |
||||||||||||||||||||||||||||||||||||||
| 18.5.1. Imputation - rate | ||||||||||||||||||||||||||||||||||||||
Imputation is the method of creating plausible (but artificial) substitute values for all those missing. Definition of imputation rate: Imputation rate (for the variable x) (%) = 100*(Number of replaced values) / (Total number of values for a given variable) Definition of weighted imputation rate: Weighted imputation rate= 100*(Number of total weighted replaced values) / (Total number of weighted values for a given variable) |
||||||||||||||||||||||||||||||||||||||
| 18.5.1.1. Imputation rate for metric variables | ||||||||||||||||||||||||||||||||||||||
Imputation rate for metric variables by NACE categories and for enterprises with 10 or more employees: Not available
(1) = Total turnover in the last year of the reference period (t) (TUR) (2) = Share of the turnover in the last year of the reference period (t) due to new or improved product new to the market in the total turnover for product innovative enterprises TUR_PRD_NEW_MKT/TUR(INNO_PRD) (3) = R&D expenditure performed in-house (EXP_INNO_RND_IH) |
||||||||||||||||||||||||||||||||||||||
| 18.5.2. Weights calculation | ||||||||||||||||||||||||||||||||||||||
Weights calculation method for sample surveys
|
||||||||||||||||||||||||||||||||||||||
| 18.6. Adjustment | ||||||||||||||||||||||||||||||||||||||
For estimates SAS and CLAN was used. |
||||||||||||||||||||||||||||||||||||||
| 18.6.1. Seasonal adjustment | ||||||||||||||||||||||||||||||||||||||
Not requested. |
||||||||||||||||||||||||||||||||||||||
|
|||
|
|||
|
|||