|
 |
| For any question on data and metadata, please contact: Eurostat user support |
|
|||
| 1.1. Contact organisation | Institut national de la statistique et des études économiques (STATEC) |
||
| 1.2. Contact organisation unit | ENT3 - Structural Business Statistics |
||
| 1.5. Contact mail address | STATEC B.P. 304 L-2013 Luxembourg |
||
|
|||
| 2.1. Metadata last certified | 02/03/2021 | ||
| 2.2. Metadata last posted | 02/03/2021 | ||
| 2.3. Metadata last update | 02/03/2021 | ||
|
||||||||||||||||||||||||||||||||||||||||||||||||
| 3.1. Data description | ||||||||||||||||||||||||||||||||||||||||||||||||
The Community Innovation Survey (CIS) is a survey about innovation activities in enterprises. The survey is designed to collect information on different types of innovation, various aspects of the development of an innovation, objectives of innovation activities, sources of information, public funding or expenditure on innovation. It is aim is to measure the innovativeness of sectors and enable the analysis of the factors of innovation. The CIS provides statistics by type of innovators, economic activities and size class of enterprises. The survey is currently carried out every two years across the EU Member States, EFTA countries and EU candidate countries.
In order to ensure comparability across countries, Eurostat together with the countries developed a Harmonised Data Collection (HDC) questionnaire accompanied by a set of definitions and methodological recommendations.
CIS 2018 concepts and its underlying methodology are based on the Oslo Manual (2018) 4th Edition.
New review of the CIS2018 aims to meet several objectives : 1: Reduce subjectivity and biases in the main CIS indicators 2: Improve reporting about innovation activities and capabilities in the firm 3: Ensure international comparability (including compliance with the OM4) 4: Broaden the basis of CIS information on enterprise management 5: Take better account of the diversity of enterprises in the EU 6: Improve reporting about external drivers and enablers of innovation 7: Improve timeliness 8: Ensure the feasibility of data collection 9: Ensure continuity with the CIS 2016 10: Improve reporting about the output and impact of innovation
CIS2018 is conducted under Commission Regulation No 995/2012. This Regulation defines the mandatory target population of the survey referring to enterprises in the Core NACE economic sectors (see section 3.3.) with at least 10 employees. Further activities may be covered on a voluntary basis in national datasets. Most statistics are based on the 3-year reference period (t, t-1, t-2), but some use only one calendar year (t or t-2).
Please consider CIS t to be the survey that refers to the same year of the quality report and CIS t-2 to be the previous survey e.g.: CIS 2018= CIS t then, CIS t-2=CIS 2016 |
||||||||||||||||||||||||||||||||||||||||||||||||
| 3.2. Classification system | ||||||||||||||||||||||||||||||||||||||||||||||||
Indicators related to the enterprises are classified by country, economic activity (NACE Rev. 2), size class of enterprises and type of innovation.
The main typology of classification of enterprises in reference to innovation is the distinction between innovation-active enterprises (INN) and not innovation-active enterprises (NINN). The enterprise is considered as innovative (INN) if during the reference period it successfully introduced a product or business process innovation, had ongoing innovation activities, abandoned innovation activities or was engaged in in-house R&D or R&D contracted out. Non-innovative (NINN) enterprises had no innovation activity mentioned above whatsoever during the reference period. |
||||||||||||||||||||||||||||||||||||||||||||||||
| 3.3. Coverage - sector | ||||||||||||||||||||||||||||||||||||||||||||||||
CIS covers main economic sectors according to NACE Rev.2 broken down by size class of enterprises and type of innovation activity. |
||||||||||||||||||||||||||||||||||||||||||||||||
| 3.3.1. Main economic sectors covered - NACE Rev.2 | ||||||||||||||||||||||||||||||||||||||||||||||||
In accordance with Commission Regulation 995/2012 on innovation statistics, the following industries and services are included in the core target population. Results are made available with the following breakdowns : All NACE – Core NACE (NACE Rev. 2 sections & divisions B-C-D-E-46-H-J-K-71-72-73 )
CORE INDUSTRY (excluding construction) (NACE Rev. 2 SECTIONS B_C_D_E) 10-12: Manufacture of food products, beverages and tobacco 13-15: Manufacture of textiles, wearing apparel, leather and related products 16-18: Manufacture of wood, paper, printing and reproduction 20: Manufacture of chemicals and chemical products 21: Manufacture of basic pharmaceutical products and pharmaceutical preparations 19-22: Manufacture of petroleum, chemical, pharmaceutical, rubber and plastic products 23: Manufacture of other non-metallic mineral products 24: Manufacture of basic metals 25: Manufacture of fabricated metal products, except machinery and equipment 26: Manufacture of computer, electronic and optical products 25-30: Manufacture of fabricated metal products (except machinery and equipment), computer, electronic and optical products, electrical equipment, motor vehicles and other transport equipment 31-33: Manufacture of furniture; jewellery, musical instruments, toys; repair and installation of machinery and equipment
D: ELECTRICITY, GAS, STEAM AND AIR CONDITIONING SUPPLY
E: WATER SUPPLY; SEWERAGE, WASTE MANAGEMENT AND REMEDIATION ACTIVITIES 36: Water collection, treatment and supply 37-39: Sewerage, waste management, remediation activities
CORE SERVICES (NACE Rev. 2 sections & divisions 46-H-J-K-71-72-73)(NACE code in the tables = G46-M73_INN) 46: Wholesale trade, except of motor vehicles and motorcycles
H: TRANSPORTATION AND STORAGE 49-51: Land transport and transport via pipelines, water transport and air transport 52-53: Warehousing and support activities for transportation and postal and courier activities
J: INFORMATION AND COMMUNICATION 58: Publishing activities 61: Telecommunications 62: Computer programming, consultancy and related activities 63: Information service activities
K: FINANCIAL AND INSURANCE ACTIVITIES 64: Financial service activities, except insurance and pension funding 65: Insurance, reinsurance and pension funding, except compulsory social security 66: Activities auxiliary to financial services and insurance activities
M: PROFESSIONAL, SCIENTIFIC AND TECHNICAL ACTIVITIES 71: Architectural and engineering activities; technical testing and analysis 72: Scientific research and development 73: Advertising and market research 71-73: Architectural and engineering activities; technical testing and analysis; Scientific research and development; Advertising and market research
|
||||||||||||||||||||||||||||||||||||||||||||||||
| 3.3.1.1. Main economic sectors covered - NACE Rev.2 - national particularities | ||||||||||||||||||||||||||||||||||||||||||||||||
All the mandatory sectors listed above are included in the target population. In order to be in line with the SBS frame population (for size classes of 10 employees or more), concepts such as market activity and economic territory are also considered when defining the frame population. |
||||||||||||||||||||||||||||||||||||||||||||||||
| 3.3.2. Sector coverage - size class | ||||||||||||||||||||||||||||||||||||||||||||||||
In accordance with Commission Regulation 995/2012 on innovation statistics, the following size classes of enterprises according to the number of employees are included in the core target population of the CIS:
|
||||||||||||||||||||||||||||||||||||||||||||||||
| 3.3.2.1. Sector coverage - size class - national particularities | ||||||||||||||||||||||||||||||||||||||||||||||||
No deviation. |
||||||||||||||||||||||||||||||||||||||||||||||||
| 3.4. Statistical concepts and definitions | ||||||||||||||||||||||||||||||||||||||||||||||||
The description of concepts, definitions and main statistical variables is available in the CIS 2018 European metadata file (ESMS) Results of the community innovation survey 2018 (CIS2018) (inn_cis11) in Eurostat database. |
||||||||||||||||||||||||||||||||||||||||||||||||
| 3.5. Statistical unit | ||||||||||||||||||||||||||||||||||||||||||||||||
The survey unit used is the "enterprise" as defined in the Luxembourg Business Register. Each survey invitation sent to the enterprises, as well as each online questionnaire, contains a list of legal units that constitute the "enterprise" and that are to be taken into account when responding to the survey. |
||||||||||||||||||||||||||||||||||||||||||||||||
| 3.6. Statistical population | ||||||||||||||||||||||||||||||||||||||||||||||||
Core target population are all enterprises in CORE NACE activities (see 3.3.1) with 10 or more employees. |
||||||||||||||||||||||||||||||||||||||||||||||||
| 3.7. Reference area | ||||||||||||||||||||||||||||||||||||||||||||||||
For Luxembourg, the regional dimension (NUTS) is not available in the national survey. |
||||||||||||||||||||||||||||||||||||||||||||||||
| 3.8. Coverage - Time | ||||||||||||||||||||||||||||||||||||||||||||||||
Several rounds of Community Innovation Survey have been conducted so far at two-year interval since end of 90’s. |
||||||||||||||||||||||||||||||||||||||||||||||||
| 3.8.1. Participation in the CIS waves | ||||||||||||||||||||||||||||||||||||||||||||||||
*two reference periods can be distinguished for CIS light: 2000-2002 and 2001-2003 |
||||||||||||||||||||||||||||||||||||||||||||||||
| 3.9. Base period | ||||||||||||||||||||||||||||||||||||||||||||||||
Not relevant. |
||||||||||||||||||||||||||||||||||||||||||||||||
|
|||
CIS indicators are available according to 3 units of measure:
NR: Number for the number of enterprises and the number of persons employed. THS_EUR: Thousands of euros. All financial variables are provided in thousands of euros, i.e. Turnover or Innovation expenditure. PC: Percentage. The percentage is the ratio between the selected combinations of indicators. |
|||
|
|||
For CIS 2018, the time covered by the survey is the 3-year period from the beginning of 2016 to the end of 2018. Some questions and indicators refer to one year — 2018. The list of indicators covering the 3-year period and referring to one year according to the HDC is available in the Annex section of the European metadata (ESMS). |
|||
|
|||
| 6.1. Institutional Mandate - legal acts and other agreements | |||
CIS surveys are based on the Commission Regulation No 995/2012, implementing Decision No 1608/2003/EC of the European Parliament and of the Council on the production and development of Community statistics on science and technology. This Regulation establishes innovation statistics on a statutory basis and makes the delivery of certain variables compulsory e.g. innovation activities, cooperation, development, expenditures and turnover (see the Regulation). Each survey wave may additionally include further variables. In addition, the Regulation defines the obligatory cross-coverage of economic sectors and size class of enterprises. |
|||
| 6.1.1. National legislation | |||
This survey is carried out under Regulation (EC) No 995/2012 of 26 October 2012 laying down detailed rules for the implementation of Decision No 1608/2003/EC of the European Parliament and of the Council concerning the production and development of Community statistics on science and technology and on the basis of article 2 of the Law of 10 July 2011 establishing the Institut national de la statistique et des études économiques (STATEC). |
|||
| 6.2. Institutional Mandate - data sharing | |||
Not requested. |
|||
|
|||
CIS data are transmitted to Eurostat via EDAMIS using the secured transmission system. |
|||
| 7.1. Confidentiality - policy | |||
Under the terms of the Law of 10 July 2011 establishing STATEC, according to article 16, STATEC guarantees the non-disclosure of confidential data. |
|||
| 7.2. Confidentiality - data treatment | |||
Quantitative variables The basis for any suppression pattern is the software package tau-Argus. However, the process also involves manual procedures, i.e. checking the tau-Argus output, comparing the historical data series and addressing linked table disclosure risks (see secondary confidentiality for further details). The statistical disclosure control procedures are not performed for every variable individually but only for specific primary shadow variables, i.e. "Turnover" & "Intramural R&D expenditure". If a given cell is confidential for that variable (no matter if primary or secondary), the same cell will be suppressed for all the other available quantitative variables. Variables relating to e-commerce turnover are also checked individually, an pass their flags on to related qualitative variables as well. Primary confidentiality rules a) Sensitivity rule: We apply the (n,k)-dominance rule, i.e. a cell is suppressed if n units separately or jointly dominate the total value of a cell by at least k% . b) Minimum frequency rule: For any cells that are left after applying the sensitivity rule, a minimum frequency is applied. A cell is suppressed if there are less than n units in a given cell. Secondary confidentiality rules a) Secondary suppression within a table - A cell is suppressed for secondary confidentiality if n units dominate jointly or separately the confidential total value by at least k% ; b) Secondary suppression due to linked tables disclosure risks - historical disclosure: in conformity with the SDC handbook, we ensure that no historical cell is compromised by disclosing the same cell for the current reference year. As long as there is any significant link with prior-year data, a cell may not be disclosed for the current reference year. - Links to any other statistics: Turnover of the CIS survey is compared to the SBS preliminary series of the same reference year (e.g. T-1 for the survey carried out in year T). |
|||
|
|||
| 8.1. Release calendar | |||
Not available. |
|||
| 8.2. Release calendar access | |||
Not available. |
|||
| 8.3. Release policy - user access | |||
Not available. |
|||
|
|||
CIS is conducted and disseminated at a two-year interval in pair years. |
|||
|
|||||||||||||||
Accessibility and clarity refer to the simplicity and ease for users to access statistics using a simple and user-friendly procedure, obtaining them in an expected form and within an acceptable time period, with the appropriate user information and assistance: a global context which finally enables them to make optimum use of the statistics. |
|||||||||||||||
| 10.1. Dissemination format - News release | |||||||||||||||
See below. |
|||||||||||||||
| 10.1.1. Availability of the releases | |||||||||||||||
|
|||||||||||||||
| 10.2. Dissemination format - Publications | |||||||||||||||
- Online database (containing all/most results) : yes - Analytical publication (referring to all/most results) : - Analytical publication (referring to specific results, e.g. only for one sector or one specific aspect). |
|||||||||||||||
| 10.3. Dissemination format - online database | |||||||||||||||
On-line database available (for a selection of indicators)
|
|||||||||||||||
| 10.3.1. Data tables - consultations | |||||||||||||||
Not requested. |
|||||||||||||||
| 10.4. Dissemination format - microdata access | |||||||||||||||
Only to the researchers from Division RED - Applied Research (unit ANEC/STATEC). |
|||||||||||||||
| 10.4.1. Dissemination of microdata | |||||||||||||||
|
|||||||||||||||
| 10.5. Dissemination format - other | |||||||||||||||
No other means of dissemination. |
|||||||||||||||
| 10.5.1. Metadata - consultations | |||||||||||||||
Not requested. |
|||||||||||||||
| 10.6. Documentation on methodology | |||||||||||||||
A dedicated section on methodology, legal base and the list of publication related to the topic. A statistical dictionary is available for a better understanding of the indicators https://statistiques.public.lu/fr/methodologie/definitions/index.html |
|||||||||||||||
| 10.6.1. Metadata completeness - rate | |||||||||||||||
Not requested. |
|||||||||||||||
| 10.7. Quality management - documentation | |||||||||||||||
No quality-related documents are available yet. |
|||||||||||||||
|
|||
| 11.1. Quality assurance | |||
In order to assure good quality and comparability, the survey is based on CIS harmonised questionnaire without any deviation and on the methodological guidelines that accompanied this survey. The different steps of the survey ensure that the process meets the requirements for statistical production: stratified sample selection, reminders and checks of data being collected, adjustment for item non-response etc. |
|||
| 11.2. Quality management - assessment | |||
Several changes were introduced to the national CIS data collection and validation procedures starting with CIS 2014 survey what led to the improvement of the data quality:
Data validation has been strengthened by a series of newly validation programs. |
|||
|
||||||||||||
| 12.1. Relevance - User Needs | ||||||||||||
Statec's research department was consulted when the questionnaire was elaborated. Some additional national questions and modules were also requested, some of which were added after discussions between statisticians and researchers on the quality, comparability and applicability of the questions. |
||||||||||||
| 12.1.1. Needs at national level | ||||||||||||
|
||||||||||||
| 12.2. Relevance - User Satisfaction | ||||||||||||
No national survey has been carried out. However, STATEC's research unit is regularly consulted when the questionnaire is designed and they usually provide feedback on the results. |
||||||||||||
| 12.3. Completeness | ||||||||||||
All mandatory variables were collected. |
||||||||||||
| 12.3.1. Data completeness - rate | ||||||||||||
Not requested. |
||||||||||||
|
||||||||||||||||||||||||||||||||||||||||||||||||||||
Closeness of computations or estimates to the exact or true values that the statistics were intended to measure. |
||||||||||||||||||||||||||||||||||||||||||||||||||||
| 13.1. Accuracy - overall | ||||||||||||||||||||||||||||||||||||||||||||||||||||
Accuracy in the statistical sense denotes the closeness of computations or estimates to the exact or true values. Statistics are not equal with the true values because of variability (the statistics change from implementation to implementation of the survey due to random effects) and bias (the average of the possible values of the statistics from implementation to implementation is not equal to the true value due to systematic effects). |
||||||||||||||||||||||||||||||||||||||||||||||||||||
| 13.2. Sampling error | ||||||||||||||||||||||||||||||||||||||||||||||||||||
That part of the difference between a population value and an estimate thereof, derived from a random sample, which is due to the fact that only a subset of the population is enumerated. |
||||||||||||||||||||||||||||||||||||||||||||||||||||
| 13.2.1. Sampling error - indicators | ||||||||||||||||||||||||||||||||||||||||||||||||||||
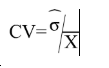
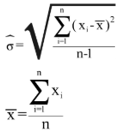
The main indicator used to measure sampling errors for CIS data is the coefficient of variation (CV).
Coefficient of Variation= (Square root of the estimate of the sampling variance) / (Estimated value) Formula: where
|
||||||||||||||||||||||||||||||||||||||||||||||||||||
| 13.2.1.1. Coefficient of variations for key variables | ||||||||||||||||||||||||||||||||||||||||||||||||||||
| Restricted from publication | ||||||||||||||||||||||||||||||||||||||||||||||||||||
| 13.2.1.2. Variance estimation method | ||||||||||||||||||||||||||||||||||||||||||||||||||||
Estimations of the variables of interest were performed with the calibrated weights. For a sufficiently large sample size, the calibration estimator is equivalent to the linear regression estimator and its bias tends to be minor. Consequently, the variance of the estimation is based on the residuals resulting from the relationship between the variable of interest and the ancillary variables which have been used for the calibration.
|
||||||||||||||||||||||||||||||||||||||||||||||||||||
| 13.3. Non-sampling error | ||||||||||||||||||||||||||||||||||||||||||||||||||||
Non-sampling errors occur in all phases of a survey. They add to the sampling errors (if present) and contribute to decreasing overall accuracy. It is important to assess their relative weight in the total error and devote appropriate resources for their control and assessment. |
||||||||||||||||||||||||||||||||||||||||||||||||||||
| 13.3.1. Coverage error | ||||||||||||||||||||||||||||||||||||||||||||||||||||
Coverage errors (or frame errors) are due to divergences between the target population and the frame population. The frame population is the set of target population members that has a chance to be selected into the survey sample. It is a listing of all items in the population from which the sample is drawn that contains contact details as well as sufficient information to perform stratification and sampling. |
||||||||||||||||||||||||||||||||||||||||||||||||||||
| 13.3.1.1. Over-coverage - rate | ||||||||||||||||||||||||||||||||||||||||||||||||||||
Not requested. |
||||||||||||||||||||||||||||||||||||||||||||||||||||
| 13.3.1.2. Common units - proportion | ||||||||||||||||||||||||||||||||||||||||||||||||||||
Not requested. |
||||||||||||||||||||||||||||||||||||||||||||||||||||
| 13.3.1.3. Under covered groups of the target population | ||||||||||||||||||||||||||||||||||||||||||||||||||||
Core coverage as specified in the CIS methodological recommendations, mandatory NACE Rev.2 sections and divisions of the core target population. |
||||||||||||||||||||||||||||||||||||||||||||||||||||
| 13.3.1.4. Coverage errors in coefficient variation | ||||||||||||||||||||||||||||||||||||||||||||||||||||
Not applicable. |
||||||||||||||||||||||||||||||||||||||||||||||||||||
| 13.3.2. Measurement error | ||||||||||||||||||||||||||||||||||||||||||||||||||||
Measurement errors occur during data collection and generate bias by recording values different than the true ones. The survey questionnaire used for data collection may have led to the recording of wrong values, or there may be respondent or interviewer bias. |
||||||||||||||||||||||||||||||||||||||||||||||||||||
| 13.3.2.1. Measures for reducing measurement errors | ||||||||||||||||||||||||||||||||||||||||||||||||||||
Error detection is an integral part of data collection and processing activities. Automated checks are applied to data records during the collection to identify reporting and entry errors. These audits identify potential errors in key totals and ratios that exceed tolerance thresholds, as well as problems with the consistency of the data collected. |
||||||||||||||||||||||||||||||||||||||||||||||||||||
| 13.3.3. Non response error | ||||||||||||||||||||||||||||||||||||||||||||||||||||
Non response occurs when a survey fails to collect data on all survey variables from all the population units designated for data collection in a sample or complete enumeration. There are two types of non-response: 1) Unit non-response, which occurs when no data (or so little as to be unusable) are collected about a population unit designated for data collection. a) Un-weighted unit non-response rate (%) = 100*(Number of units with no response or not usable response) / (Total number of in-scope (eligible) units in the sample) b) Weighted unit non-response rate (%) = 100*(Number of weighted units with no response or not usable response) / (Total number of in-scope (eligible) units in the sample) 2) Item non-response, which occurs when only data on some, but not all survey data items are collected about a population unit designated for data collection. a) Un-weighted item non-response rate (%) = 100*(Number of units with no response at all for the item) / (Total number of eligible, for the item, units in the sample i.e. filters have to be taken into account)
The difference between the statistics computed from the collected data and those that would be computed if there were no missing values. |
||||||||||||||||||||||||||||||||||||||||||||||||||||
| 13.3.3.1. Unit non-response - rate | ||||||||||||||||||||||||||||||||||||||||||||||||||||
See below. |
||||||||||||||||||||||||||||||||||||||||||||||||||||
| 13.3.3.1.1. Un-weighted and weighted unit non-response rate by NACE categories and for enterprises with 10 or more employees | ||||||||||||||||||||||||||||||||||||||||||||||||||||
| Restricted from publication | ||||||||||||||||||||||||||||||||||||||||||||||||||||
| 13.3.3.1.2. Maximum number of recalls/reminders before coding | ||||||||||||||||||||||||||||||||||||||||||||||||||||
In order to reduce the non-response, 3 reminders are sent (with a registered letter to high-impact enterprises, on the 3rd reminder). |
||||||||||||||||||||||||||||||||||||||||||||||||||||
| 13.3.3.2. Item non-response - rate | ||||||||||||||||||||||||||||||||||||||||||||||||||||
See below. |
||||||||||||||||||||||||||||||||||||||||||||||||||||
| 13.3.3.2.1. Item non-response rate for Turnover (in Core NACE: B-C-D-E-46-H-J-K-71-72-73 enterprises with 10 or more employees) | ||||||||||||||||||||||||||||||||||||||||||||||||||||
Item non-response rate for Turnover (in Core NACE: B-C-D-E-46-H-J-K-71-72-73 enterprises with 10 or more employees).
|
||||||||||||||||||||||||||||||||||||||||||||||||||||
| 13.3.3.2.2. Item non response rate for new questions | ||||||||||||||||||||||||||||||||||||||||||||||||||||
Item non-response rate for new questions in CIS t (in Core NACE: B-C-D-E-46-H-J-K-71-72-73 enterprises with 10 or more employees)
|
||||||||||||||||||||||||||||||||||||||||||||||||||||
| 13.3.4. Processing error | ||||||||||||||||||||||||||||||||||||||||||||||||||||
The data entry method was the online questionnaire for 97% of the responses; the remaining 3% of paper questionnaires were entered using a data entry application developed in-house. The data entry method was the online questionnaire for 99% of the responses; the remaining 1% of paper questionnaires were entered using a data entry application developed in-house. An extensive validation process of the data is carried out. One part of the validations is integrated in the data collection in the dynamic web-questionnaire; another part is carried out after the data collection using micro- and macro validation techniques. The individual reports from the enterprises are compared to former years reports and the registered information on the number of employees and turnover. Outlier detection is also used as a validation process. |
||||||||||||||||||||||||||||||||||||||||||||||||||||
| 13.3.5. Model assumption error | ||||||||||||||||||||||||||||||||||||||||||||||||||||
Not requested. |
||||||||||||||||||||||||||||||||||||||||||||||||||||
|
|||
Timeliness and punctuality refer to time and dates, but in a different manner. |
|||
| 14.1. Timeliness | |||
The timeliness of statistics reflects the length of time between data availability and the event or phenomenon they describe. |
|||
| 14.1.1. Time lag - first result | |||
Timeliness of national data – date of first release of national level : November 2020 |
|||
| 14.1.2. Time lag - final result | |||
Not requested. |
|||
| 14.2. Punctuality | |||
Punctuality refers to the time lag between the release date of data and the target date on which they were scheduled for release as announced officially. |
|||
| 14.2.1. Punctuality - delivery and publication | |||
Date of transmission of complete and validated data to Eurostat (Number of days between that data and 30 June 2020) : 123 days. |
|||
|
||||||||||||||||||||||||||
Comparability aims at measuring the impact of differences in applied statistical concepts and definitions on the comparison of statistics between geographical areas, non-geographical domains, or over time. The coherence of statistical outputs refers to the degree to which the statistical processes by which they were generated used the same concepts (classifications, definitions, and target populations) and harmonised methods. Coherent statistical outputs have the potential to be validly combined and used jointly. |
||||||||||||||||||||||||||
| 15.1. Comparability - geographical | ||||||||||||||||||||||||||
Delivery of data to Eurostat follows the rules laid down in the regulation, which means that the data cover the types of activities and size classes of enterprises, which are defined by the regulation. Thereby the statistics are comparable to the similar statistics of other EU countries for the types of activities and size classes covered by the statistics. |
||||||||||||||||||||||||||
| 15.1.1. Asymmetry for mirror flow statistics - coefficient | ||||||||||||||||||||||||||
Not requested. |
||||||||||||||||||||||||||
| 15.1.2. National questionnaire – compliance with Eurostat model questionnaire | ||||||||||||||||||||||||||
Methodological deviations from the CIS Harmonised Data Collection (HDC)
|
||||||||||||||||||||||||||
| 15.1.3. National questionnaire – additional questions | ||||||||||||||||||||||||||
Methodological deviations from the CIS Harmonised Data Collection (HDC)
|
||||||||||||||||||||||||||
| 15.2. Comparability - over time | ||||||||||||||||||||||||||
Due to important methodological changes in CIS 2018 driven by Oslo Manual 2018, the data 2018 cannot be directly compared with previous CIS waves. |
||||||||||||||||||||||||||
| 15.2.1. Length of comparable time series | ||||||||||||||||||||||||||
Not requested. |
||||||||||||||||||||||||||
| 15.3. Coherence - cross domain | ||||||||||||||||||||||||||
See the comparison between SBS and CIS data in the section 15.3.3 below. |
||||||||||||||||||||||||||
| 15.3.1. Coherence - sub annual and annual statistics | ||||||||||||||||||||||||||
Not requested. |
||||||||||||||||||||||||||
| 15.3.2. Coherence - National Accounts | ||||||||||||||||||||||||||
Not requested. |
||||||||||||||||||||||||||
| 15.3.3. Coherence – Structural Business Statistics (SBS) | ||||||||||||||||||||||||||
| Restricted from publication | ||||||||||||||||||||||||||
| 15.4. Coherence - internal | ||||||||||||||||||||||||||
Not requested. |
||||||||||||||||||||||||||
|
|||
Confidential information on the production cost of the CIS. |
|||
|
|||
| 17.1. Data revision - policy | |||
Not requested. |
|||
| 17.2. Data revision - practice | |||
Not requested. |
|||
| 17.2.1. Data revision - average size | |||
Not requested. |
|||
|
||||||||||||||||||||||||||||||||||||||
| 18.1. Source data | ||||||||||||||||||||||||||||||||||||||
See below: |
||||||||||||||||||||||||||||||||||||||
| 18.1.1. Sampling frame (or census frame) | ||||||||||||||||||||||||||||||||||||||
The sample is drawn from the national business register and takes into account additional treatments and consolidations performed in SBS. |
||||||||||||||||||||||||||||||||||||||
| 18.1.2. Sampling design | ||||||||||||||||||||||||||||||||||||||
The frame population was stratified using the following criteria: - 3 size classes (i.e. 10-49, 50-249, 250+ employees) - 26 NACE categories (B05_09, C10_12, C13_15, C16_18, C19_22, C23_23, C24_24, C25_30, C31_33, D35, E36_39, G46, H49_51, H52_53, J58, J59, J60, J61, J62, J63, K64, K65, K66, M71, M72, M73) - A dummy variable on whether the unit had applied for LU public grants for R&D. This lead to the creation of 156 strata, 95 of which were not empty. The method used for sampling was a stratified random sample, with varying sampling rates depending on size class:
Units that received or applied for an R&D grant were sampled at 100%. |
||||||||||||||||||||||||||||||||||||||
| 18.1.3. Target population and sample size | ||||||||||||||||||||||||||||||||||||||
|
||||||||||||||||||||||||||||||||||||||
| 18.1.4. Data source for pre-filled variables | ||||||||||||||||||||||||||||||||||||||
Variables and indicators filled or prefilled from other sources.
|
||||||||||||||||||||||||||||||||||||||
| 18.1.5. Data source and variables used for derivation and weighting | ||||||||||||||||||||||||||||||||||||||
|
||||||||||||||||||||||||||||||||||||||
| 18.2. Frequency of data collection | ||||||||||||||||||||||||||||||||||||||
According to the Commission Regulation (UE) 995/2012, the innovation statistics shall be provided to Eurostat every two years in each even year. The data collection takes place every second year in year t-2 preceding the data provision. |
||||||||||||||||||||||||||||||||||||||
| 18.3. Data collection | ||||||||||||||||||||||||||||||||||||||
Systematic process of gathering data for official statistics. |
||||||||||||||||||||||||||||||||||||||
| 18.3.1. Survey participation | ||||||||||||||||||||||||||||||||||||||
Mandatory |
||||||||||||||||||||||||||||||||||||||
| 18.3.2. Survey type | ||||||||||||||||||||||||||||||||||||||
Data are collected from a combination of a sample survey and a census. |
||||||||||||||||||||||||||||||||||||||
| 18.3.3. Combination of sample survey and census data | ||||||||||||||||||||||||||||||||||||||
The method used for sampling was a stratified random sample, with varying sampling rates depending on size class:
Strata containing less than 10 units were sampled at 100%. |
||||||||||||||||||||||||||||||||||||||
| 18.3.4. Census criteria | ||||||||||||||||||||||||||||||||||||||
• Enterprises with >50 employees; • Enterprises that received or applied for an R&D grant were sampled at 100%; • Strata containing less than 10 units were sampled at 100%. |
||||||||||||||||||||||||||||||||||||||
| 18.3.5. Data collection method | ||||||||||||||||||||||||||||||||||||||
Data collection method
|
||||||||||||||||||||||||||||||||||||||
| 18.4. Data validation | ||||||||||||||||||||||||||||||||||||||
Not requested. |
||||||||||||||||||||||||||||||||||||||
| 18.5. Data compilation | ||||||||||||||||||||||||||||||||||||||
Operations performed on data to derive new information according to a given set of rules. |
||||||||||||||||||||||||||||||||||||||
| 18.5.1. Imputation - rate | ||||||||||||||||||||||||||||||||||||||
Imputation is the method of creating plausible (but artificial) substitute values for all those missing. Definition of imputation rate: Imputation rate (for the variable x) (%) = 100*(Number of replaced values) / (Total number of values for a given variable) Definition of weighted imputation rate: Weighted imputation rate= 100*(Number of total weighted replaced values) / (Total number of weighted values for a given variable) |
||||||||||||||||||||||||||||||||||||||
| 18.5.1.1. Imputation rate for metric variables | ||||||||||||||||||||||||||||||||||||||
Imputation rate for metric variables by NACE categories and for enterprises with 10 or more employees:
(1) = Total turnover in the last year of the reference period (t) (TUR) (2) = Share of the turnover in the last year of the reference period (t) due to new or improved product new to the market in the total turnover for product innovative enterprises TUR_PRD_NEW_MKT/TUR(INNO_PRD) (3) = R&D expenditure performed in-house (EXP_INNO_RND_IH) |
||||||||||||||||||||||||||||||||||||||
| 18.5.2. Weights calculation | ||||||||||||||||||||||||||||||||||||||
Weights calculation method for sample surveys
|
||||||||||||||||||||||||||||||||||||||
| 18.6. Adjustment | ||||||||||||||||||||||||||||||||||||||
In order to obtain reliable results for quantitative variables (that are in line with SBS totals) the corrected weights are calibrated using to the number of units and employment per stratum as auxiliary information. Calibration is carried out in R, using the calib method of the sampling package with a logit distance function. |
||||||||||||||||||||||||||||||||||||||
| 18.6.1. Seasonal adjustment | ||||||||||||||||||||||||||||||||||||||
Not requested. |
||||||||||||||||||||||||||||||||||||||
|
|||
|
|||
|
|||