|
 |
| For any question on data and metadata, please contact: Eurostat user support |
|
|||
| 1.1. Contact organisation | Statistical Service of Cyprus |
||
| 1.2. Contact organisation unit | Science and Technology Statistics Unit |
||
| 1.5. Contact mail address | Statistical Service of Cyprus CY-1444 Nicosia |
||
|
|||
| 2.1. Metadata last certified | 16/11/2020 | ||
| 2.2. Metadata last posted | 16/11/2020 | ||
| 2.3. Metadata last update | 16/11/2020 | ||
|
||||||||||||||||||||||||||||||||||||||||||||||||
| 3.1. Data description | ||||||||||||||||||||||||||||||||||||||||||||||||
The Community Innovation Survey (CIS) is a survey about innovation activities in enterprises. The survey is designed to collect the information on different types of innovation, various aspects of the development of an innovation, objectives of innovation activities, sources of information, public funding or expenditure on innovation. It is aim is to measure the innovativeness of sectors and enable the analysis of the factors of innovation. The CIS provides statistics by type of innovators, economic activities and size class of enterprises. The survey is currently carried out every two years across the EU Member States, EFTA countries and EU candidate countries.
In order to ensure comparability across countries, Eurostat together with the countries developed a Harmonised Data Collection (HDC) questionnaire accompanied by a set of definitions and methodological recommendations.
CIS 2018 concepts and its underlying methodology are based on the Oslo Manual (2018) 4th Edition.
New review of the CIS2018 aims to meet several objectives : 1: Reduce subjectivity and biases in the main CIS indicators 2: Improve reporting about innovation activities and capabilities in the firm 3: Ensure international comparability (including compliance with the OM4) 4: Broaden the basis CIS information on enterprise management 5: Take better account the diversity of enterprises in the EU 6: Improve reporting about external drivers and enablers of innovation 7: Improve timeliness 8: Ensure the feasibility of data collection 9: Ensure continuity with the CIS 2016 10: Improve reporting about the output and impact of innovation
CIS2018 is conducted under Commission Regulation No 995/2012. This Regulation defines the mandatory target population of the survey referring to enterprises in the Core NACE economic sectors (see section 3.3.) with at least 10 employees. Further activities may be covered on a voluntary basis in national datasets. Most statistics are based on the 3-year reference period (t, t-1, t-2), but some use only one calendar year (t or t-2).
Please consider CIS t to be the survey that refers to the same year of the quality report and CIS t-2 to be the previous survey e.g.: CIS 2018= CIS t then, CIS t-2=CIS 2016 |
||||||||||||||||||||||||||||||||||||||||||||||||
| 3.2. Classification system | ||||||||||||||||||||||||||||||||||||||||||||||||
Indicators related to the enterprises are classified by country, economic activity (NACE Rev. 2), size class of enterprises and type of innovation.
The main typology of classification of enterprises in reference to innovation is the distinction between innovation-active enterprises (INN) and not innovation-active enterprises (NINN). The enterprise is considered as innovative (INN) if during the reference period it successfully introduced a product or business process innovation, had ongoing innovation activities, abandoned innovation activities or was engaged in in-house R&D or R&D contracted out. Non-innovative (NINN) enterprises had no innovation activity mentioned above whatsoever during the reference period. |
||||||||||||||||||||||||||||||||||||||||||||||||
| 3.3. Coverage - sector | ||||||||||||||||||||||||||||||||||||||||||||||||
CIS covers main economic sectors according to NACE Rev.2 broken down by size class of enterprises and type of innovation activity. |
||||||||||||||||||||||||||||||||||||||||||||||||
| 3.3.1. Main economic sectors covered - NACE Rev.2 | ||||||||||||||||||||||||||||||||||||||||||||||||
In accordance with Commission Regulation 995/2012 on innovation statistics, the following industries and services are included in the core target population. Results are made available with these following breakdowns : All NACE – Core NACE (NACE Rev. 2 sections & divisions B-C-D-E-46-H-J-K-71-72-73 )
CORE INDUSTRY (excluding construction) (NACE Rev. 2 SECTIONS B_C_D_E) 10-12: Manufacture of food products, beverages and tobacco 13-15: Manufacture of textiles, wearing apparel, leather and related products 16-18: Manufacture of wood, paper, printing and reproduction 20: Manufacture of chemicals and chemical products 21: Manufacture of basic pharmaceutical products and pharmaceutical preparations 19-22: Manufacture of petroleum, chemical, pharmaceutical, rubber and plastic products 23: Manufacture of other non-metallic mineral products 24: Manufacture of basic metals 25: Manufacture of fabricated metal products, except machinery and equipment 26: Manufacture of computer, electronic and optical products 25-30: Manufacture of fabricated metal products (except machinery and equipment), computer, electronic and optical products, electrical equipment, motor vehicles and other transport equipment 31-33: Manufacture of furniture; jewellery, musical instruments, toys; repair and installation of machinery and equipment
D: ELECTRICITY, GAS, STEAM AND AIR CONDITIONING SUPPLY
E: WATER SUPPLY; SEWERAGE, WASTE MANAGEMENT AND REMEDIATION ACTIVITIES 36: Water collection, treatment and supply 37-39: Sewerage, waste management, remediation activities
CORE SERVICES (NACE Rev. 2 sections & divisions 46-H-J-K-71-72-73)(NACE code in the tables = G46-M73_INN) 46: Wholesale trade, except of motor vehicles and motorcycles
H: TRANSPORTATION AND STORAGE 49-51: Land transport and transport via pipelines, water transport and air transport 52-53: Warehousing and support activities for transportation and postal and courier activities
J: INFORMATION AND COMMUNICATION 58: Publishing activities 61: Telecommunications 62: Computer programming, consultancy and related activities 63: Information service activities
K: FINANCIAL AND INSURANCE ACTIVITIES 64: Financial service activities, except insurance and pension funding 65: Insurance, reinsurance and pension funding, except compulsory social security 66: Activities auxiliary to financial services and insurance activities
M: PROFESSIONAL, SCIENTIFIC AND TECHNICAL ACTIVITIES 71: Architectural and engineering activities; technical testing and analysis 72: Scientific research and development 73: Advertising and market research 71-73: Architectural and engineering activities; technical testing and analysis; Scientific research and development; Advertising and market research
|
||||||||||||||||||||||||||||||||||||||||||||||||
| 3.3.1.1. Main economic sectors covered - NACE Rev.2 - national particularities | ||||||||||||||||||||||||||||||||||||||||||||||||
The entire core target population was covered. No non-core activities were added |
||||||||||||||||||||||||||||||||||||||||||||||||
| 3.3.2. Sector coverage - size class | ||||||||||||||||||||||||||||||||||||||||||||||||
In accordance with Commission Regulation 995/2012 on innovation statistics, the following size classes of enterprises according to number of employees are included in the core target population of the CIS:
|
||||||||||||||||||||||||||||||||||||||||||||||||
| 3.3.2.1. Sector coverage - size class - national particularities | ||||||||||||||||||||||||||||||||||||||||||||||||
No national particularities. |
||||||||||||||||||||||||||||||||||||||||||||||||
| 3.4. Statistical concepts and definitions | ||||||||||||||||||||||||||||||||||||||||||||||||
The description of concepts, definitions and main statistical variables is available in CIS 2018 European metadata file (ESMS) Results of the community innovation survey 2018 (CIS2018) (inn_cis11) in Eurostat database. |
||||||||||||||||||||||||||||||||||||||||||||||||
| 3.5. Statistical unit | ||||||||||||||||||||||||||||||||||||||||||||||||
It is the business enterprise. |
||||||||||||||||||||||||||||||||||||||||||||||||
| 3.6. Statistical population | ||||||||||||||||||||||||||||||||||||||||||||||||
Core target population are all enterprises in CORE NACE activities (see 3.3.1) with 10 or more employees. |
||||||||||||||||||||||||||||||||||||||||||||||||
| 3.7. Reference area | ||||||||||||||||||||||||||||||||||||||||||||||||
All statistical surveys in Cyprus cover all economic activities in the Government controlled area only. |
||||||||||||||||||||||||||||||||||||||||||||||||
| 3.8. Coverage - Time | ||||||||||||||||||||||||||||||||||||||||||||||||
Several rounds of Community Innovation Survey have been conducted so far at two-year interval since end of 90’s.
|
||||||||||||||||||||||||||||||||||||||||||||||||
| 3.8.1. Participation in the CIS waves | ||||||||||||||||||||||||||||||||||||||||||||||||
*two reference periods can be distinguished for CIS light: 2000-2002 and 2001-2003
|
||||||||||||||||||||||||||||||||||||||||||||||||
| 3.9. Base period | ||||||||||||||||||||||||||||||||||||||||||||||||
Not relevant. |
||||||||||||||||||||||||||||||||||||||||||||||||
|
|||
CIS indicators are available according to 3 units of measure:
NR: Number for number of enterprises and number of persons employed. THS_EUR: Thousands of euros. All financial variables are provided in thousands of euros, i.e. Turnover or Innovation expenditure. PC: Percentage. The percentage is the ratio between the selected combinations of indicators. |
|||
|
|||
For CIS 2018, the time covered by the survey is the 3-year period from the beginning of 2016 to the end of 2018. Some questions and indicators refer to one year — 2018. The list of indicators covering the 3-year period and referring to one year according to the HDC is available in the Annex section of the European metadata (ESMS). |
|||
|
|||
See below. |
|||
| 6.1. Institutional Mandate - legal acts and other agreements | |||
CIS surveys are based on the Commission Regulation No 995/2012, implementing Decision No 1608/2003/EC of the European Parliament and of the Council on the production and development of Community statistics on science and technology. This Regulation establishes innovation statistics on a statutory basis and makes the delivery of certain variables compulsory e.g. innovation activities, cooperation, development, expenditures and turnover (see the Regulation). Each survey wave may additionally include further variables. In addition, the Regulation defines the obligatory cross-coverage of economic sectors and size class of enterprises. |
|||
| 6.1.1. National legislation | |||
CIS surveys are based on the Commission Regulation No 995/2012, implementing Decision No 1608/2003/EC of the European Parliament and of the Council on the production and development of Community statistics on science and technology. This Regulation establishes innovation statistics on a statutory basis and makes the delivery of certain variables compulsory e.g. innovation activities, cooperation, development, expenditures and turnover. (see the Regulation). Each survey wave may additionally include further variables. In addition, the Regulation defines the obligatory cross-coverage of economic sectors and size class of enterprises |
|||
| 6.2. Institutional Mandate - data sharing | |||
Not requested. |
|||
|
|||
CIS data are transmitted to Eurostat via EDAMIS using the secured transmission system. |
|||
| 7.1. Confidentiality - policy | |||
The survey is carried out in accordance with the Statistics Law, No. 15(I) of 2000. The Statistical Service is obliged, under the provisions of the Statistics Law, to treat all the information collected as confidential. All the information collected is used solely for statistical purposes. No data for any individual enterprise is published or disclosed to either public bodies or private individuals. Data which have been gathered from sources which are accessible to the public are not considered as confidential. All data collected remain confidential, even after the publication of results.
All members of staff have legal confidentiality commitments. They are required to take an oath, in accordance with the provisions of the Statistics Law, No. 15(I) of 2000, that they will not disclose information which they have received during the conduct of the survey. This obligation continues to exist after the termination of their professional relationship with the Statistical Service.
CIS data are transmitted to Eurostat via EDAMIS using Eurostat's consignment. This safe, secure procedure guarantees a method of tracking transmission. All necessary steps are taken to ensure that the EDAMIS system is working at national level.
Official statistics are released in accordance to all confidentiality provisions of the following:
Links to all of the above documents:
|
|||
| 7.2. Confidentiality - data treatment | |||
Under the provisions of the Statistics Law, No. 15(I) of 2000, the statistics published should not allow for the direct or indirect identification of the sampling units. Cells with less than 3 enterprises are flagged as confidential. No dominance rule is applied for primary or secondary confidentiality. Data from sources accessible to the public are not considered as confidential.
The treatment of confidential data is regulated by CYSTAT's Code of Practice for the Collection, Publication and Storage of Statistical Data.
Links to the documents mentioned:
|
|||
|
|||
See below. |
|||
| 8.1. Release calendar | |||
Not applicable. No specific release policy or release calendar for the data set in question (CIS) exists. |
|||
| 8.2. Release calendar access | |||
Not applicable. No specific release calendar for the data set in question (CIS) exists. |
|||
| 8.3. Release policy - user access | |||
According to the Dissemination and Pricing Policy of the Statistical Service of Cyprus (section 2.3) CYSTAT΄s main channel for dissemination of statistics is the website, which offers the same conditions to everyone and is updated at the same time every working day (12:00 noon). Privileged pre-released access (of no more than 1 day in advance) has been granted to a few selected users for specific statistics. These are specified in the Dissemination Policy (section 2.3).
In addition to the annual release calendar, users are informed of the various statistical releases through the “Alert” service provided by CYSTAT.
Link to the Dissemination and Pricing Policy should be attached (or the actual document):
http://www.mof.gov.cy/mof/cystat/statistics.nsf/dissemination_en/dissemination_en?OpenDocument |
|||
|
|||
CIS is conducted and disseminated at two-year interval in pair years. |
|||
|
|||||||||||||||
Accessibility and clarity refer to the simplicity and ease for users to access statistics using simple and user-friendly procedure, obtaining them in an expected form and within an acceptable time period, with the appropriate user information and assistance: a global context which finally enables them to make optimum use of the statistics. |
|||||||||||||||
| 10.1. Dissemination format - News release | |||||||||||||||
See below 10.1.1. |
|||||||||||||||
| 10.1.1. Availability of the releases | |||||||||||||||
|
|||||||||||||||
| 10.2. Dissemination format - Publications | |||||||||||||||
- Online database (containing all/most results) : No - Analytical publication (referring to all/most results) : General paper and online publications with key data included in the statistical yearbook entitled “Statistical Abstract” and in other multi-domain publications such as the pocketbook “Cyprus in Figures” - Analytical publication (referring to specific results, e.g. only for one sector or one specific aspect) : No |
|||||||||||||||
| 10.3. Dissemination format - online database | |||||||||||||||
No online database exists. |
|||||||||||||||
| 10.3.1. Data tables - consultations | |||||||||||||||
Not requested. |
|||||||||||||||
| 10.4. Dissemination format - microdata access | |||||||||||||||
See below |
|||||||||||||||
| 10.4.1. Dissemination of microdata | |||||||||||||||
Statistical micro-data from CYSTAT’s surveys are accessible for research purposes only and under strict provisions as described below: Under the provisions of the Statistics Law, CYSTAT may release microdata for the sole use of scientific research. Applicants have to submit the request form "APPLICATION FOR DATA FOR RESEARCH PURPOSES" giving thorough information on the project for which micro-data are needed. The application is evaluated by CYSTAT’s Confidentiality Committee and if the application is approved, a charge is fixed according to the volume and time consumed for preparation of the data. Micro-data may then be released after an anonymisation process which ensures no direct identification of the statistical units but, at the same time, ensures usability of the data. The link for the application is attached below. Link to the application for access to microdata on CYSTAT's website: http://www.cystat.gov.cy/mof/cystat/statistics.nsf/dissemination_en/dissemination_en?OpenDocument |
|||||||||||||||
| 10.5. Dissemination format - other | |||||||||||||||
See below |
|||||||||||||||
| 10.5.1. Metadata - consultations | |||||||||||||||
Not requested. |
|||||||||||||||
| 10.6. Documentation on methodology | |||||||||||||||
Each data file loaded on the web site is accompanied by a press release and a comprehensive methodological note, giving information on the innovation survey and its scope, the concepts and definitions used, as well as assistance on how to interpret the tables published. |
|||||||||||||||
| 10.6.1. Metadata completeness - rate | |||||||||||||||
Not requested. |
|||||||||||||||
| 10.7. Quality management - documentation | |||||||||||||||
Users can download free of charge from the web site of the Statistical Service of Cyprus the key results (as MS Excel files) of the various rounds of innovation surveys carried out in Cyprus. Each data file is accompanied by a press release and a comprehensive methodological note, giving information on the surveys and their scope, concepts and definitions, as well as assistance on how to interpret the tables published. For any further information, users can address a request to the Statistical Service (by phone, mail, e-mail or via the enquiries facility on the web site). Users seem to be fully satisfied. |
|||||||||||||||
|
|||
See below. |
|||
| 11.1. Quality assurance | |||
The quality of statistics in CYSTAT is managed in the framework of the European Statistics Code of Practice which sets the standards for developing, producing and disseminating European Statistics as well as the ESS Quality Assurance Framework (QAF). CYSTAT endorses the Quality Declaration of the European Statistical System. In addition, CYSTAT is guided by the requirements provided for in Article 12 of the Statistics Law No. 15(I) of 2000 as well as Article 12 of Regulation (EC) No 223/2009 on European statistics, which sets out the quality criteria to be applied in the development, production and dissemination of European statistics.
Links to all of the above documents:
|
|||
| 11.2. Quality management - assessment | |||
The CIS 2018 carried out in Cyprus is assessed to have reached high levels of quality. To this effect, the mandatory nature of the survey (in accordance with the provisions of the national Statistics Law, No 15(I) of 2000) and the practice of carrying out face to face interviews at the enterprises premises played a vital and decisive role. The CIS2018 survey has been the third CIS (the first was CIS2014) to implement the Computer Assisted Personal Interviewing (CAPI) method. A specially developed BLAISE programme (enumerators version) was used for this survey for data entry and most consistency tests. Controls and consistency checks were included in the BLAISE programme in order to identify possible errors. Also, help screens and warning messages for data entry errors, internal inconsistencies or quality errors are provided by the programme, minimizing the possibility of having any such errors. All enumerators employed attended a comprehensive training session, during which the questionnaire, the BLAISE program and the concepts involved were thoroughly explained, examples on what qualified as innovation were given and problems expected to be encountered in the field were identified. Consequently, they were skilled enough to properly guide the respondents through the questionnaire, to clarify concepts and definitions and to make sure that the possibility of having internal inconsistencies or quality errors in the questionnaires is kept to a minimum. The use of skilled enumerators is the usual practice with all business surveys in Cyprus, resulting in extremely high unit response rates and negligible item nonresponse, thus rendering the conduct of a non-response analysis as unnecessary. The electronically completed questionnaires were checked again in the office with the specially developed for this survey BLAISE programme (supervisors version). This included additional quality checking and correcting for any remaining logical inconsistencies, comparing with the responses provided by the same unit in the previous CIS 2016, consulting the respective structural business and R&D questionnaires, etc. Data analysis and processing was done using MS Excel spreadsheets. Additional controls and validation checks were included in order to identify any remaining errors. The Eurostat methodological guidelines and recommendations and the provisions of Commission Regulation (EC) No 995/2012 on innovation statistics were respected. |
|||
|
|||||||||||||||||||||
Relevance is the degree to which statistics meet current and potential users’ needs. It includes the production of all needed statistics and the extent to which concepts used (definitions, classifications etc.) reflect user needs. The aim is to describe the extent to which the statistics are useful to, and used by, the broadest array of users. For this purpose, statisticians need to compile information, firstly about their users and their needs. The CIS is based on a common questionnaire and a common survey methodology in order to achieve comparable, harmonised and high quality results for EU Member States, EFTA countries, Candidates and Associated countries. |
|||||||||||||||||||||
| 12.1. Relevance - User Needs | |||||||||||||||||||||
There is no involvement of users at national level in the final national questionnaire design. The questionnaire used at national level corresponds fully to the core questionnaire agreed at European level. For the time being, no unmet users’ needs at national level have come to our attention and thus no specific actions are planned to satisfy such needs. |
|||||||||||||||||||||
| 12.1.1. Needs at national level | |||||||||||||||||||||
|
|||||||||||||||||||||
| 12.2. Relevance - User Satisfaction | |||||||||||||||||||||
In the latest national user satisfaction survey, innovation statistics were listed down explicitly as one of the main statistical fields to be commented on. However, the number of questionnaires with relevant comments was extremely limited and does not allow for adequate conclusions to be made. No specific problems were reported.
Since 2008 (with the exception of 2010 and 2013) CYSTAT carries out an annual online “Users Satisfaction Survey”. Overall, the users of statistical data published by CYSTAT are satisfied.
|
|||||||||||||||||||||
| 12.3. Completeness | |||||||||||||||||||||
The national standard CIS 2018 output tabulation is complete; there exist no missing cells, either compulsory or voluntary (for voluntary questions covered in national questionnaire). |
|||||||||||||||||||||
| 12.3.1. Data completeness - rate | |||||||||||||||||||||
Not requested. |
|||||||||||||||||||||
|
||||||||||||||||||||||||||||||||||||||||||||||||||||
See below. |
||||||||||||||||||||||||||||||||||||||||||||||||||||
| 13.1. Accuracy - overall | ||||||||||||||||||||||||||||||||||||||||||||||||||||
Accuracy in the statistical sense denotes the closeness of computations or estimates to the exact or true values. Statistics are not equal with the true values because of variability (the statistics change from implementation to implementation of the survey due to random effects) and bias (the average of the possible values of the statistics from implementation to implementation is not equal to the true value due to systematic effects). |
||||||||||||||||||||||||||||||||||||||||||||||||||||
| 13.2. Sampling error | ||||||||||||||||||||||||||||||||||||||||||||||||||||
That part of the difference between a population value and an estimate thereof, derived from a random sample, which is due to the fact that only a subset of the population is enumerated. |
||||||||||||||||||||||||||||||||||||||||||||||||||||
| 13.2.1. Sampling error - indicators | ||||||||||||||||||||||||||||||||||||||||||||||||||||
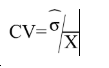
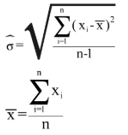
The main indicator used to measure sampling errors for CIS data is the coefficient of variation (CV).
Coefficient of Variation= (Square root of the estimate of the sampling variance) / (Estimated value) Formula: where
|
||||||||||||||||||||||||||||||||||||||||||||||||||||
| 13.2.1.1. Coefficient of variations for key variables | ||||||||||||||||||||||||||||||||||||||||||||||||||||
Coefficient of variation (%) for key variables by NACE categories and for enterprises with 10 and more employees
[1] = Coefficient of variation for the percentage of innovative enterprises (INN) in the total population of enterprises (ENT18) |
||||||||||||||||||||||||||||||||||||||||||||||||||||
| 13.2.1.2. Variance estimation method | ||||||||||||||||||||||||||||||||||||||||||||||||||||
The variance was calculated using the formula given in section 13.2.1. Sample design and weighting were taken into account. |
||||||||||||||||||||||||||||||||||||||||||||||||||||
| 13.3. Non-sampling error | ||||||||||||||||||||||||||||||||||||||||||||||||||||
Non-sampling errors occur in all phases of a survey. They add to the sampling errors (if present) and contribute to decreasing overall accuracy. It is important to assess their relative weight in the total error and devote appropriate resources for their control and assessment. |
||||||||||||||||||||||||||||||||||||||||||||||||||||
| 13.3.1. Coverage error | ||||||||||||||||||||||||||||||||||||||||||||||||||||
Coverage errors (or frame errors) are due to divergences between the target population and the frame population. The frame population is the set of target population members that has a chance to be selected into the survey sample. It is a listing of all items in the population from which the sample is drawn that contains contact details as well as sufficient information to perform stratification and sampling. |
||||||||||||||||||||||||||||||||||||||||||||||||||||
| 13.3.1.1. Over-coverage - rate | ||||||||||||||||||||||||||||||||||||||||||||||||||||
Not requested. |
||||||||||||||||||||||||||||||||||||||||||||||||||||
| 13.3.1.2. Common units - proportion | ||||||||||||||||||||||||||||||||||||||||||||||||||||
Not requested. |
||||||||||||||||||||||||||||||||||||||||||||||||||||
| 13.3.1.3. Under covered groups of the target population | ||||||||||||||||||||||||||||||||||||||||||||||||||||
No coverage or frame errors exist. |
||||||||||||||||||||||||||||||||||||||||||||||||||||
| 13.3.1.4. Coverage errors in coefficient variation | ||||||||||||||||||||||||||||||||||||||||||||||||||||
Not applicable. No coverage or frame errors exist. |
||||||||||||||||||||||||||||||||||||||||||||||||||||
| 13.3.2. Measurement error | ||||||||||||||||||||||||||||||||||||||||||||||||||||
Measurement errors occur during data collection and generate bias by recording values different than the true ones. The survey questionnaire used for data collection may have led to the recording of wrong values, or there may be respondent or interviewer bias. |
||||||||||||||||||||||||||||||||||||||||||||||||||||
| 13.3.2.1. Measures for reducing measurement errors | ||||||||||||||||||||||||||||||||||||||||||||||||||||
No measurement errors have been identified.
The CIS2018 survey has been the third CIS (the first was CIS2014) to implement the Computer Assisted Personal Interviewing (CAPI) method. A specially developed BLAISE programme (enumerator’s version) was used for this survey for data entry and most consistency tests. Controls and consistency checks were included in the BLAISE programme in order to identify possible errors. Also, help screens and warning messages for data entry errors, internal inconsistencies or quality errors are provided by the programme, minimizing the possibility of having any such errors. All enumerators employed attended a comprehensive training session, during which the questionnaire, the BLAISE program and the concepts involved were thoroughly explained, examples on what qualified as innovation were given and problems expected to be encountered in the field were identified. Consequently, they were skilled enough to properly guide the respondents through the questionnaire, to clarify concepts and definitions and to make sure that the possibility of having internal inconsistencies or quality errors in the questionnaires is kept to a minimum. The use of skilled enumerators is the usual practice with all business surveys in Cyprus. |
||||||||||||||||||||||||||||||||||||||||||||||||||||
| 13.3.3. Non response error | ||||||||||||||||||||||||||||||||||||||||||||||||||||
Non response occurs when a survey fails to collect data on all survey variables from all the population units designated for data collection in a sample or complete enumeration. There are two types of non-response: 1) Unit non-response, which occurs when no data (or so little as to be unusable) are collected about a population unit designated for data collection. a) Un-weighted unit non-response rate (%) = 100*(Number of units with no response or not usable response) / (Total number of in-scope (eligible) units in the sample) b) Weighted unit non-response rate (%) = 100*(Number of weighted units with no response or not usable response) / (Total number of in-scope (eligible) units in the sample) 2) Item non-response, which occurs when only data on some, but not all survey data items are collected about a population unit designated for data collection. a) Un-weighted item non-response rate (%) = 100*(Number of units with no response at all for the item) / (Total number of eligible, for the item, units in the sample i.e. filters have to be taken into account) |
||||||||||||||||||||||||||||||||||||||||||||||||||||
| 13.3.3.1. Unit non-response - rate | ||||||||||||||||||||||||||||||||||||||||||||||||||||
See below. |
||||||||||||||||||||||||||||||||||||||||||||||||||||
| 13.3.3.1.1. Un-weighted and weighted unit non-response rate by NACE categories and for enterprises with 10 or more employees | ||||||||||||||||||||||||||||||||||||||||||||||||||||
Un-weighted and weighted unit non-response rate by NACE categories and for enterprises with 10 or more employees
The number of eligible units is the number of sample units, which indeed belong to the target population. |
||||||||||||||||||||||||||||||||||||||||||||||||||||
| 13.3.3.1.2. Maximum number of recalls/reminders before coding | ||||||||||||||||||||||||||||||||||||||||||||||||||||
Not applicable. There exists no unit non-response. |
||||||||||||||||||||||||||||||||||||||||||||||||||||
| 13.3.3.2. Item non-response - rate | ||||||||||||||||||||||||||||||||||||||||||||||||||||
See below. |
||||||||||||||||||||||||||||||||||||||||||||||||||||
| 13.3.3.2.1. Item non-response rate for Turnover (in Core NACE: B-C-D-E-46-H-J-K-71-72-73 enterprises with 10 or more employees) | ||||||||||||||||||||||||||||||||||||||||||||||||||||
Item non-response rate for Turnover (in Core NACE: B-C-D-E-46-H-J-K-71-72-73 enterprises with 10 or more employees).
Comment: No imputation for turnover. Information from Structural Business and R&D surveys were used. |
||||||||||||||||||||||||||||||||||||||||||||||||||||
| 13.3.3.2.2. Item non response rate for new questions | ||||||||||||||||||||||||||||||||||||||||||||||||||||
Item non-response rate for new questions in CIS t (in Core NACE: B-C-D-E-46-H-J-K-71-72-73 enterprises with 10 or more employees)
|
||||||||||||||||||||||||||||||||||||||||||||||||||||
| 13.3.4. Processing error | ||||||||||||||||||||||||||||||||||||||||||||||||||||
Between data collection and the beginning of statistical analysis on the base of the statistics produced, data must undergo a certain processing: coding, data entry, data editing, imputation, etc. Errors introduced at these stages are called processing errors. Data editing identifies inconsistencies in the data which usually represent errors. 13.3.4.1. Data entry method Data collection was carried out by face to face interviewing at the enterprises’ premises, using the Computer Assisted Personal Interviewing (CAPI) method. For data entry and editing, the BLAISE program was used. Data were exported in MS Excel for further checks, analyses and tabulations. 13.3.4.2. Editing process and method During the face to face interview, respondents were instructed on what qualifies as innovation and were guided in completing the questionnaire in the best possible way thus ensuring that item non response was kept to a minimum. Using the Computer Assisted Personal Interviewing (CAPI) method all electronically completed questionnaires were thoroughly checked by controls and validation checks and corrected for any logical inconsistencies by the BLAISE data entry and editing programme. If required, respondents were contacted again over the phone. For the basic economic information (turnover and employment), auxiliary sources (such as the structural business and R&D surveys) were used. For data analysis and processing, data from BLAISE were exported to MS Excel spreadsheets. Additional controls and validation checks were included in order to eliminate any remaining errors. 13.3.4.3. Coding errors No coding errors have been identified. 13.3.4.4. Effect of processing errors in the coefficient of variation The CVs reported in section 13.2.1 incorporate the effects of any processing errors. |
||||||||||||||||||||||||||||||||||||||||||||||||||||
| 13.3.5. Model assumption error | ||||||||||||||||||||||||||||||||||||||||||||||||||||
Not requested. |
||||||||||||||||||||||||||||||||||||||||||||||||||||
|
|||
Timeliness and punctuality refer to time and dates, but in a different manner. |
|||
| 14.1. Timeliness | |||
The timeliness of statistics reflects the length of time between data availability and the event or phenomenon they describe. |
|||
| 14.1.1. Time lag - first result | |||
Timeliness of national data – date of first release of national level : December 2020 |
|||
| 14.1.2. Time lag - final result | |||
Not requested. |
|||
| 14.2. Punctuality | |||
Punctuality refers to the time lag between the release date of data and the target date on which they were scheduled for release as announced officially. |
|||
| 14.2.1. Punctuality - delivery and publication | |||
Date of transmission of complete and validated data to Eurostat (Number of days between that date and 30 June 2020) -1 Data provided on 29 June 2020. |
|||
|
||||||||||||||||||||
Comparability aims at measuring the impact of differences in applied statistical concepts and definitions on the comparison of statistics between geographical areas, non-geographical domains, or over time. The coherence of statistical outputs refers to the degree to which the statistical processes by which they were generated used the same concepts (classifications, definitions, and target populations) and harmonised methods. Coherent statistical outputs have the potential to be validly combined and used jointly. |
||||||||||||||||||||
| 15.1. Comparability - geographical | ||||||||||||||||||||
This part focuses on reporting the deviations from the harmonised CIS questionnaire (see below). Cypus followed the same international standards, concepts and definitions (Oslo manual and Eurostat guidelines) at the whole territory and there is not discrepancy at national level and in comparison to remaining EU countries. Cyprus is one area in all NUTS levels. |
||||||||||||||||||||
| 15.1.1. Asymmetry for mirror flow statistics - coefficient | ||||||||||||||||||||
Not requested. |
||||||||||||||||||||
| 15.1.2. National questionnaire – compliance with Eurostat model questionnaire | ||||||||||||||||||||
Methodological deviations from the CIS Harmonised Data Collection (HDC) The EU-harmonised core version of the questionnaire was used in full, with no deviations. All compulsory questions were included. Non-mandatory HDC question(s) (voluntary questions) that Cyprus drop in the CIS 2018 national questionnaire are: From Section 2 : Strategies and Knowledge Flows, the following questions and parameters: Questions 2.2 to 2.4 (CONC and CONC_USR and CONC_TUR_PRD) Questions 2.7 and 2.8 (IPR_IN and PUR_TSERV) Questions 2.10 and 2.11 (CKNO and MORG)
From Section 3: Innovation, the following questions and parameters: Question 3.5 (EXPEC_INNO_PRD) Question 3.8 (EXPCT_INNO_PCS) Question 3.10 (the last 3 non-mandatory parameters EXP_INNO_INN_XRND_OWN_PER and EXP_INNO_INN_XRND_SMSP and EXP_INNO_INN_XRND_CGO) Question 3.11 (all the parameters for 2020 compared to 2019) Question 3.17 (LEG)
From Section 4: Basic information on your enterprise, the following questions and parameters: Question 4.2 [EMPUD] All questions from 4.4 to 4.9
|
||||||||||||||||||||
| 15.1.3. National questionnaire – additional questions | ||||||||||||||||||||
Methodological deviations from the CIS Harmonised Data Collection (HDC)
|
||||||||||||||||||||
| 15.2. Comparability - over time | ||||||||||||||||||||
Due to important methodological changes in CIS 2018 driven by Oslo Manual 2018, the data 2018 cannot be directly compared with previous CIS waves. |
||||||||||||||||||||
| 15.2.1. Length of comparable time series | ||||||||||||||||||||
Not requested. |
||||||||||||||||||||
| 15.3. Coherence - cross domain | ||||||||||||||||||||
See the comparison between SBS and CIS data in the section 15.3.3 below. |
||||||||||||||||||||
| 15.3.1. Coherence - sub annual and annual statistics | ||||||||||||||||||||
Not requested. |
||||||||||||||||||||
| 15.3.2. Coherence - National Accounts | ||||||||||||||||||||
Not requested. |
||||||||||||||||||||
| 15.3.3. Coherence – Structural Business Statistics (SBS) | ||||||||||||||||||||
This part compares key variables for aggregated CIS data with SBS data
* Numbers are to be provided for the last year of the reference period (t) Comment - NACE divisions 64-66 were excluded from the calculations of relative difference between SBS and CIS 2018 data, since they are not covered in the national SBS survey. - Part of the differences may be explained by the different definition of the “enterprise” between SBS and CIS. |
||||||||||||||||||||
| 15.4. Coherence - internal | ||||||||||||||||||||
Not requested. |
||||||||||||||||||||
|
|||
Confidential information on the production cost of the CIS. |
|||
|
|||
See below. |
|||
| 17.1. Data revision - policy | |||
Not requested. |
|||
| 17.2. Data revision - practice | |||
Not requested. |
|||
| 17.2.1. Data revision - average size | |||
Not requested. |
|||
|
||||||||||||||||||||||||||||||||||||||
See below. |
||||||||||||||||||||||||||||||||||||||
| 18.1. Source data | ||||||||||||||||||||||||||||||||||||||
See below. |
||||||||||||||||||||||||||||||||||||||
| 18.1.1. Sampling frame (or census frame) | ||||||||||||||||||||||||||||||||||||||
The official, up-to-date, statistical business register was used. |
||||||||||||||||||||||||||||||||||||||
| 18.1.2. Sampling design | ||||||||||||||||||||||||||||||||||||||
The Eurostat guidelines and recommendations regarding sample design were followed. A census of enterprises with 20 or more employees was taken for all NACE activities while for the size class 10-19 a sample was drawn. The sample was drawn on the basis of the economic activity (at the NACE Rev. 2 three-digit level) and the enterprise size (according to the number of employees). The selection of the sample within each stratum was done by simple random sampling without replacement, with known selection probabilities. |
||||||||||||||||||||||||||||||||||||||
| 18.1.3. Target population and sample size | ||||||||||||||||||||||||||||||||||||||
|
||||||||||||||||||||||||||||||||||||||
| 18.1.4. Data source for pre-filled variables | ||||||||||||||||||||||||||||||||||||||
Variables and indicators filled or prefilled from other sources.
|
||||||||||||||||||||||||||||||||||||||
| 18.1.5. Data source and variables used for derivation and weighting | ||||||||||||||||||||||||||||||||||||||
|
||||||||||||||||||||||||||||||||||||||
| 18.2. Frequency of data collection | ||||||||||||||||||||||||||||||||||||||
According to the Commission Regulation (UE) 995/2012, the innovation statistics shall be provided to Eurostat every two years in each even year. The data collection takes place every second year in year t-2 preceding the data provision. |
||||||||||||||||||||||||||||||||||||||
| 18.3. Data collection | ||||||||||||||||||||||||||||||||||||||
See below. |
||||||||||||||||||||||||||||||||||||||
| 18.3.1. Survey participation | ||||||||||||||||||||||||||||||||||||||
The survey was mandatory, in accordance with the provisions of the national Statistics Law, No. 15(I) of 2000. |
||||||||||||||||||||||||||||||||||||||
| 18.3.2. Survey type | ||||||||||||||||||||||||||||||||||||||
A combination of a census and a sample survey was used. |
||||||||||||||||||||||||||||||||||||||
| 18.3.3. Combination of sample survey and census data | ||||||||||||||||||||||||||||||||||||||
For all NACE Rev. 2 activities, complete enumeration (census) of enterprises with 20 or more employees was taken. Enterprises in the size class 10-19 employees were selected by sampling. |
||||||||||||||||||||||||||||||||||||||
| 18.3.4. Census criteria | ||||||||||||||||||||||||||||||||||||||
The only criterion used to distinguish whether a census or a sample would be conducted was size class: a census was conducted in enterprises with 20 or more employees for all NACE activities.
|
||||||||||||||||||||||||||||||||||||||
| 18.3.5. Data collection method | ||||||||||||||||||||||||||||||||||||||
Data collection method
Comment: Data collection was carried out by face-to-face interviewing at the enterprises’ premises; this is the usual practice with all business surveys in Cyprus. The interview was computer assisted. Persons interviewed normally comprised high level executives of the enterprise, such as the director-general, production and/or quality manager, R&D manager, finance director, etc. |
||||||||||||||||||||||||||||||||||||||
| 18.4. Data validation | ||||||||||||||||||||||||||||||||||||||
Not requested. |
||||||||||||||||||||||||||||||||||||||
| 18.5. Data compilation | ||||||||||||||||||||||||||||||||||||||
Operations performed on data to derive new information according to a given set of rules. |
||||||||||||||||||||||||||||||||||||||
| 18.5.1. Imputation - rate | ||||||||||||||||||||||||||||||||||||||
Imputation is the method of creating plausible (but artificial) substitute values for all those missing. Definition of imputation rate: Imputation rate (for the variable x) (%) = 100*(Number of replaced values) / (Total number of values for a given variable) Definition of weighted imputation rate: Weighted imputation rate= 100*(Number of total weighted replaced values) / (Total number of weighted values for a given variable) |
||||||||||||||||||||||||||||||||||||||
| 18.5.1.1. Imputation rate for metric variables | ||||||||||||||||||||||||||||||||||||||
Imputation rate for metric variables by NACE categories and for enterprises with 10 or more employees:
(1) = Total turnover in the last year of the reference period (t) (TUR) (2) = Share of the turnover in the last year of the reference period (t) due to new or improved product new to the market in the total turnover for product innovative enterprises TUR_PRD_NEW_MKT/TUR(INNO_PRD) (3) = R&D expenditure performed in-house (EXP_INNO_RND_IH) |
||||||||||||||||||||||||||||||||||||||
| 18.5.2. Weights calculation | ||||||||||||||||||||||||||||||||||||||
Weights calculation method for sample surveys
|
||||||||||||||||||||||||||||||||||||||
| 18.6. Adjustment | ||||||||||||||||||||||||||||||||||||||
No non-response analysis was deemed necessary, as the survey had resulted in extremely high response rates. There was no need for adjustment/calibration of the weights. |
||||||||||||||||||||||||||||||||||||||
| 18.6.1. Seasonal adjustment | ||||||||||||||||||||||||||||||||||||||
Not requested. |
||||||||||||||||||||||||||||||||||||||
|
|||
|
|||
|
|||
| CIS2018 Cyprus Questionnaire (Greek version) CIS2018 Cyprus Questionnaire (English version) |
|||