|
 |
| For any question on data and metadata, please contact: Eurostat user support |
|
|||
| 1.1. Contact organisation | National Statistical Institute of Bulgaria |
||
| 1.2. Contact organisation unit | Science, Innovation and Information Society Department |
||
| 1.5. Contact mail address | 2, P. Volov str., Sofia 1038, Bulgaria |
||
|
|||
| 2.1. Metadata last certified | 29/01/2021 | ||
| 2.2. Metadata last posted | 29/01/2021 | ||
| 2.3. Metadata last update | 29/01/2021 | ||
|
||||||||||||||||||||||||||||||||||||||||||||||||
| 3.1. Data description | ||||||||||||||||||||||||||||||||||||||||||||||||
The Community Innovation Survey (CIS) is a survey about innovation activities in enterprises. The survey is designed to collect the information on different types of innovation, various aspects of the development of an innovation, objectives of innovation activities, cooperation, public funding or expenditure on innovation. It is aim is to measure the innovativeness of sectors and enable the analysis of the factors of innovation. The CIS provides statistics by type of innovators, economic activities and size class of enterprises. The survey is currently carried out every two years across the EU Member States, EFTA countries and EU candidate countries.
In order to ensure comparability across countries, Eurostat together with the countries developed a Harmonised Data Collection (HDC) questionnaire accompanied by a set of definitions and methodological recommendations.
CIS 2018 concepts and its underlying methodology are based on the Oslo Manual (2018) 4th Edition.
New review of the CIS2018 aims to meet several objectives: 1: Reduce subjectivity and biases in the main CIS indicators 2: Improve reporting about innovation activities and capabilities in the firm 3: Ensure international comparability (including compliance with the OM4) 4: Broaden the basis CIS information on enterprise management 5: Take better account the diversity of enterprises in the EU 6: Improve reporting about external drivers and enablers of innovation 7: Improve timeliness 8: Ensure the feasibility of data collection 9: Ensure continuity with the CIS 2016 10: Improve reporting about the output and impact of innovation
CIS2018 is conducted under Commission Regulation (EU) No 995/2012. This Regulation defines the mandatory target population of the survey referring to enterprises in the Core NACE economic sectors (see section 3.3.) with at least 10 employees. Further activities may be covered on a voluntary basis in national datasets. Most statistics are based on the 3-year reference period (t, t-1, t-2), but some use only one calendar year (t or t-2).
Please consider CIS t to be the survey that refers to the same year of the quality report and CIS t-2 to be the previous survey e.g.: CIS 2018= CIS t then, CIS t-2=CIS 2016. |
||||||||||||||||||||||||||||||||||||||||||||||||
| 3.2. Classification system | ||||||||||||||||||||||||||||||||||||||||||||||||
Indicators related to the enterprises are classified by country, economic activity (NACE Rev. 2), size class of enterprises and type of innovation.
The main typology of classification of enterprises in reference to innovation is the distinction between innovation-active enterprises (INN) and not innovation-active enterprises (NINN). The enterprise is considered as innovative (INN) if during the reference period it successfully introduced a product or business process innovation, had ongoing innovation activities, abandoned innovation activities or was engaged in in-house R&D or R&D contracted out. Non-innovative (NINN) enterprises had no innovation activity mentioned above whatsoever during the reference period.
The classifications used for the innovation data sets produced are: - Statistical classification of economic activities (NACE Rev.2); - Classification of territorial units for statistical purposes in Bulgaria (NUTS). |
||||||||||||||||||||||||||||||||||||||||||||||||
| 3.3. Coverage - sector | ||||||||||||||||||||||||||||||||||||||||||||||||
CIS covers main economic sectors according to NACE Rev.2 broken down by size class of enterprises and type of innovation activity. |
||||||||||||||||||||||||||||||||||||||||||||||||
| 3.3.1. Main economic sectors covered - NACE Rev.2 | ||||||||||||||||||||||||||||||||||||||||||||||||
In accordance with Commission Regulation (EU) No 995/2012 on innovation statistics, the following industries and services are included in the core target population. Results are made available with these following breakdowns:
All NACE – Core NACE (NACE Rev. 2 sections & divisions B-C-D-E-46-H-J-K-71-72-73)
CORE INDUSTRY (excluding construction) (NACE Rev. 2 SECTIONS B_C_D_E)
B: MINING AND QUARRYING
C: MANUFACTURING 10-12: Manufacture of food products, beverages and tobacco 13-15: Manufacture of textiles, wearing apparel, leather and related products 16-18: Manufacture of wood, paper, printing and reproduction 20: Manufacture of chemicals and chemical products 21: Manufacture of basic pharmaceutical products and pharmaceutical preparations 19-22: Manufacture of petroleum, chemical, pharmaceutical, rubber and plastic products 23: Manufacture of other non-metallic mineral products 24: Manufacture of basic metals 25: Manufacture of fabricated metal products, except machinery and equipment 26: Manufacture of computer, electronic and optical products 25-30: Manufacture of fabricated metal products (except machinery and equipment), computer, electronic and optical products, electrical equipment, motor vehicles and other transport equipment 31-33: Manufacture of furniture; jewellery, musical instruments, toys; repair and installation of machinery and equipment
D: ELECTRICITY, GAS, STEAM AND AIR CONDITIONING SUPPLY
E: WATER SUPPLY; SEWERAGE, WASTE MANAGEMENT AND REMEDIATION ACTIVITIES 36: Water collection, treatment and supply 37-39: Sewerage, waste management, remediation activities
CORE SERVICES (NACE Rev. 2 sections & divisions 46-H-J-K-71-72-73)(NACE code in the tables = G46-M73_INN) 46: Wholesale trade, except of motor vehicles and motorcycles
H: TRANSPORTATION AND STORAGE 49-51: Land transport and transport via pipelines, water transport and air transport 52-53: Warehousing and support activities for transportation and postal and courier activities
J: INFORMATION AND COMMUNICATION 58: Publishing activities 61: Telecommunications 62: Computer programming, consultancy and related activities 63: Information service activities
K: FINANCIAL AND INSURANCE ACTIVITIES 64: Financial service activities, except insurance and pension funding 65: Insurance, reinsurance and pension funding, except compulsory social security 66: Activities auxiliary to financial services and insurance activities
71: Architectural and engineering activities; technical testing and analysis 72: Scientific research and development 73: Advertising and market research 71-73: Architectural and engineering activities; technical testing and analysis; Scientific research and development; Advertising and market research
|
||||||||||||||||||||||||||||||||||||||||||||||||
| 3.3.1.1. Main economic sectors covered - NACE Rev.2 - national particularities | ||||||||||||||||||||||||||||||||||||||||||||||||
Complementary to the NACE Rev. 2 sections, divisions and aggregates, which are mandatory according to Commission Regulation (EU) No 995/2012 (listed above under item 3.3.1.) the following additional NACE Rev. 2 divisions, groups and aggregates are included in the target population of the innovation survey in Bulgaria on a voluntary basis, and for them final results are also made available: 5: Mining of coal and lignite 6: Extraction of crude petroleum and natural gas 7: Mining of metal ores 8: Other mining and quarrying 9: Mining support service activities 10: Manufacture of food products 11: Manufacture of beverages 12: Manufacture of tobacco products 13: Manufacture of textiles 14: Manufacture of wearing apparel 15: Manufacture of leather and related products 16: Manufacture of wood and of products of wood and cork, except furniture; manufacture of articles of straw and plaiting materials 17: Manufacture of paper and paper products 18: Printing and reproduction of recorded media 19: Manufacture of coke and refined petroleum products 19-20: Manufacture of petroleum, chemicals and chemical products 22: Manufacture of rubber and plastic products 22-23: Manufacture of rubber, plastic products, and other non-metallic mineral products 24-25: Manufacture of basic metals and fabricated metal products (except machinery and equipment) 27: Manufacture of electrical equipment 28: Manufacture of machinery and equipment n.e.c. 26-28: Manufacture of computer, electronic and optical products, electrical equipment, and machinery and equipment n.e.c. 29: Manufacture of motor vehicles, trailers and semi-trailers 30: Manufacture of other transport equipment 29 to 30: Manufacture of motor vehicles, trailers and semi-trailers, and other transport equipment 31: Manufacture of furniture 32: Other manufacturing 33: Repair and installation of machinery and equipment 35.1 Electric power generation, transmission and distribution 35.2 Manufacture of gas; distribution of gaseous fuels through mains 35.3 Steam and air conditioning supply 37: Sewerage 38: Waste collection, treatment and disposal activities; materials recovery 39: Remediation activities and other waste management services 49: Land transport and transport via pipelines 50: Water transport 51: Air transport 52: Warehousing and support activities for transportation 53: Postal and courier activities 59: Motion picture, video and television programme production, sound recording and music publishing activities 60: Programming and broadcasting activities 58-60: Publishing activities, motion picture, video and television programme production, sound recording and music publishing activities, programming and broadcasting activities 62-63: Computer programming, consultancy and related activities; Information service activities |
||||||||||||||||||||||||||||||||||||||||||||||||
| 3.3.2. Sector coverage - size class | ||||||||||||||||||||||||||||||||||||||||||||||||
In line with the Methodological Recommendations in accordance with Section 8 Paragraph 2 of Annex II to Commission Regulation (EU) No 995/2012, provided by Eurostat, the following size classes of enterprises according to number of employees are included in the target population of the CIS:
|
||||||||||||||||||||||||||||||||||||||||||||||||
| 3.3.2.1. Sector coverage - size class - national particularities | ||||||||||||||||||||||||||||||||||||||||||||||||
Size classes were based on persons employed. |
||||||||||||||||||||||||||||||||||||||||||||||||
| 3.4. Statistical concepts and definitions | ||||||||||||||||||||||||||||||||||||||||||||||||
The description of concepts, definitions and main statistical variables is available in CIS 2018 European metadata file (ESMS) Results of the community innovation survey 2018 (CIS2018) (inn_cis11) in Eurostat database. |
||||||||||||||||||||||||||||||||||||||||||||||||
| 3.5. Statistical unit | ||||||||||||||||||||||||||||||||||||||||||||||||
The statistical unit used is the Enterprise = Legal unit. Statistical unit Enterprise is coinciding with the reporting unit. |
||||||||||||||||||||||||||||||||||||||||||||||||
| 3.6. Statistical population | ||||||||||||||||||||||||||||||||||||||||||||||||
Core target population are all enterprises in CORE and additional NACE activities (see 3.3.1 and 3.3.1.1) with 10 or more persons employed. |
||||||||||||||||||||||||||||||||||||||||||||||||
| 3.7. Reference area | ||||||||||||||||||||||||||||||||||||||||||||||||
Reference area is Bulgaria. Data on innovation are available on NUTS2 level. |
||||||||||||||||||||||||||||||||||||||||||||||||
| 3.8. Coverage - Time | ||||||||||||||||||||||||||||||||||||||||||||||||
Several rounds of Community Innovation Survey have been conducted so far at two-year interval since end of 90’s. |
||||||||||||||||||||||||||||||||||||||||||||||||
| 3.8.1. Participation in the CIS waves | ||||||||||||||||||||||||||||||||||||||||||||||||
*two reference periods can be distinguished for CIS light: 2000-2002 and 2001-2003 |
||||||||||||||||||||||||||||||||||||||||||||||||
| 3.9. Base period | ||||||||||||||||||||||||||||||||||||||||||||||||
Not relevant. |
||||||||||||||||||||||||||||||||||||||||||||||||
|
|||
CIS indicators are available according to 3 units of measure:
NR: Number for number of enterprises and number of persons employed. THS_EUR: Thousands of euros. All financial variables are provided in thousands of euros, i.e. Turnover or Innovation expenditure. PC: Percentage. The percentage is the ratio between the selected combinations of indicators. |
|||
|
|||
For CIS 2018, the time covered by the survey is the 3-year period from the beginning of 2016 to the end of 2018. Some questions and indicators refer to one year - 2018. The list of indicators covering the 3-year period and referring to one year according to the HDC is available in the Annex section of the European metadata (ESMS). The reference period (2016 - 2018) and reference year (2018) for the innovation survey in Bulgaria are the same as the ones requested in CIS 2018 Harmonised Data Collection (HDM). |
|||
|
|||
| 6.1. Institutional Mandate - legal acts and other agreements | |||
CIS surveys are based on the Commission Regulation (EU) No 995/2012, implementing Decision No 1608/2003/EC of the European Parliament and of the Council on the production and development of Community statistics on science and technology. This Regulation establishes innovation statistics on a statutory basis and makes the delivery of certain variables compulsory e.g. innovation activities, cooperation, development, expenditures and turnover (see the Regulation). Each survey wave may additionally include further variables. In addition, the Regulation defines the obligatory cross-coverage of economic sectors and size class of enterprises. |
|||
| 6.1.1. National legislation | |||
The production of innovation statistics is governed by the national Law on Statistics and National Statistical Programme, available at the following link: https://www.nsi.bg/en/content/99/basic-page/legal-basis |
|||
| 6.2. Institutional Mandate - data sharing | |||
Not requested. |
|||
|
|||
CIS data are transmitted to Eurostat via EDAMIS using the secured transmission system. |
|||
| 7.1. Confidentiality - policy | |||
The national Law on Statistics (Chapter 6 “Protection of secrecy”) guarantees the protection of statistical confidentiality and the use of individual data of enterprises for statistical purposes only. |
|||
| 7.2. Confidentiality - data treatment | |||
The two criteria (national confidentiality rules) applied for defining cells with direct disclosure risk (primary confidentiality), according to which certain data cannot be made public or released, are specified in Article 25 of the national Law on Statistics: ‘statistical information, which aggregates data about less than three statistical units or about a population, in which the relative share of the value of a surveyed parameter of a single unit exceeds 85 per cent of the total volume of such parameter for all units in the population’. Secondary confidentiality treatment is carried out in way making it impossible to recalculate confidential data by subtraction from row and column aggregates. |
|||
|
|||
| 8.1. Release calendar | |||
Data on innovation are published in accordance with the deadline specified in the Release Calendar presenting the results of the statistical surveys carried out by the NSI, which is publicly accessible on the NSI website. |
|||
| 8.2. Release calendar access | |||
The Release Calendar presenting the results of the statistical surveys carried out by the NSI of Bulgaria is available at the following link: http://www.nsi.bg/en/content/480/basic-page/release-calendar-dates |
|||
| 8.3. Release policy - user access | |||
The release policy of the NSI determines the dissemination of statistical data on innovation to all users at the same time - standard tables for free access. The users are informed that the data are being released by a press release. Specific data are provided to everyone with a specific request. Feasibility of the request and payment of possible expenses are checked in advance. |
|||
|
|||
CIS is conducted and disseminated at two-year interval in pair years. |
|||
|
|||||||||||||||
Accessibility and clarity refer to the simplicity and ease for users to access statistics using simple and user-friendly procedure, obtaining them in an expected form and within an acceptable time period, with the appropriate user information and assistance: a global context which finally enables them to make optimum use of the statistics. |
|||||||||||||||
| 10.1. Dissemination format - News release | |||||||||||||||
See below. |
|||||||||||||||
| 10.1.1. Availability of the releases | |||||||||||||||
|
|||||||||||||||
| 10.2. Dissemination format - Publications | |||||||||||||||
- Online database (containing all/most results): https://infostat.nsi.bg/infostat/pages/module.jsf?x_2=90&lang=en - Publications: Data on innovation are published in the annual ‘Statistical Yearbook’: https://www.nsi.bg/en/content/18255/публикация/statistical-yearbook-2019 and in the annual ‘Statistical Reference book’: https://www.nsi.bg/en/content/18321/публикация/statistical-reference-book-2020 Both publications are available in Bulgarian and in English.
|
|||||||||||||||
| 10.3. Dissemination format - online database | |||||||||||||||
Most recent data on innovation for 2018 are available in Bulgarian and in English on the NSI website at the following link: http://www.nsi.bg/en/content/6785/innovation-activity Data on innovation for 2018 and preceding years are published in Bulgarian and in English in online database - Information System for online requests for statistical information (INFOSTAT) - available at the following link: https://infostat.nsi.bg/infostat/pages/module.jsf?x_2=90&lang=en |
|||||||||||||||
| 10.3.1. Data tables - consultations | |||||||||||||||
Not requested. |
|||||||||||||||
| 10.4. Dissemination format - microdata access | |||||||||||||||
Microdata on innovation are disseminated through Eurostat SAFE centre. |
|||||||||||||||
| 10.4.1. Dissemination of microdata | |||||||||||||||
|
|||||||||||||||
| 10.5. Dissemination format - other | |||||||||||||||
Data on innovation are transmitted to Eurostat in SDMX/CSV format to compile European aggregates as well as to be disseminated at the level of Member States in Eurostat's database. |
|||||||||||||||
| 10.5.1. Metadata - consultations | |||||||||||||||
Not requested. |
|||||||||||||||
| 10.6. Documentation on methodology | |||||||||||||||
Disseminated innovation data are accompanied with metadata, which are published on the NSI website at the following link: https://www.nsi.bg/en/content/6786/метаданни/innovation-activity. |
|||||||||||||||
| 10.6.1. Metadata completeness - rate | |||||||||||||||
Not requested. |
|||||||||||||||
| 10.7. Quality management - documentation | |||||||||||||||
Additional explanations (assistance) are provided to the users if required. Nevertheless that, systematic feedback report is not available. The expressed opinions of some of the regular users indicate that they are satisfied with the accompanying meta-information disseminated alongside innovation data. |
|||||||||||||||
|
|||
| 11.1. Quality assurance | |||
NSI of Bulgaria follows the recommendations on organization and quality management provided in the European Statistics Code of Practice (CoP) and implements the guidelines given in the European Statistical System Quality Assurance Framework (QAF). As part of the European Statistical System (ESS), NSI of Bulgaria endorses the Quality Declaration of the ESS. Quality management system established in NSI is in conformity with the requirements of the international quality management system standard ISO 9001:2015. More information on the quality assurance and procedures that describe the quality policy in NSI of Bulgaria can be found on the NSI website at the following link: https://www.nsi.bg/en/content/475/basic-page/quality |
|||
| 11.2. Quality management - assessment | |||
Quality checks are conducted throughout the entire statistical production process of data on innovation, including comparisons with data from the previous innovation survey and data from other sources (R&D and SBS surveys), valid values checks, consistency and completeness checks, etc. The overall quality of the innovation data is considered to be very good. All compulsory and the vast majority of the voluntary data on innovation are produced strictly on time. As far as the innovation survey in Bulgaria is a census, sampling error does not exist, misclassification rate=0 and the unit non response rate is below 1%. Coherence with SBS is ensured since data on ‘turnover’ and ‘persons employed’ are taken directly from SBS census survey. |
|||
|
||||||||||||||||||
Relevance is the degree to which statistics meet current and potential user needs. It includes the production of all needed statistics and the extent to which concepts used (definitions, classifications etc.) reflect user needs. The aim is to describe the extent to which the statistics are useful to, and used by, the broadest array of users. For this purpose, statisticians need to compile information, firstly about their users and their needs. The CIS is based on a common questionnaire and a common survey methodology, as laid down in the 4th edition of Oslo Manual (2018 edition), in order to achieve comparable, harmonised and high quality results for EU Member States, EFTA countries, Candidates and Associated countries. |
||||||||||||||||||
| 12.1. Relevance - User Needs | ||||||||||||||||||
Main users of data on innovation are: the European Commission (DG ENTR, DG ESTAT); ministries; national and regional media; research institutes and universities (students and postgraduates). |
||||||||||||||||||
| 12.1.1. Needs at national level | ||||||||||||||||||
|
||||||||||||||||||
| 12.2. Relevance - User Satisfaction | ||||||||||||||||||
User satisfaction survey carried out by the NSI of Bulgaria (http://www.nsi.bg/en/node/16537) does not provide special information for 2018 data on innovation but the effort to meet the needs of our users is an ongoing process. The comments received from the key users (ministries, researches) prove that they are satisfied with the available information on innovation. |
||||||||||||||||||
| 12.3. Completeness | ||||||||||||||||||
Data for all variables, as defined in the CIS 2018 Harmonized Survey Questionnaire are compiled at the level of detail by NACE activities and by size classes of the enterprises as required by CR (EU) No 995/2012. In addition, data on innovation for the vast majority of voluntary NACE Rev. 2 divisions, groups and aggregates are also produced and transmitted to Eurostat. |
||||||||||||||||||
| 12.3.1. Data completeness - rate | ||||||||||||||||||
Not requested. |
||||||||||||||||||
|
||||||||||||||||||||||||||||||||||||||||||||||||||||
| 13.1. Accuracy - overall | ||||||||||||||||||||||||||||||||||||||||||||||||||||
Accuracy in the statistical sense denotes the closeness of computations or estimates to the exact or true values. Statistics are not equal with the true values because of variability (the statistics change from implementation to implementation of the survey due to random effects) and bias (the average of the possible values of the statistics from implementation to implementation is not equal to the true value due to systematic effects). |
||||||||||||||||||||||||||||||||||||||||||||||||||||
| 13.2. Sampling error | ||||||||||||||||||||||||||||||||||||||||||||||||||||
That part of the difference between a population value and an estimate thereof, derived from a random sample, which is due to the fact that only a subset of the population is enumerated. |
||||||||||||||||||||||||||||||||||||||||||||||||||||
| 13.2.1. Sampling error - indicators | ||||||||||||||||||||||||||||||||||||||||||||||||||||
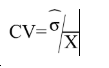
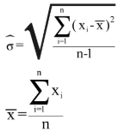
The main indicator used to measure sampling errors for CIS data is the coefficient of variation (CV).
Coefficient of Variation= (Square root of the estimate of the sampling variance) / (Estimated value) Formula: where
|
||||||||||||||||||||||||||||||||||||||||||||||||||||
| 13.2.1.1. Coefficient of variations for key variables | ||||||||||||||||||||||||||||||||||||||||||||||||||||
Coefficient of variation (%) for key variables by NACE categories and for enterprises with 10 and more persons employed: Not applicable - the innovation survey in Bulgaria is a census.
[1] = Coefficient of variation for the percentage of innovative enterprises (INN) in the total population of enterprises (ENT18) |
||||||||||||||||||||||||||||||||||||||||||||||||||||
| 13.2.1.2. Variance estimation method | ||||||||||||||||||||||||||||||||||||||||||||||||||||
Not applicable - the innovation survey in Bulgaria is a census. |
||||||||||||||||||||||||||||||||||||||||||||||||||||
| 13.3. Non-sampling error | ||||||||||||||||||||||||||||||||||||||||||||||||||||
Non-sampling errors occur in all phases of a survey. They add to the sampling errors (if present) and contribute to decreasing overall accuracy. It is important to assess their relative weight in the total error and devote appropriate resources for their control and assessment. Non-sampling errors occur in all phases of a survey. They add to the sampling errors (if present) and contribute to decreasing overall accuracy. It is important to assess their relative weight in the total error and devote appropriate resources for their control and assessment. |
||||||||||||||||||||||||||||||||||||||||||||||||||||
| 13.3.1. Coverage error | ||||||||||||||||||||||||||||||||||||||||||||||||||||
Coverage errors (or frame errors) are due to divergences between the target population and the frame population. The frame population is the set of target population members that has a chance to be selected into the survey sample. It is a listing of all items in the population from which the sample is drawn that contains contact details as well as sufficient information to perform stratification and sampling. |
||||||||||||||||||||||||||||||||||||||||||||||||||||
| 13.3.1.1. Over-coverage - rate | ||||||||||||||||||||||||||||||||||||||||||||||||||||
Not requested. |
||||||||||||||||||||||||||||||||||||||||||||||||||||
| 13.3.1.2. Common units - proportion | ||||||||||||||||||||||||||||||||||||||||||||||||||||
Not requested. |
||||||||||||||||||||||||||||||||||||||||||||||||||||
| 13.3.1.3. Under covered groups of the target population | ||||||||||||||||||||||||||||||||||||||||||||||||||||
There are not under covered groups of the target population. |
||||||||||||||||||||||||||||||||||||||||||||||||||||
| 13.3.1.4. Coverage errors in coefficient variation | ||||||||||||||||||||||||||||||||||||||||||||||||||||
Not applicable - the innovation survey in Bulgaria is a census. |
||||||||||||||||||||||||||||||||||||||||||||||||||||
| 13.3.2. Measurement error | ||||||||||||||||||||||||||||||||||||||||||||||||||||
Measurement errors occur during data collection and generate bias by recording values different than the true ones. The survey questionnaire used for data collection may have led to the recording of wrong values, or there may be respondent or interviewer bias. |
||||||||||||||||||||||||||||||||||||||||||||||||||||
| 13.3.2.1. Measures for reducing measurement errors | ||||||||||||||||||||||||||||||||||||||||||||||||||||
In order the respondents correctly to understand and apply the concepts on innovation, and to provide accurate answers, the national innovation questionnaire comprises explanatory notes fully in line with these of CIS 2018 Harmonised Questionnaire and Oslo Manual 2018. |
||||||||||||||||||||||||||||||||||||||||||||||||||||
| 13.3.3. Non response error | ||||||||||||||||||||||||||||||||||||||||||||||||||||
Non response occurs when a survey fails to collect data on all survey variables from all the population units designated for data collection in a sample or complete enumeration. There are two types of non-response: 1) Unit non-response, which occurs when no data (or so little as to be unusable) are collected about a population unit designated for data collection. a) Un-weighted unit non-response rate (%) = 100*(Number of units with no response or not usable response) / (Total number of in-scope (eligible) units in the sample) b) Weighted unit non-response rate (%) = 100*(Number of weighted units with no response or not usable response) / (Total number of in-scope (eligible) units in the sample) 2) Item non-response, which occurs when only data on some, but not all survey data items are collected about a population unit designated for data collection. a) Un-weighted item non-response rate (%) = 100*(Number of units with no response at all for the item) / (Total number of eligible, for the item, units in the sample i.e. filters have to be taken into account)
Unit non-response is very low (below 1 %) and bias associated with nonresponse is minimal. |
||||||||||||||||||||||||||||||||||||||||||||||||||||
| 13.3.3.1. Unit non-response - rate | ||||||||||||||||||||||||||||||||||||||||||||||||||||
See below. |
||||||||||||||||||||||||||||||||||||||||||||||||||||
| 13.3.3.1.1. Un-weighted and weighted unit non-response rate by NACE categories and for enterprises with 10 or more employees | ||||||||||||||||||||||||||||||||||||||||||||||||||||
Un-weighted and weighted unit non-response rate by NACE categories and for enterprises with 10 or more persons employed
The number of eligible units is the number of sample units, which indeed belong to the target population. |
||||||||||||||||||||||||||||||||||||||||||||||||||||
| 13.3.3.1.2. Maximum number of recalls/reminders before coding | ||||||||||||||||||||||||||||||||||||||||||||||||||||
The maximum number of recalls/reminders depends on how big is the enterprise. Normally, if there is not a feedback after 2 to 3 recalls the enterprise is considered as non-responding. |
||||||||||||||||||||||||||||||||||||||||||||||||||||
| 13.3.3.2. Item non-response - rate | ||||||||||||||||||||||||||||||||||||||||||||||||||||
See below. |
||||||||||||||||||||||||||||||||||||||||||||||||||||
| 13.3.3.2.1. Item non-response rate for Turnover (in Core NACE: B-C-D-E-46-H-J-K-71-72-73 enterprises with 10 or more employees) | ||||||||||||||||||||||||||||||||||||||||||||||||||||
Item non-response rate for Turnover (in Core NACE: B-C-D-E-46-H-J-K-71-72-73 enterprises with 10 or more persons employed).
Data on ‘turnover’ are not collected through the innovation survey, but are taken directly from SBS census survey. |
||||||||||||||||||||||||||||||||||||||||||||||||||||
| 13.3.3.2.2. Item non response rate for new questions | ||||||||||||||||||||||||||||||||||||||||||||||||||||
Item non-response rate for new questions in CIS t (in Core NACE: B-C-D-E-46-H-J-K-71-72-73 enterprises with 10 or more persons employed)
|
||||||||||||||||||||||||||||||||||||||||||||||||||||
| 13.3.4. Processing error | ||||||||||||||||||||||||||||||||||||||||||||||||||||
In order to identify and correct the processing errors a lot of checks are carried out at micro and macro data level. Human errors during the data editing process and plausibility errors are identified through many checks that are carried out automatically, e.g. checks of completeness/ sums/ horizontal logical dependences/ vertical relations/ average rates/ minimum-maximum values, etc. The macro data tabled are verified by both computer programs and by NSI staff before their publication. The qualified checking of original respondent data, usage of sophisticated plausibility routines, correction measures taken by direct contacts to reporting units and also expert staff verification of the final aggregated data minimize the processing errors and their impact on the outputs.
|
||||||||||||||||||||||||||||||||||||||||||||||||||||
| 13.3.5. Model assumption error | ||||||||||||||||||||||||||||||||||||||||||||||||||||
Not requested. |
||||||||||||||||||||||||||||||||||||||||||||||||||||
|
|||
Timeliness and punctuality refer to time and dates, but in a different manner. |
|||
| 14.1. Timeliness | |||
The timeliness of statistics reflects the length of time between data availability and the event or phenomenon they describe. |
|||
| 14.1.1. Time lag - first result | |||
Timeliness of national data – date of first release of national level: 30 June 2020 |
|||
| 14.1.2. Time lag - final result | |||
Not requested. |
|||
| 14.2. Punctuality | |||
Punctuality refers to the time lag between the release date of data and the target date on which they were scheduled for release as announced officially. |
|||
| 14.2.1. Punctuality - delivery and publication | |||
Date of transmission of complete and validated data to Eurostat (Number of days between that data and 30 June 2020): Complete and validated data on innovation were transmitted to Eurostat on 30 June 2020. |
|||
|
||||||||||||||||||||
Comparability aims at measuring the impact of differences in applied statistical concepts and definitions on the comparison of statistics between geographical areas, non-geographical domains, or over time. The coherence of statistical outputs refers to the degree to which the statistical processes by which they were generated used the same concepts (classifications, definitions, and target populations) and harmonised methods. Coherent statistical outputs have the potential to be validly combined and used jointly. |
||||||||||||||||||||
| 15.1. Comparability - geographical | ||||||||||||||||||||
Data on innovation are geographically comparable - for the entire national territory the same statistical concepts and definitions are applied. |
||||||||||||||||||||
| 15.1.1. Asymmetry for mirror flow statistics - coefficient | ||||||||||||||||||||
Not requested. |
||||||||||||||||||||
| 15.1.2. National questionnaire – compliance with Eurostat model questionnaire | ||||||||||||||||||||
Methodological deviations from the CIS Harmonised Data Collection (HDC)
|
||||||||||||||||||||
| 15.1.3. National questionnaire – additional questions | ||||||||||||||||||||
Methodological deviations from the CIS Harmonised Data Collection (HDC)
|
||||||||||||||||||||
| 15.2. Comparability - over time | ||||||||||||||||||||
Due to important methodological changes in CIS 2018 driven by Oslo Manual 2018, the data 2018 cannot be directly compared with previous CIS waves. |
||||||||||||||||||||
| 15.2.1. Length of comparable time series | ||||||||||||||||||||
Not requested. |
||||||||||||||||||||
| 15.3. Coherence - cross domain | ||||||||||||||||||||
See the comparison between SBS and CIS data in the section 15.3.3 below. |
||||||||||||||||||||
| 15.3.1. Coherence - sub annual and annual statistics | ||||||||||||||||||||
Not requested. |
||||||||||||||||||||
| 15.3.2. Coherence - National Accounts | ||||||||||||||||||||
Not requested. |
||||||||||||||||||||
| 15.3.3. Coherence – Structural Business Statistics (SBS) | ||||||||||||||||||||
This part compares key variables for aggregated CIS data with SBS data
* Numbers are to be provided for the last year of the reference period (t) Data on ‘persons employed’ and ‘turnover’ are not collected through the innovation survey, but are taken directly from SBS census survey. |
||||||||||||||||||||
| 15.4. Coherence - internal | ||||||||||||||||||||
Not requested. |
||||||||||||||||||||
|
|||
Confidential information on the production cost of the CIS. |
|||
|
|||
| 17.1. Data revision - policy | |||
Not requested. |
|||
| 17.2. Data revision - practice | |||
Not requested. |
|||
| 17.2.1. Data revision - average size | |||
Not requested. |
|||
|
||||||||||||||||||||||||||||||||||||||
| 18.1. Source data | ||||||||||||||||||||||||||||||||||||||
See below: |
||||||||||||||||||||||||||||||||||||||
| 18.1.1. Sampling frame (or census frame) | ||||||||||||||||||||||||||||||||||||||
National Business Register which is updated regularly. |
||||||||||||||||||||||||||||||||||||||
| 18.1.2. Sampling design | ||||||||||||||||||||||||||||||||||||||
Not applicable - the innovation survey in Bulgaria is a census. |
||||||||||||||||||||||||||||||||||||||
| 18.1.3. Target population and sample size | ||||||||||||||||||||||||||||||||||||||
|
||||||||||||||||||||||||||||||||||||||
| 18.1.4. Data source for pre-filled variables | ||||||||||||||||||||||||||||||||||||||
Variables and indicators filled or prefilled from other sources.
|
||||||||||||||||||||||||||||||||||||||
| 18.1.5. Data source and variables used for derivation and weighting | ||||||||||||||||||||||||||||||||||||||
Not applicable - the innovation survey in Bulgaria is a census. |
||||||||||||||||||||||||||||||||||||||
| 18.2. Frequency of data collection | ||||||||||||||||||||||||||||||||||||||
According to the Commission Regulation (EU) No 995/2012, the innovation statistics shall be provided to Eurostat every two years in each even year. The data collection takes place every second year in year t-2 preceding the data provision. |
||||||||||||||||||||||||||||||||||||||
| 18.3. Data collection | ||||||||||||||||||||||||||||||||||||||
The innovation survey in Bulgaria is mandatory census survey. |
||||||||||||||||||||||||||||||||||||||
| 18.3.1. Survey participation | ||||||||||||||||||||||||||||||||||||||
The innovation survey in Bulgaria is mandatory. |
||||||||||||||||||||||||||||||||||||||
| 18.3.2. Survey type | ||||||||||||||||||||||||||||||||||||||
The innovation survey in Bulgaria is a census. |
||||||||||||||||||||||||||||||||||||||
| 18.3.3. Combination of sample survey and census data | ||||||||||||||||||||||||||||||||||||||
No. |
||||||||||||||||||||||||||||||||||||||
| 18.3.4. Census criteria | ||||||||||||||||||||||||||||||||||||||
None. |
||||||||||||||||||||||||||||||||||||||
| 18.3.5. Data collection method | ||||||||||||||||||||||||||||||||||||||
Data collection method
|
||||||||||||||||||||||||||||||||||||||
| 18.4. Data validation | ||||||||||||||||||||||||||||||||||||||
Not requested. |
||||||||||||||||||||||||||||||||||||||
| 18.5. Data compilation | ||||||||||||||||||||||||||||||||||||||
Operations performed on data to derive new information according to a given set of rules. |
||||||||||||||||||||||||||||||||||||||
| 18.5.1. Imputation - rate | ||||||||||||||||||||||||||||||||||||||
Imputation is the method of creating plausible (but artificial) substitute values for all those missing. Definition of imputation rate: Imputation rate (for the variable x) (%) = 100*(Number of replaced values) / (Total number of values for a given variable) Definition of weighted imputation rate: Weighted imputation rate= 100*(Number of total weighted replaced values) / (Total number of weighted values for a given variable) |
||||||||||||||||||||||||||||||||||||||
| 18.5.1.1. Imputation rate for metric variables | ||||||||||||||||||||||||||||||||||||||
Imputation rate for metric variables by NACE categories and for enterprises with 10 or more persons employed:
(1) = Total turnover in the last year of the reference period (t) (TUR) (2) = Share of the turnover in the last year of the reference period (t) due to new or improved product new to the market in the total turnover for product innovative enterprises TUR_PRD_NEW_MKT/TUR(INNO_PRD) (3) = R&D expenditure performed in-house (EXP_INNO_RND_IH) |
||||||||||||||||||||||||||||||||||||||
| 18.5.2. Weights calculation | ||||||||||||||||||||||||||||||||||||||
Weights calculation method for sample surveys: Not applicable - the innovation survey in Bulgaria is a census.
|
||||||||||||||||||||||||||||||||||||||
| 18.6. Adjustment | ||||||||||||||||||||||||||||||||||||||
Not applicable. |
||||||||||||||||||||||||||||||||||||||
| 18.6.1. Seasonal adjustment | ||||||||||||||||||||||||||||||||||||||
Not requested. |
||||||||||||||||||||||||||||||||||||||
|
|||
|
|||
|
|||