Landings of fishery products (fish_ld)

National Reference Metadata in ESS Standard for Quality Reports Structure (ESQRS)

Compiling agency: Turkish Statistical Institute (TURKSTAT)


Eurostat metadata
Reference metadata
1. Contact
2. Statistical presentation
3. Statistical processing
4. Quality management
5. Relevance
6. Accuracy and reliability
7. Timeliness and punctuality
8. Coherence and comparability
9. Accessibility and clarity
10. Cost and Burden
11. Confidentiality
12. Comment
Related Metadata
Annexes (including footnotes)


For any question on data and metadata, please contact: Eurostat user support

Download


1. Contact Top
1.1. Contact organisation

Turkish Statistical Institute (TURKSTAT)

1.2. Contact organisation unit

Agricultural Statistics Department- Agricultural Production Statistics Group - Fishery Statistics Unit

1.5. Contact mail address

ilkay.demirsoy@tuik.gov.tr 

umran.yildirim@tuik.gov.tr


2. Statistical presentation Top
2.1. Data description

Main characteristics

2.1.1 Describe shortly the main characteristics of the statistics  

The Landings Regulation (Reg (EC) 1921/2006) requires Member States and EEA EFTA States to submit statistical data on an annual basis and within six months of the end of the reference calendar year. They are required to provide data on total quantities and unit values of the fishery products landed in their territory by EU and EEA EFTA vessels.


Reference period

2.1.2 Reference period of the data collection 

2022


National legislation

2.1.3 Is there a national legislation covering these statistics?  Yes
If Yes, please answer all the following questions.   
2.1.4 Name of the national legislation 

Turkish Statistical Law No. 5429 

2.1.5 Link to the national legislation 

https://www.resmiistatistik.gov.tr/media/dosyalar/2018/04/18/TuikKanun.pdf

2.1.6 Responsible organisation for the national legislation 

TurkStat

2.1.7 Year of entry into force of the national legislation 

2005

2.1.8 Please indicate which variables required under EU regulation are not covered by national legislation, if any.

No

2.1.9 Please indicate which national definitions differ from those in the EU regulation, if any. 
2.1.10 Is there a legal obligation for respondents to reply?  Yes


Additional comments on data description

There is no direct legislation on the collection and submission of landing data, but various issues related landing are regulated by Fisheries Law No 1380, Notification 4/1 Regulating Commercial Fishing and Notification 4/2 Regulating Amateur Fishing.

2.2. Classification system

Data are broken down by:
1) the species of aquatic organisms identified using the 3-alpha codes as defined by the FAO (ASFIS List of Species for Fishery Statistics Purposes);
2) the flag state of the fishing vessels carrying out landings (as per the codes set out in Annex II to the Landings Regulation);
3) the ‘presentation’ of the products i.e. processed state of the fisheries product or part thereof e.g. fresh fillets, frozen headed and gutted, smoked, etc. (See Annex III of the Regulation);
4) the intended use of the products i.e. how landed fish are intended to be used e.g. for human consumption, industrial uses, bait etc. (See Annex IV to the Regulation).

2.3. Coverage - sector

Landing of Fishery products to Turkish ports

2.4. Statistical concepts and definitions

Total quantities and corresponding value of all fishery products landed in the reporting country are to be reported, regardless of the nationality of the vessel making the landings. Landings by vessels of the reporting country in foreign ports are excluded. Details on products presentation and intended use are required, as well as vessel nationality.
'Community fishing vessels' means fishing vessels flying the flag of an EU Member State and registered in the Community.
'EFTA fishing vessels' means fishing vessels flying the flag of, or registered in, an EEA EFTA country.
'Unit value' means the value at first sale of the fishery products landed (in national currency) divided by the quantity landed (in tonnes), or for fishery products not immediately sold, the average price per tonne in national currency, estimated using an appropriate method.
Landed quantities are expressed in Tonnes Product Weight.
Unit values are reported as unit price in national currency per tonne.

2.5. Statistical unit

The basic statistical units are the individual fishing vessels

2.6. Statistical population

All registered vessels having a fishing activity and landing fishery products in our country.

2.7. Reference area
2.7.1 Geographical area covered

The entire territory of the country.

2.7.2 Which special Member State territories are included?

Not applicable

2.8. Coverage - Time

Since 2016

2.9. Base period

Annual


3. Statistical processing Top
3.1. Source data

Overall summary

3.1.1 Total number of different data sources used

2

The breakdown is as follows: 
3.1.2 Total number of sources of the type "Census"

1

3.1.3 Total number of sources of the type "Sample survey"

1

3.1.4 Total number of sources of the type "Administrative source"

0

3.1.5 Total number of sources of the type "Experts"

0

3.1.6 Total number of sources of the type "Other sources"

0


Census

These questions only apply to censuses. If there is more than one census, please describe the main census below and the additional ones in table 3.1 of the annexed Excel file 
3.1.7 Name/Title

Large scale fishermen marine fishery monthly survey

3.1.8 Name of Organisation responsible

TURKSTAT

3.1.9 Main scope

All registered large scale professional fishermen who are fishing in our seas are covered.

3.1.10 Marine fishing areas covered Mediterranean and Black Sea
3.1.11 List used to build the frame

Administrative records from Ministry of Agriculture and Forestry and updated lists by TURKSTAT regional offices

3.1.12 Any possible threshold values

Vessels greater and equal then 10 meter are covered

3.1.13 Population size

Avarage 2500 vessels

3.1.14 Additional comments


Sample survey

These questions only apply to surveys. If there is more than one survey, please describe the main survey below and the additional ones in table 3.1 of the annexed Excel file 
3.1.15 Name/Title

Small scale fishermen marine fishery seasonally survey

3.1.16 Name of Organisation responsible

TURKSTAT

3.1.17 Main scope

All registered professional small scale fishermen who are fishing in our seas are covered

3.1.18 Marine fishing areas covered Mediterranean and Black Sea
3.1.19 List used to build the frame

Administrative records from Ministry of Agriculture and Forestry and updated lists by TURKSTAT regional offices

3.1.20 Any possible threshold values

Vessels between 5 meter (equal to 5 meter are included) and 10 meter (equal to 10 meter are excluded) are covered

3.1.21 Population size

Average 12101 vessels

3.1.22 Sample size

Average 4045 vessels

3.1.23 Sampling basis Multiple frame
3.1.24 If Other, please specify
3.1.25 Type of sample design Random
Stratified
3.1.26 If Other, please specify
3.1.27 If Stratified, number of strata

27

3.1.28 If Stratified, stratification criteria Unit location
3.1.29 If Other, please specify
3.1.30 Additional comments


Administrative source

These questions only apply to administrative sources. If there is more than one administrative source, please describe the main source below and the additional ones in table 3.1 of the annexed Excel file 
3.1.31 Name/Title
3.1.32 Name of Organisation responsible
3.1.33 Contact information (email and phone)
3.1.34 Main administrative scope
3.1.35 Geospatial Coverage
3.1.36 Type of administrative documents collected
3.1.37 If Other, please specify
3.1.38 Are these documents in accordance with the rules set in the current EU Regulations (EC) 1224/2009 and (EU) 404/2011 for each of your fleet segments?
3.1.39 If partially, which rules are not applied?
3.1.40 Are landing data for vessels under 10 metres long collected?
3.1.41 Is the Electronic Reporting System (ERS) used for vessels above 12 meters as foreseen in Regulations (EC) 1224/2009 and (EU) 404/2011?
3.1.42 Is the Vessel Monitoring System (VMS) used for vessels above 12 meters as foreseen in Regulations (EC) 1224/2009 and (EU) 404/2011?
3.1.43 Marine fishing areas covered
3.1.44 Update frequency
3.1.45 Legal basis
3.1.46 Are you able to access directly to the micro data?
3.1.47 Are you able to check the plausibility of the data, namely by contacting directly the units?
3.1.48 How would you assess the proximity of the definitions and concepts (including statistical units) used in the administrative source with those required in the EU regulation?
3.1.49 Please list the main differences between the administrative source and the statistical definitions and concepts
3.1.50 Is a different threshold used in the administrative source and statistical data?
3.1.51 If Yes, please specify
3.1.52 Additional comments


Experts

If there is more than one Expert source, please describe the main one below and the additional ones in table 3.1 of the annexed Excel file 
3.1.53 Name/Title
3.1.54 Primary purpose
3.1.55 Legal basis
3.1.56 Update frequency
3.1.57 Expert data supplier
3.1.58 If Other, please specify
3.1.59 How would you assess the quality of those data?
3.1.60 Additional comments


Other sources

If there is more than one other statistical activity, please describe the main one below and the additional ones in table 3.1 of the annexed Excel file 
3.1.61 Name/Title
3.1.62 Name of Organisation
3.1.63 Primary purpose
3.1.64 Data type
3.1.65 If Other, please specify
3.1.66 How would you assess the quality of those data?
3.1.67 Additional comments


3.2. Frequency of data collection

Monthly (8 terms) from large scale fishermen and twice in a year from small scale fishermen

3.3. Data collection

Census

These questions only apply to censuses. If there is more than one census, please describe the main census below and the additional ones in table 3.3 of the annexed Excel file 
3.3.1 Name/Title

Large scale fishermen marine fishery monthly survey

3.3.2 Methods of data collection Face-to-face interview
3.3.3 If Other, please specify
3.3.4 If face-to-face or telephone interview, which method is used? Electronic questionnaire
3.3.5 Data entry method, if paper questionnaires?
3.3.6 Please annex the questionnaire used (if very long: please provide the hyperlink)
3.3.7 Additional comments


Sample survey

These questions only apply to surveys. If there is more than one survey, please describe the main survey below and the additional ones in table 3.3 of the annexed Excel file 
3.3.8 Name/Title

Small scale fishermen marine fishery seasonally survey

3.3.9 Methods of data collection Face-to-face interview
Telephone interview
3.3.10 If Other, please specify
3.3.11 If face-to-face or telephone interview, which method is used? Electronic questionnaire
3.3.12 Data entry method, if paper questionnaires?
3.3.13 Please annex the questionnaire used (if very long: please provide the hyperlink)
3.3.14 Additional comments


Administrative source

These questions only apply to administrative sources. If there is more than one administrative source, please describe the main source below and the additional ones in table 3.3 of the annexed Excel file 
3.3.15 Name/Title
3.3.16 Extraction date
3.3.17 How easy is it to get access to the data?
3.3.18 Data transfer method
3.3.19 Additional comments


Experts

If there is more than one other statistical activity, please describe the main one below and the additional ones in table 3.3 of the annexed Excel file 
3.3.20 Name/Title
3.3.21 Methods of data collection
3.3.22 Additional comments
3.4. Data validation
3.4.1 Which kind of data validation measures are in place? Automatic
3.4.2 What do they target? Completeness
Consistency
3.4.3 If Other, please specify
3.5. Data compilation
3.5.1 Describe the data compilation process

Data of the fishermen are compiled from the fishermen with face to face interview method by using tablet pc and send to database of TURKSTAT

3.5.2 Which conversion factors were used from tonnes product weight (TPW) to tonnes live weight (TLW)? None
3.5.3 Additional comments
3.6. Adjustment

Not apllied.


4. Quality management Top
4.1. Quality assurance
4.1.1 Is there a quality management system used in the organisation? Yes
4.1.2 If yes, how is it implemented?

Our quality management started at the stage of creating the survey forms. Their standarts are checked by responsible unit of standarts.At the data compiling stage, edits in the electronic questionairre working for quality. And after entering the data the necessary analyses applying. 

4.1.3 Has a peer review been carried out? No
4.1.4 If Yes, which were the main conclusions?
4.1.5 What quality improvements are foreseen? Improve data validation
4.1.6 If Other, please specify
4.1.7 Additional comments
4.2. Quality management - assessment

Development since the last quality report

4.2.1 Overall quality Stable
4.2.2 Relevance Stable
4.2.3 Accuracy and reliability Stable
4.2.4 Timeliness and punctuality Stable
4.2.5 Comparability Stable
4.2.6 Coherence Stable
4.2.7 Additional comments


5. Relevance Top
5.1. Relevance - User Needs
5.1.1 If certain user needs are not met, please specify which and why

The user needs are all met. 

5.1.2 Please specify any plans to satisfy needs more completely in the future

All user needs are met.

5.1.3 Additional comments
5.2. Relevance - User Satisfaction
5.2.1 Has a user satisfaction survey been conducted? No
If Yes, please answer all the following questions 
5.2.2 Year of the user satisfaction survey
5.2.3 How satisfied were the users?
5.2.4 Additional comments
5.3. Completeness
5.3.1 Data completeness - rate

100%

5.3.2 If not complete, which characteristics are missing?
5.3.3 Additional comments


6. Accuracy and reliability Top
6.1. Accuracy - overall
6.1.1 How good is the accuracy? Good
6.1.2 What are the main factors lowering the accuracy? Sampling error
Coverage error
Non-response error
6.1.3 If Other, please specify
6.1.4 Additional comments
6.2. Sampling error

Sample survey

These questions only apply to surveys. If there is more than one survey, please describe the main survey below and the additional ones in table 6.2 of the annexed Excel file 
6.2.1 Name/Title

 Small scale fishermen marine fishery seasonally survey

6.2.2 Methods used to assess the sampling error Relative standard error
6.2.3 If Other, please specify
6.2.4 Methods used to derive the extrapolation factor Non-response
6.2.5 If Other, please specify
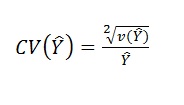
6.2.6 If coefficients of variation are calculated, please describe the calculation methods and formulas

6.2.7 Sampling error - indicators
NACE / NUTS etc. CV (%)
ANCHOVY 3,80
PILCHARD 12,93
HORSE MACKEREL 9,22
SCAD 7,12
ATLANTİC BONİTO 3,93
BLUE FİSH 6,34
SPRAT 0,00
GREY MULLET 15,78
STRIPED VENUS 0
SEA SNAIL 5,31
SQUID 9,02
MEDITERRANEAN MUSSEL 72,08
GIANT GAMBA PRAWN     5,54
DEEPWATER ROSE PRAWN 18,15
6.2.8 Additional comments
6.3. Non-sampling error

See sections below.

6.3.1. Coverage error

Census

These questions only apply to censuses. If there is more than one census, please describe the main census below and the additional ones in table 6.3 of the annexed Excel file 
6.3.1.1 Name/Title

Large scale fishermen marine fishery monthly survey

Over-coverage
6.3.1.2 Does the sample frame include wrongly classified units that are out of scope? No
6.3.1.3 What methods are used to detect the out-of scope units?
6.3.1.4 Does the sample frame include units that do not exist in practice? Yes
6.3.1.5 Over-coverage - rate

2.6%

6.3.1.6 Impact on the data quality Low
Under-coverage
6.3.1.7 Does the sample frame include all units falling within the scope of this survey?
6.3.1.8 If Not, which units are not included?
6.3.1.9 How large do you estimate the proportion of those units? (%)
6.3.1.10 Impact on the data quality
Misclassification
6.3.1.11 Impact on the data quality
Common units
6.3.1.12 Common units - proportion

Not applicable.

6.3.1.13 Additional comments


Sample survey

These questions only apply to surveys. If there is more than one survey, please describe the main survey below and the additional ones in table 6.3 of the annexed Excel file 
6.3.1.14 Name/Title

 Small scale fishermen marine fishery seasonally survey

Over-coverage
6.3.1.15 Does the sample frame include wrongly classified units that are out of scope? No
6.3.1.16 What methods are used to detect the out-of scope units?
6.3.1.17 Does the sample frame include units that do not exist in practice? Yes
6.3.1.18 Over-coverage - rate

21.66 %

6.3.1.19 Impact on the data quality Low
Under-coverage 
6.3.1.20 Does the sample frame include all units falling within the scope of this survey?
6.3.1.21 If Not, which units are not included?
6.3.1.22 How large do you estimate the proportion of those units? (%)
6.3.1.23 Impact on the data quality
Misclassification
6.3.1.24 Impact on the data quality
Common units 
6.3.1.25 Common units - proportion

Not applicable.

6.3.1.26 Additional comments


Administrative data

These questions only apply to administrative sources. If there is more than one administrative source, please describe the main source below and the additional ones in table 6.3 of the annexed Excel file 
6.3.1.27 Name/Title of the administrative source
Over-coverage
6.3.1.28 Does the administrative source include wrongly classified units that are out of scope?
6.3.1.29 What methods are used to detect the out-of scope units?
6.3.1.30 Does the administrative source include units that do not exist in practice?
6.3.1.31 Over-coverage - rate
6.3.1.32 Impact on the data quality
Under-coverage
6.3.1.33 Does the administrative source include all units falling within the scope of this survey?
6.3.1.34 If Not, which units are not included?
6.3.1.35 How large do you estimate the proportion of those units? (%)
6.3.1.36 Impact on the data quality
Misclassification 
6.3.1.37 Impact on the data quality
6.3.1.38 Additional comments
6.3.2. Measurement error

Census

These questions only apply to censuses. If there is more than one census, please describe the main census below and the additional ones in table 6.3 of the annexed Excel file 
6.3.2.1 Name/Title

Large scale fishermen marine fishery monthly survey

6.3.2.2 Is the questionnaire based on usual concepts for respondents? Yes
6.3.2.3 Number of censuses already performed with the current questionnaire?

1

6.3.2.4 Preparatory testing of the questionnaire? No
6.3.2.5 Number of units participating in the tests? 
6.3.2.6 Explanatory notes/handbook for surveyors/respondents?  Yes
6.3.2.7 On-line FAQ or Hot-line support for surveyors/respondents? No
6.3.2.8 Are there pre-filled questions? No
6.3.2.9 Percentage of pre-filled questions out of total number of questions
6.3.2.10 Other actions taken for reducing the measurement error?
6.3.2.11 Additional comments


Sample survey

These questions only apply to surveys. If there is more than one survey, please describe the main survey below and the additional ones in table 6.3 of the annexed Excel file 
6.3.2.12 Name/Title

Small scale fishermen marine fishery seasonally survey

6.3.2.13 Is the questionnaire based on usual concepts for respondents? Yes
6.3.2.14 Number of surveys already performed with the current questionnaire?

1

6.3.2.15 Preparatory testing of the questionnaire? No
6.3.2.16 Number of units participating in the tests? 
6.3.2.17 Explanatory notes/handbook for surveyors/respondents?  Yes
6.3.2.18 On-line FAQ or Hot-line support for surveyors/respondents? No
6.3.2.19 Are there pre-filled questions? No
6.3.2.20 Percentage of pre-filled questions out of total number of questions
6.3.2.21 Other actions taken for reducing the measurement error?
6.3.2.22 Additional comments
6.3.3. Non response error

Census

These questions only apply to censuses. If there is more than one census, please describe the main census below and the additional ones in table 6.3 of the annexed Excel file 
6.3.3.1 Name/Title of the survey

Large scale fishermen marine fishery monthly survey

6.3.3.2 Unit non-response - rate

2,01%

6.3.3.3 How do you evaluate the recorded unit non-response rate in the overall context? Low
6.3.3.4 Measures taken for minimising the unit non-response Follow-up interviews
Legal actions
Imputation
6.3.3.5 If Other, please specify
6.3.3.6 Item non-response rate
6.3.3.7 Item non-response rate - Minimum
6.3.3.8 Item non-response rate - Maximum
6.3.3.9 Which items had a high item non-response rate? 
6.3.3.10 Additional comments


Sample survey

These questions only apply to surveys. If there is more than one survey, please describe the main survey below and the additional ones in table 6.3 of the annexed Excel file 
6.3.3.11 Name/Title of the survey

Small scale fishermen marine fishery seasonally survey

6.3.3.12 Unit non-response - rate

1.46%

6.3.3.13 How do you evaluate the recorded unit non-response rate in the overall context? Low
6.3.3.14 Measures taken for minimising the unit non-response Follow-up interviews
Legal actions
Weighting
6.3.3.15 If Other, please specify
6.3.3.16 Item non-response rate
6.3.3.17 Item non-response rate - Minimum
6.3.3.18 Item non-response rate - Maximum
6.3.3.19 Which items had a high item non-response rate? 
6.3.3.20 Additional comments
6.3.4. Processing error

Census

These questions only apply to censuses. If there is more than one census, please describe the main census below and the additional ones in table 6.3 of the annexed Excel file 
6.3.4.1 Name/Title

Large scale fishermen marine fishery monthly survey

6.3.4.2 Imputation - rate

2,01

6.3.4.3 Imputation - basis Other
6.3.4.4 If Other, please specify

 The data which has same year and month , Same vessel length group of vessel, Same province and district

6.3.4.5 Additional comments


Sample survey

These questions only apply to surveys. If there is more than one survey, please describe the main survey below and the additional ones in table 6.3 of the annexed Excel file 
6.3.4.6 Name/Title

Small scale fishermen marine fishery seasonally survey

6.3.4.7 Imputation - rate
6.3.4.8 Imputation - basis
6.3.4.9 If Other, please specify
6.3.4.10 How do you evaluate the impact of imputation on Coefficients of Variation?
6.3.4.11 Additionnal comments
6.3.5. Model assumption error

Not applicable.

6.4. Seasonal adjustment

Not applicable.

6.5. Data revision - policy
6.6. Data revision - practice
6.6.1 Data revision - average size

Not applied

6.6.2 Were data revisions due to conceptual changes (e.g. new definitions)  carried out since the last quality report?
6.6.3 What was the main reason for the revisions?
6.6.4 How do you evaluate the impact of the revisions?
6.6.5 Additional comments


7. Timeliness and punctuality Top
7.1. Timeliness
7.1.1 When were  the first  results for the reference period published?

June 2023

7.1.2 When were  the final results for the reference period published?

June 2023

7.1.3 Reasons for possible long production times?
7.2. Punctuality
7.2.1 Were data released nationally according to a pre-announced schedule (Release Calendar)? Yes
7.2.2 If Yes, were data released on the target date? Yes
7.2.3 If No, reasons for delays?
7.2.4 Number of days between the national release date of data and the target date

0

7.2.4. Punctuality - delivery and publication

0


8. Coherence and comparability Top
8.1. Comparability - geographical

To be assessed by Eurostat

8.1.1. Asymmetry for mirror flow statistics - coefficient

Not applicable.

8.2. Comparability - over time
8.2.1 Length of comparable time series

7 years data are comparable

8.2.2 Have there been major breaks in the time series? No
8.2.3 If Yes, please specify the year of break and the reason
8.2.4 Additional comments
8.3. Coherence - cross domain
8.3.1 With which other national data sources have the data been compared? Catch data
8.3.2 If Other, please specify
8.3.3 Describe briefly the results of comparisons

Only the Turkish vessels unship their fishes to our land.

8.3.4 If no comparisons have been made, explain why
8.3.5 Additional comments
8.4. Coherence - sub annual and annual statistics

Not applicable.

8.5. Coherence - National Accounts

Not applicable.

8.6. Coherence - internal


9. Accessibility and clarity Top
9.1. Dissemination format - News release
9.1.1 Do you publish a news release? No
9.1.2 If Yes, please provide a link
9.2. Dissemination format - Publications
9.2.1 Do you produce a paper publication? No
9.2.2 If Yes, is there an English version?
9.2.3 Do you produce an electronic publication? No
9.2.4 If Yes, is there an English version?
9.2.5 Please provide a link
9.3. Dissemination format - online database
9.3.1 Data tables - consultations

Landing of sea fish for intended use, 2022

Landing of other sea products for intended use, 2022

9.3.2 Is an on-line database accessible to users? Yes
9.3.3 Please provide a link

https://data.tuik.gov.tr/Kategori/GetKategori?p=tarim-111&dil=1 


9.4. Dissemination format - microdata access
9.4.1 Are micro-data accessible to users? No
9.4.2 Please provide a link
9.5. Dissemination format - other

None

9.6. Documentation on methodology
9.6.1 Are national reference metadata files available? No
9.6.2 Please provide a link
9.6.3 Are methodological papers available? No
9.6.4 Please provide a link
9.6.5 Is a handbook available? No
9.6.6 Please provide a link
9.7. Quality management - documentation
9.7.1 Metadata completeness - rate

Not available

9.7.2 Metadata - consultations

Not available

9.7.3 Is a quality report available? No
9.7.4 Please provide a link


10. Cost and Burden Top
10.1 Efficiency gains if compared to the previous quality report None
10.2 If Other, please specify
10.3 Burden reduction measures since the previous quality report None
10.4 If Other, please specify


11. Confidentiality Top
11.1. Confidentiality - policy
11.1.1 Are confidential data transmitted to Eurostat? No
11.1.2 If yes, are they confidential in the sense of Reg. (EC) 223/2009?
11.1.3 Describe the data confidentiality policy in place

Confidential data can be accessed only by the ones involved in the production of official statistics, to the extent that they need for performing their duties properly. If the number of the statistical unit in any cell of the data table formed by aggregating the individual data is less than three or one or two of the statistical units are dominant even if the number of units is three or more, the data in the concerned cell is considered confidential. The confidential data compiled, processed and preserved for the production of official statistics cannot be delivered to any administrative, judiciary or military authority or person, can not be used for purposes other than statistics or as an instrument of proof. Civil servants and other staff in charge of compiling and processing these data are obliged to comply with this rule. This obligation continues after the related personnel leave their duties and posts. The rulers of the institutions and organisations producing official statistics shall take all measures to prevent any illicit access, use or revelation of the confidential data. Data or information obtained from sources that are open to all people shall not be deemed confidential. Data confidentiality ceases when a statistical unit gives written approval for the revelation of confidential data concerning itself. Confidential data can be published only as combined with other data so as not to allow any direct or indirect identification.

11.2. Confidentiality - data treatment
11.2.1 Describe the procedures for ensuring confidentiality during dissemination

If the number of the statistical unit in any cell of the data table formed by aggregating the individual data is less than three or one or two of the statistical units are dominant even if the number of units is three or more, the data in the concerned cell is considered confidential.

11.2.2 Additional comments


12. Comment Top


Related metadata Top


Annexes Top