Farm structure (ef)

National Reference Metadata in ESS Standard for Quality Reports Structure (ESQRS)

Compiling agency: National Statistics Office (NSO)


Eurostat metadata
Reference metadata
1. Contact
2. Statistical presentation
3. Statistical processing
4. Quality management
5. Relevance
6. Accuracy and reliability
7. Timeliness and punctuality
8. Coherence and comparability
9. Accessibility and clarity
10. Cost and Burden
11. Confidentiality
12. Comment
Related Metadata
Annexes (including footnotes)


For any question on data and metadata, please contact: Eurostat user support

Download


1. Contact Top
1.1. Contact organisation
National Statistics Office (NSO)
1.2. Contact organisation unit
Unit B3: Environment, Energy, Transport and Agriculture Statistics
1.5. Contact mail address
National Statistics Office (NSO), Unit B3: Environment, Energy, Transport and Agriculture Statistics, Lascaris, Valletta VLT2000, Malta


2. Statistical presentation Top
2.1. Data description
1. Brief history of the national survey 
Up to 1954, agricultural censuses used to be held every year under the provisions of the Agricultural Returns Ordinance 1935 as amended by Act XIX of 1949 and fell within the remit of the Department of Agriculture.  The Central Office of Statistics (COS) had been set up in 1947 but had no legal basis; however on May 1955 the law was enacted, in the shape of the Statistics Act XV of 1955.  Consequently, the COS carried out the 1956 Census of Agriculture covering the period October 1955 to September 1956.  Data collected from farmers and breeders included:  land area cultivated or left fallow; crops produced; livestock; farm labour; machinery; and any other particulars related to agriculture and the rural characteristics of the Maltese Islands.  A series of agricultural censuses ensued up to 1982/83, after which there was an 18-year break in the holding of the census.

The 1955 Act was superseded by the Malta Statistics Authority Act XXIV of 2000 which came into effect on 1 March 2001.  The Census of Agriculture 2001 was one of the first major operations to be undertaken under the new act.  As from the date of accession in the European Union, Malta has followed the legislation as laid down in Council Regulation 571/88 and has carried out a Farm Structure Survey in 2003, 2005 and 2007, a census in 2010 and a FSS in 2013 and 2016.  The census of 2010 and the FSS 2013 were done according to the Commission Regulation (EC) No 1166/2008.  The National Statistics Office was the official body responsible for undertaking the FSS in 2016.


2. Legal framework of the national survey 
- the national legal framework In Malta the legal basis for the collection of agricultural statistical data is the Malta Statistics Authority Act No XXIV, enacted in the year 2000.  This places full responsibility on the National Statistics Office to carry out any statistical survey and to produce official statistics.  Extracts from the Act, of the main functions of the office are:

Section 10

(2a) “to provide on an impartial basis, quantitative and representative information about the economic, demographic, gender issues, social and environmental situation in Malta, to all users including the Parliament, the Government, institutions, ….. ; where possible such data should be provided on a regional basis”.

(2b) “produce the data, and shall be subject to the principles of reliability, objectivity, relevance, statistical confidentiality, transparency, specificity and proportionality”.

(2c) “supply the information necessary to evaluate the quality of official statistics and make accessible to the public the methods used for their production.”

Section 35

“The Director General may prepare forms, questionnaires and other records for the collection of information under this Act and the instructions necessary for their proper completion, and shall specify the date or period within which these completed forms, questionnaires and other records or the required information shall be returned to the Authority.”

- the obligations of the respondents with respect to the survey The filling in of statistical questionnaires is compulsory under the Malta Statistics Authority Act.
- the identification, protection and obligations of survey enumerators All persons engaged in the data collection, handling and processing of data are obliged to keep the confidentiality.
2.2. Classification system

[Not requested]

2.3. Coverage - sector

[Not requested]

2.4. Statistical concepts and definitions
List of abbreviations
COS - Central Office for Statistics
2.5. Statistical unit
The national definition of the agricultural holding
Agricultural holding means a single unit, both technically and economically, which has a single management and which undertakes the following agricultural activities either as its primary or secondary activity:

 - Growing of non-perennial crops, mainly vegetables and melons, roots and tubers, flowers, fodder

 - Growing of perennial crops, mainly grapes, citrus, pome fruits and stone fruits

 - Plant propagation

 - Animal production

 - Mixed farming

Holdings maintaining only agricultural land in good agricultural and environmental conditions are included.

2.6. Statistical population
1. The number of holdings forming the entire universe of agricultural holdings in the country
The number of agricultural holdings amounts to 12438.


2. The national survey coverage: the thresholds applied in the national survey and the geographical coverage
No thresholds were applied and the survey covers the whole Malta.


3. The number of holdings in the national survey coverage 
The number of agricultural holdings amounts to 12438


4. The survey coverage of the records sent to Eurostat
The records sent to Eurostat do not cover holdings with no agricultural activities or with only kitchen garden in the survey reference year, and holdings that were of type 9 (e.g. had only fallow land) in 2010 which were not taken into consideration when the 2016 FSS sample was taken.


5. The number of holdings in the population covered by the records transferred to Eurostat
The records sent to Eurostat represent 9315 agricultural holdings.


6. Holdings with standard output equal to zero included in the records sent to Eurostat
There are 39 holdings of this kind  in the sample  (103 holdings in the population).  They have fallow land. The holdings with fallow land keep this land in good agricultural and environmental conditions.  Out of the 39 holdings with fallow land, 3 are not included in IACS.


7. Proofs that the requirements stipulated in art. 3.2 the Regulation 1166/2008 are met in the data transmitted to Eurostat
Not applicable because no threshold is applied.


8. Proofs that the requirements stipulated in art. 3.3 the Regulation 1166/2008 are met in the data transmitted to Eurostat
No threshold is applied. Implicitly all thresholds set by art 3.3 are met.


2.7. Reference area
Location of the holding. The criteria used to determine the NUTS3 region of the holding
For all the farmers that live in Malta, all the land they work is in Malta,  whereas for all the farmers that live in Gozo&Comino all the land they work is in Gozo & Comino.
2.8. Coverage - Time
Reference periods/dates of all main groups of characteristics (both included in the EU Regulation 1166/2008 and surveyed only for national purposes)
For permanent crops, arable land, mushrooms, and organic land reference period was 1 September 2015 – 31 August 2016.

For cattle, sheep, goats and poultry, data referred to 1 September 2016 while for pigs the reference date was 1 December 2016.  Detailed data on pigs was collected in the annual census among the pig breeders held every year while for the cattle, sheep and goats administrative data is used.

For labour force, the reference period referred to the 12 months preceding the reference day of the survey (1 September 2015-31 August 2016). 

For rural development measures, the reference period was the last 3 calendar years i.e. 2013, 2014, 2015.

2.9. Base period

[Not requested]


3. Statistical processing Top
1.Survey process and timetable
Stage Date
Survey design May 2016
Sample chosen April 2016
FSS questionnaire May 2016
Training of interviewers September 2016
Survey date 1 September 2016
Survey closed 30 November 2016
Inputting of data November 2016 – February 2017
Follow up March 2017
Checking of data April – May 2017
Data compilation June - July 2017
Initial transmission to Eurostat July 2017
Final results December 2017


2. The bodies involved and the share of responsibilities among bodies
The National Statistics Office was the official body responsible for undertaking the FSS in 2016.


3. Serious deviations from the established timetable (if any)
All the established timeframes were kept.
3.1. Source data
1. Source of data
The FSS 2016 was based on a sample survey.  Some of the variables were obtained directly from the administrative sources.


2. (Sampling) frame
The sample of the FSS was chosen from the farm register.

The Unit maintains the agricultural register, which consists of a central database having the personal details of the holding and the data from previous surveys. This enables the unit to compile and extract an updated list of holdings for the FSS.  No threshold is applied to the register.

The agricultural register is updated frequently and new units may be traced from surveys carried out directly by the Unit and other administrative sources.


3. Sampling design
3.1 The sampling design
One-stage stratified random sampling of holdings.
3.2 The stratification variables
The sample was stratified by farm type, economic size and region.

Maltese agriculture is diverse and limited in size.  As a result, it was not feasible to sample all farm types at the 3-digit level of typology.  In order to overcome this phenomenon and to obtain a representative sample from each stratum, certain farm types were grouped according to the following typology codes.

Farm type Typology codes
1 161, 166, 615, 833, 843
2 211, 212, 213, 221, 222, 223, 231, 232, 233, 611, 612, 616
3 351, 352, 353, 354, 613
4 361, 362, 365, 370, 380, 614
5 450, 460, 470, 841, 842
6 481, 482, 483, 484, 741, 834, 844
7 511, 512, 513, 521, 522, 523, 530, 731, 732, 742

Besides, the economic size classes were grouped as follows: 1-3, 4-7, >=8. 

  Lower limit of the economic size classes Upper limit of the economic size classes
1-3   8,000
4-7 8,000 100,000
>=8 100,000  
3.3 The full coverage strata
There are two full coverage strata.
3.4 The method for the determination of the overall sample size
The overall sample size of the holdings to be sampled has been always 1,500.  With such an amount, the sample precision is always 0.8 per cent.
3.5 The method for the allocation of the overall sample size
The optimum allocation method was the preferred method for selecting agricultural holdings by minimising the variance within the strata.  Thus, the holdings in each stratum, except for those exhaustively surveyed, were chosen on the proportion of the total standard deviation of the total standard output of the holdings within each stratum.  The formula for extracting the number of holdings to be surveyed under the optimum allocation method is:


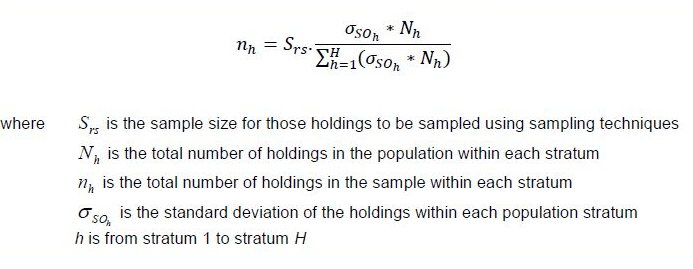
3.6 Sampling across time
A new sample is chosen for every survey.
3.7 The software tool used in the sample selection
Microsoft Excel
3.8 Other relevant information, if any
Not available.


4. Use of administrative data sources
4.1 Name, time reference and updating
Bovine Register - The Bovine Register which is maintained by the Veterinary Regulatory Directorate at the Civil Abattoir within the Ministry of Sustainable Development, Enviroment and Climate change was set up in 2002 in accordance with Regulation (EC) 1760/2000 (establishing a system for the identification and registration of bovine animals and regarding the labelling of beef and beef products). Identification and registration of all animals is carried out and registered in the database. Decision 2004/588/EC recognises the fully operational character of the Maltese database for bovine animals.

Organic Register - The organic register is in accordance with the Council Regulation No. 834/2007.  Data in the organic register is updated during the year and the list is forwarded to our office.  The Standards and Metrology Institute within the Malta Competition and Consumer Affairs Authority is the office responsible to grant certification or not to farmers.  Periodic surveillance visits (at least annually) are carried out on certified organic farms / producers.  Clients are required to keep all records on how they grow or process organic products, what chemicals, fertilizers, etc. are in use.   Such records are inspected on every visit and tests for illegal use of pesticides, chemicals, etc. are carried out when it is suspected or complaints are received that the client is not practicing organic farming as required by Council Regulation (EC) No. 834/2007.

Paying Agency -  The paying agency, operates an effective administrative set-up to ensure an efficient, effective and timely processing of claims and to provide accurate and timely information to the Commission, the local entities and to the farming community. The Paying Agency is set up in accordance with Regulation (EU) No. 1306/2013 of the European Parliament and of the Council and Commission Regulations (EC) No. 883/2006 and 885/2006.

4.2 Organisational setting on the use of administrative sources
In article 38 of the Malta Statistics Authority Act: Notwithstanding anything contained in any other law enjoining secrecy, any person or undertaking who holds records from which, in the opinion of the Director General, information relating to matters specified in the First Schedule can be obtained, shall grant to the Director General  or an officer of statistics access to such records for obtaining the said information.  We do not participate in the conceptual design of the administrative sources.
4.3 The purpose of the use of administrative sources - link to the file
Please access the information in the file at the link: (link available as soon as possible)


4.4 Quality assessment of the administrative sources
  Method  Shortcoming detected Measure taken
- coherence of the reporting unit (holding) In Malta the definition of the agricultural holding is the same as the one in the Regulation 1166/2008. -  
- coherence of definitions of characteristics   Bovine Register: In the bovine register there is not any distinction between heifers, dairy cows and other cows since females bovines are classified only in 2 categories.  Bovine Register: In the census of agriculture 2010 we have collected detailed cattle data directly from the farms.  From such data we have obtained the respective coefficient which is used to have the breakdown.
- coverage:      
  over-coverage   -  
  under-coverage Bovine register: The bovine register held in Malta is according to Regulation (EC) No 1760/2000 and Regulation (EC) No 911/2004.  All the movements from one farm to another are only authorised by the animal health section. All this information is recorded. Farm Register:
Regarding sheep and goats, at the moment there could be households that have sheep and/or goats which are not covered by the farm register.  But there is a total coverage of over 80 per cent in the farm register.
 
  misclassification   -  
  multiple listings   -  
- missing data   -  
- errors in data   -  
- processing errors   -  
- comparability   -  
- other (if any)   -  


4.5 Management of metadata
The metadata of the administrative sources is available in electronic format and it is updated over time.
4.6 Reporting units and matching procedures
In Malta the definition of the agricultural holding is the same as the one in the Regulation 1166/2008.  
The data from the administrative sources is linked with the farmer ID card for the paying agency and organic register. In the sample chosen there was only 4 farmers that are certified organic or are in conversion to organic.
For the bovine register the data is linked with the licence number as all cattle breeders have a licence.
4.7 Difficulties using additional administrative sources not currently used
Not relevant.
3.2. Frequency of data collection
Frequency of data collection
The survey is carried out every 3 years.
3.3. Data collection
1. Data collection modes
All the farmers were interviewed at the holder’s address.  A paper-based questionnaire was used.


2. Data entry modes
Since the compilation of data was carried out by the NSO officials, the filled in questionnaires were collected on a weekly basis and were checked instantly for any inconsistencies.  Data entry started during the first week of November 2016.  The software application used for data entry was built in-house.


3. Measures taken to increase response rates
The section took care that the farmer's list is based on up-to-date information.  When contact information was not provided we searched different administrative sources such as the population census register and in most of the cases we succeeded in finding the updated information.  We have also used call-back strategies for those farmers that at first have refused to take part and after explaining to them over the telephone the importance of such survey they have accepted to be interviewed.


4. Monitoring of response and non-response
1 Number of holdings in the survey frame plus possible (new) holdings added afterwards

In case of a census 1=3+4+5

9276
2 Number of holdings in the gross sample plus possible (new) holdings added to the sample

Only for sample survey, in which case 2=3+4+5

1525
3 Number of ineligible holdings 55
3.1 Number of ineligible holdings with ceased activities

This item is a subset of 3.

 25
4 Number of holdings with unknown eligibility status

4>4.1+4.2

0
4.1 Number of holdings with unknown eligibility status – re-weighted 0
4.2 Number of holdings with unknown eligibility status – imputed 0
5 Number of eligible holdings

5=5.1+5.2

1470
5.1 Number of eligible non-responding holdings

5.1>=5.1.1+5.1.2

1
5.1.1 Number of eligible non-responding holdings – re-weighted 1
5.1.2 Number of eligible non-responding holdings – imputed  0
5.2 Number of eligible responding holdings 1469
6 Number of the records in the dataset 

6=5.2+5.1.2+4.2

1469


5. Questionnaire(s) - in annex
See the annex.


Annexes:
3.3-5. FSS 2016_Questionnaire
3.4. Data validation
Data validation
A thorough check of completed questionnaires is an integral part of the processing system. 

Data control started at the collection stage.  The interviewer was obliged to verify the totals for consistency during the actual filling in of the questionnaire.  

Once field checking was completed, interviewers had to submit the questionnaires to the staff of the National Statistics Office, where the questionnaires were subject to a manual verification for completeness.  In cases where information was either missing or not clear, the holder was contacted by telephone for clarification.

This phase was then followed by the data entry stage where computer validations of the individual data were made. This involves logic and consistency checks with previous data, checks for extreme values and reconciliation of the total declared area information to the area declaration covered by the crop.  Moreover, the computer application was designed in such a way that for any error encountered a dialog box displaying the error message popped up.

After the data entry stage, all data was again validated and verified through Eurostat’s validation rules as laid out in Annex 7 of the Data Supplier Manual.

Tools used for data validation: Microsoft Access, Microsoft Excel and SPSS.

3.5. Data compilation
Methodology for determination of weights (extrapolation factors)
1. Design weights
The weights were calculated by dividing the population in stratum h by the number of holdings to be sampled in the same stratum.
2. Adjustment of weights for non-response

A correction factor was applied where the final sample within the strata differed from the initial sample within the strata.  The final weighting was thus:

3. Adjustment of weights to external data sources
Not applicable.
4. Any other applied adjustment of weights
Not applicable.
3.6. Adjustment

[Not requested]


4. Quality management Top
4.1. Quality assurance

[Not requested]

4.2. Quality management - assessment

[Not requested]


5. Relevance Top
5.1. Relevance - User Needs
Main groups of characteristics surveyed only for national purposes 
In the FSS 2016, the only data collected for national purposes only, referred to the method of irrigation used to irrigate the crops such as drip, sprinkler etc.  This was done so that we could calculate the amount of water used in the reference year. The data collected together with climatological data obtained from the Meteorological Office at the Malta International Airport was fed into the model.  This model was the result of a survey to estimate the volume of water used for irrigation that was carried out in 2008 under Grant Agreement 40701.2008.001-2008.130.  Such data is used by the National Statistics Office in order to have a time series of estimated water used in irrigation and also the Malta Resources Authority.
5.2. Relevance - User Satisfaction

[Not requested]

5.3. Completeness
Non-existent (NE) and non-significant (NS) characteristics - link to the file. Characteristics possibly not collected for other reasons
Please access the information in the file at the link: (link available as soon as possible)
5.3.1. Data completeness - rate

[Not requested]


6. Accuracy and reliability Top
6.1. Accuracy - overall
Main sources of error
In the FSS survey, the present errors are the sampling error and the non-sampling error.  The latter is attributed to the unit non-response which amounted to 1 holding and also to the different classification of some of the holdings before and after the survey.  The reclassification of the holdings from one strata to another was applied according to the data collected in the FSS.
6.2. Sampling error
Method used for estimation of relative standard errors (RSEs)
The standard error for each variable was calculated using the formula below:


where  
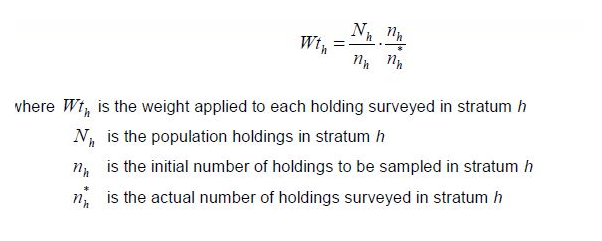
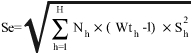
is the weight applied to each holding surveyed in stratum h,

          is the number of holdings in stratum h,

            is the variance within stratum h.

6.2.1. Sampling error - indicators

1. Relative standard errors (RSEs) - in annex


2. Reasons for possible cases where precision requirements are applicable and estimated RSEs are above the thresholds
There are no cases where precision requirements are applicable and RSEs exceed thresholds.


Annexes:
6.2.1-1. Relative Standard Errors
6.3. Non-sampling error

See below

6.3.1. Coverage error
1. Under-coverage errors
The survey revealed 4 new units.  These were included in both the population frame and in the sample.  An additional 3 units were included in the sample.  Such holdings emerged from holdings that their land was transferred to other existing holdings in the population.  These were not considered as new units because these holdings already existed in the population frame.


2. Over-coverage errors
There were a total of 25 holdings that were in the sample frame and do not belong to the target population.  Such holdings were removed.
In addition, there are 30 holdings removed from the data published by Eurostat as they have only kitchen gardens or no agricultural activities during the reference year.
2.1 Multiple listings 
Not applicable.


3. Misclassification errors
Such errors were related to the different classification of some of the holdings before and after the survey.  The reclassification of the holdings from one stratum to another was applied because from the data collected in the FSS we have noticed that the holding does not belong to the original stratum and therefore we have updated accordingly.  The weights were updated accordingly.


4. Contact errors
For those holdings which did not have correct contact data, the interviewer went on the spot and if the farmer was not found, he left him a note, and the farmer contacted our office to arrange for an interview.


5. Other relevant information, if any
Not available.
6.3.1.1. Over-coverage - rate
Over-coverage - rate
The proportion of the out-of-scope units in the gross sample amounted to 3.6%. 
6.3.1.2. Common units - proportion

[Not requested]

6.3.2. Measurement error
Characteristics that caused high measurement errors
A thorough check of completed questionnaires is an integral part of the processing system.  Data control started at the collection stage.  In order to avoid errors during the initial stages of data collection, all interviewers were instructed to interview not more than five holdings and return the booklets to the unit for an assessment to identify any mistakes undertaken during the interviewing stage.  This exercise helped the interviewer to reduce the number of errors in the remaining questionnaires.  Also, the interviewer was obliged to verify the totals for consistency during the actual filling in of the questionnaire.   Once field checking was completed, interviewers had to submit the questionnaires to the section, where the questionnaires were subject to a manual verification for completeness.  In cases where information was either missing or not clear, the holder was contacted by telephone for clarification.

The above measures were taken in order to minimise as much as possible the measurement errors.  Basically the following characteristics caused some measurement errors:

Family persons working on the holding - E_1_3_M_1_24, E_1_3_M_25_49, E_1_3_M_50_74......E_1_3_F_100 - Respondents' inability to provide accurate answers

Non-family persons regularly working on the holding - E_1_4_M_1_24, E_1_4_M_25_49, E_1_4_M_50_74......E_1_4_F_100 - Respondents' inability to provide accurate answers

6.3.3. Non response error
1. Unit non-response: reasons, analysis and treatment
Non-response referred to those holdings which, either refused to co-operate or holdings that could not be contacted. These were accounted for by re-weighting.

The number of non-respondents amounted to 1 holding, which was unreachable.  The unit non-response is so low that there is no impact on non-response bias.


2. Item non-response: characteristics, reasons and treatment
There were no partly completed questionnaires.
6.3.3.1. Unit non-response - rate
Unit non-response - rate
0.07%
6.3.3.2. Item non-response - rate
Item non-response - rate
Not applicable.
6.3.4. Processing error
1. Imputation methods
Not applicable.


2. Other sources of processing errors
When there were some discrepancies with the data collected in the census, the farmer was contacted again and in most of the cases he confirmed the data provided against some justification.  

No processing errors were encountered as a result that the data was thoroughly checked in the data input stage.


3. Tools used and people/organisations authorised to make corrections
People in the section of the Environment, Energy, Transport and Agriculture statistics made the necessary corrections.
6.3.4.1. Imputation - rate
Imputation - rate
Not applicable.
6.3.5. Model assumption error

[Not requested]

6.4. Seasonal adjustment

[Not requested]

6.5. Data revision - policy
Data revision - policy
Data collected in the FSS 2016 is final when it is published and there will not be any revisions.
6.6. Data revision - practice
Data revision - practice
Not applicable.
6.6.1. Data revision - average size

[Not requested]


7. Timeliness and punctuality Top
7.1. Timeliness

See below

7.1.1. Time lag - first result
Time lag - first result
Not available.
7.1.2. Time lag - final result
Time lag - final result
The exact time lag is not yet known.
7.2. Punctuality

See below

7.2.1. Punctuality - delivery and publication
Punctuality - delivery and publication
The data of FSS 2016 was transmitted according to the stipulated deadline.


8. Coherence and comparability Top
8.1. Comparability - geographical
1. National vs. EU definition of the agricultural holding
There are not any differences.


2.National survey coverage vs. coverage of the records sent to Eurostat
The population covered in the national survey includes also those holdings that have only kitchen garden or no agricultural activities during the 2016 reference year and holdings which were of type 9 (e.g. had only fallow land) in 2010 which were not taken into consideration when the 2016 FSS sample was taken.


3. National vs. EU characteristics
For the Farm Structure Survey (FSS) definitions, handbook version 9 was used for the FSS 2016. 

In Malta, the Annual Work Unit (AWU) is equivalent to 1 800 hours or more.


4. Common land
4.1 Current methodology for collecting information on the common land
Common land does not exist in Malta.
4.2 Possible problems encountered in relation to the collection of information on common land and possible solutions for future FSS surveys
Not applicable.
4.3 Total area of common land in the reference year
Not applicable.
4.4 Number of agricultural holdings making use of the common land or Number of (especially created) common land holdings in the reference year
Not applicable.


5. Differences across regions within the country
Not applicable.


6. Organic farming. Possible differences between national standards and rules for certification of organic products and the ones set out in Council Regulation No.834/2007
Data on organic farming that is included in the FSS is obtained directly from the administrative source.  Such data is in line with the rules in Council Regulation no. 834/2007.
8.1.1. Asymmetry for mirror flow statistics - coefficient

[Not requested]

8.2. Comparability - over time
1. Possible changes of the definition of the agricultural holding
There have been no changes.


2. Possible changes in the coverage of holdings for which records are sent to Eurostat
There have been some changes but not enough to warrant the designation of a break in series: the data sent to Eurostat for FSS 2016 could only be compared to the census data of 2010 by eliminating the unclassified holdings from the census 2010.


3. Changes of definitions and/or reference time and/or measurements of characteristics
There were no changes.


4. Changes over time in the results as compared to previous FSS, which may be attributed to sampling variability
Since the FSS 2016 was carried out as a sample survey, the results contain some margin of error and there is a confidence interval for each of the variables.


5. Common land
5.1 Possible changes in the decision or in the methodology to collect common land
Not applicable.
5.2 Change of the total area of common land and of the number of agricultural holdings making use of the common land / number of common land holdings
Not applicable.


6. Major trends on the main characteristics compared with the previous FSS survey
Main characteristic Current FSS survey Previous FSS survey
entire coverage (coverage of data as transmitted to Eurostat)
Difference in % Comments
Number of holdings 9 315 8 555

+8.9

 
Utilised agricultural area (ha) 11 175 10 670        +4.7  
Arable land (ha) 9 111 8 572 +6.3  
Cereals (ha) 0 0  
Industrial plants (ha) 0 0  
Plants harvested green (ha) 5 647 5 290 +6.7 In the last years there was a shift from vegetables to plants harvested green.  This could be because farmers in Malta are facing competition from imported products and they decide to grow only fodder.
Fallow land (ha) 887 563 +57.5 In the last years there was a shift from the kitchen garden to fallow land.  This could be because of increases in the production costs and also to the fact that farmers in Malta are facing competition from imported products.
Permanent grassland (ha)  0  0  
Permanent crops (ha) 1 311 1 264 +3.7  
Livestock units (LSU) 32 467 34 928 -7.0  
Cattle (heads)  14 717 14 949 -1.5  
Sheep (heads) 13 141 9 916 +32.5 Sheep have increased in the last few years.
Goats (heads)  4 536 4 032 +12.5 Goats have increased in the last few years.
Pigs (heads) 41 643 51 641 -19.4 The amounts of pigs held on farms decreased in the last 3 years since some farms have stopped rearing.  Also such drop was also confirmed in the number of slaughtered pigs in these last 3 years.  Slaughtering data is obtained directly from the civil abattoir. 
Poultry (heads) 778 557 914 372 -14.9 There was a decrease in the broilers and layers in the last 3 years. 
Family labour force (persons) 14 712 13 114  +12.2 Family persons are giving more input into the farm.
Family labour force (AWU) 4 571 3 828 +19.4
Non family labour force regularly employed (persons) 708 560 +26.4 Also non-family persons are giving more input into the farm. 
Non family labour force regularly employed (AWU) 498 423 +17.9


8.2.1. Length of comparable time series

[Not requested]

8.3. Coherence - cross domain
1. Coherence at micro level with other data collections
The data collected for each farmer is compared to the data collected in the previous FSS.  In the coming months, if will have more time we are going to compare the data at farm level with the data from IACS.


2. Coherence at macro level with other data collections
Livestock data collected for the FSS 2016 with the reference data of 1 September 2016 was compared to the annual surveys with both of the data being obtained from the administrative source (bovine register).  For example from the FSS cattle amounted to 14 717 heads while for the annual survey there were 14 356 heads.    Data on livestock collected in the survey is comparable to the annual surveys carried out in December.

Data collected in the FSS 2016 is used for the compilation of the crop data and therefore they are comparable.

8.4. Coherence - sub annual and annual statistics

[Not requested]

8.5. Coherence - National Accounts

[Not requested]

8.6. Coherence - internal

[Not requested]


9. Accessibility and clarity Top
9.1. Dissemination format - News release

[Not requested]

9.2. Dissemination format - Publications
1. The nature of publications
A news release with the final results is compiled.


2. Date of issuing (actual or planned)
Planned for 2018


3. References for on-line publications
http://www.nso.gov.mt/themes/theme_page.aspx?id=52
9.3. Dissemination format - online database
Dissemination format - online database
Not available.
9.3.1. Data tables - consultations
Data tables - consultations
Not available.
9.4. Dissemination format - microdata access
Dissemination format - microdata access
Micro-data is not disseminated.
9.5. Dissemination format - other

[Not requested]

9.6. Documentation on methodology
1. Available documentation on methodology
In the news release, there is part on the methodology of FSS (http://www.nso.gov.mt/themes/theme_page.aspx?id=52).


2. Main scientific references
Not available.
9.7. Quality management - documentation
Quality management - documentation
In 2018, a copy of the quality report will be available on the NSO website.
9.7.1. Metadata completeness - rate

[Not requested]

9.7.2. Metadata - consultations

[Not requested]


10. Cost and Burden Top
Co-ordination with other surveys: burden on respondents
During 2016, besides the FSS there was also the FADN (which is carried out also by the National Statistics Office according to an agreement with the Agriculture and Rural Payment Agency). A number of questions were included in the FADN Survey to cater for the variables for the FSS.


11. Confidentiality Top
11.1. Confidentiality - policy
Confidentiality - policy
All individual data collected during the FSS is strictly confidential.  No data, which might single out individual information, may be published.
11.2. Confidentiality - data treatment
Confidentiality - data treatment
The data is not treated for confidentiality because from the data sent one could not get directly to a specific farm.  Also in Malta, we publish only aggregated data.


12. Comment Top
1. Possible improvements in the future
Not available.


2. Other annexes
Not available.


Related metadata Top


Annexes Top