| 6. Accuracy and reliability |
Top |
|
|
| 6.1. Accuracy - overall |
| Main sources of error |
| The results for a population of units (in this case holdings) ascertained with a sample are usually flawed with random sampling errors, even if the sample is conducted with the greatest thoroughness. The sample-based errors arise because not all units of the relevant population are surveyed and the results of the randomised sample holdings may deviate from the “true value” of the whole. In addition to sample-based errors, there are also non-sample-based, systematic errors. Non-sample-based errors can result from shortcomings in the survey technique, in the selection of the population of holdings or in the processing technique. Non-responses can, in turn, lead to systematic errors when the surveyed units provide no or incomplete information. |
|
| 6.2. Sampling error |
| Method used for estimation of relative standard errors (RSEs) |
| To assess the quality of results gained from a sample, they must be statistically evaluated by means of error calculation. Therefore, the national results of the FSS are produced using a processing program in which a calculation of the simple relative standard errors is integrated on the basis of the individual values for representative results. The simple relative standard error is used as the measure for the size of the random error and calculated in a stratified random sample using the following formula: 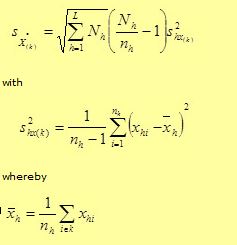
h = stratum
Nh = number of holdings in stratum h
nh = number of sample holdings in stratum h
xhi = variable value i (i=1,2,…..,nh) in stratum h
 = mean value of the variables in stratum h = mean value of the variables in stratum h For reasons of clarity, the standard errors (in %) were not published as error calculation results. Instead, a corresponding alphabetic character is placed after the representative resultant values, which stands for the respective error class of the simple relative standard error. Allocation of the error classes of the simple relative standard errors:
A: to under ± 2 percent
B: ± 2 to under ± 5 percent
C: ± 5 to under ± 10 percent
D: ± 10 to under ± 15 percent
E: ± 15 percent and more Results that fell under error class E were replaced in the national publication tables by the character “/” because the estimation error is then too great and the numerical value thus not reliable enough. In these cases, the sample size is too small for the assertion made. This can occur among variables that are too infrequent. The error marking is intended to enable users to sufficiently estimate the reliability for their purposes. Several variable groups, such as, land use, livestock, organic farming, were surveyed in total in the 2016 FSS for national purpose, therefore in the national publication there were no RSEs shown for those variable groups. In national publications RSEs were only calculated for sample surveyed characteristics. |
|
| 6.2.1. Sampling error - indicators |
1. Relative standard errors (RSEs) - in annex
| 2. Reasons for possible cases where precision requirements are applicable and estimated RSEs are above the thresholds |
| Attached RSEs were calculated on the basis of the sample survey, which are delivered to Eurostat. There are no cases where precision requirements are applicable and estimated RSE's are above the thresholds. |
Annexes:
6.2.1-1. Relative standard errors (RSE)
|
| 6.3. Non-sampling error |
See below |
| 6.3.1. Coverage error |
| 1. Under-coverage errors |
| Errors can basically occur when determining the sample population regardless of the method used. Under-coverage can occur when holdings that are agricultural holdings in the legal sense are not identified as such and are therefore not surveyed. The population for the 2016 Farm Structure Survey was defined with great care. The Farm register, which serves as the basis for determining the population, is regularly managed and updated by the statistical offices of the Länder. Primarily various administrative sources as well as information from past surveys are used to update the register (cf. Section 3.1. Source data - item 4). |
| 2. Over-coverage errors |
| Over-coverage occurs when holdings that do not or no longer belong to the target population and are therefore not (or no longer) obligated to respond are surveyed. These holdings are so-called “false non-responses” (cf. Section 6.3.3. Non response error - item 1). In order to prevent this, holdings that are identified as below the threshold or that have abandoned agricultural production are labelled accordingly in the Farm Register and no longer considered when drawing the sampling frame. The Farm Register is regularly updated by the statistical offices of the Länder. Moreover the questionnaire contains a question whether the holding reaches the coverage thresholds. Holdings which do not fulfill the thresholds are marked during data processing and excluded from further data processing. In general false non-responses only have an effect on the sampling error and can deteriorate the relative standard error. These "false" non-responses did not change the extrapolation factor. How we dealt with non-responses and their extrapolation is explained in more detail in section 3.5. Data compilation - item 2. |
| 2.1 Multiple listings |
| In order to prevent multiple listings (particularly when adding new respondents), a duplicate search is conducted in the Farm Register. Additionally, the holdings get distinct identification numbers. The integrated duplicate search (carried out using the names and locations of the holdings) and constant comparisons with various administrative sources practically exclude multiple listings from the same unit. If a number of holdings are listed under one address – not necessarily an error – this situation is checked immediately (e.g. by telephone). In case of doubt they were surveyed as new respondents. |
| 3. Misclassification errors |
| The variables used for the classification are surveyed and checked in the FSS. So misclassification errors cannot occur in this survey. |
| 4. Contact errors |
| The respondents can enter changes of address or correct errors in the address in the questionnaire. The address changes provided are checked for postal correctness, then transferred to the Farm Register and promptly displayed during the processing procedure. Contact data are not always changed entirely in the questionnaire. Obvious incomplete or erroneous information (e.g. post code) or survey documents that cannot be delivered by post are corrected using public registries (telephone books, Internet), in part also using administrative sources, through enquiries with the register of residents, municipalities, trade or regulatory agencies as well as through queries among respondents. |
| 5. Other relevant information, if any |
| Not available. |
|
| 6.3.1.1. Over-coverage - rate |
| Over-coverage - rate |
| 5 022 holdings of the frame did not fulfill the survey thresholds and were excluded from further data processing. The proportion of out-of scope units in the gross sample was 6.0 percent. |
|
| 6.3.1.2. Common units - proportion |
[Not requested] |
| 6.3.2. Measurement error |
| Characteristics that caused high measurement errors |
| The primary reasons for missing or erroneous information in the 2016 Farm Structure Survey are the size of the questionnaire and different reference periods between variables. Furthermore, some questionnaire variables are considered sensitive by respondents (e.g. ownership and tenancy including rents (national purpose), and the manure management), which lessens response willingness. In addition, and in despite of the great care that was taken in preparing the questionnaire comprehension difficulties frequently occurred in the questionnaire sections soil cover, tillage methods, crop rotation and questions about other gainful activities, as the relatively large number of follow-up enquiries by farmers showed. In one Land there were technical difficulties of matching länder specific rural development measures and EU rural development measures. All measurement errors were corrected – if recognised as such, for example through distinct deviations from previous year or experienced values – during data editing. Moreover a pretest was conducted with voluntary farmers to improve the questionnaire. In the context of the pretest, the performance and the usability (understanding / user-friendliness) of the online-questionnaire were tested. |
|
| 6.3.3. Non response error |
| 1. Unit non-response: reasons, analysis and treatment |
| Unit non-responses are non-sampling errors. We differentiate between “true” and “false” non-responses. “True” non-responses are holdings that existed at the survey time and should have been surveyed but for which no responses are available. This also includes holdings that were newly created in the meantime, either as new establishments or through farm division, or that were not recorded due to gaps in the population. The same applies to holdings that were surveyed but refused to respond. The “false” non-responses are holdings that no longer existed at the time of the survey or no longer belonged to the group of respondents. While the extrapolation factor was adapted when possible for sample holdings that were “true” non-responses (in this case refusals), the “false”non-responses did not change the extrapolation factor. How we dealt with non-responses and their extrapolation is explained in more detail in section 3.5. Data compilation - item 2. A non-response analysis was not conducted. |
| 2. Item non-response: characteristics, reasons and treatment |
| Item non-responses were primarily supplemented by means of telephone follow-ups with the farmers. If they refused to provide information even on follow-ups, missing values were supplemented using imputation methods (cf. Section 6.3.4. Processing error - item 1.). There were problems with response willingness mainly with variables considered as sensitive such as ownership and type of tenure (including rents), the breakdown of the number of workers and work hours, soil management and farm manure which required a comparatively large amount of follow-ups with the respondents. |
|
| 6.3.3.1. Unit non-response - rate |
| Unit non-response - rate |
| A total of 700 of 78 064 agricultural holdings refused to respond to the 2016 FSS, equaling a non-response rate of approx. 0.9%.[1]
[1] This includes only “true” non-responses (cf. Section 6.3.3. Non response error - item 1.). |
|
| 6.3.3.2. Item non-response - rate |
| Item non-response - rate |
| Not available. |
|
| 6.3.4. Processing error |
| 1. Imputation methods |
| As described above, missing and inconsistent values were – wherever possible – completed by means of follow-ups with the respondents and only in exceptional cases through comparisons with previous surveys or administrative sources (cold deck imputation) or individual data from similar holdings (hot deck imputation). The majority of the statistical offices of the Länder employ cold deck imputation; hot deck imputation is used in five offices of the Länder. |
| 2. Other sources of processing errors |
Processing errors occur during processing of statistics, for example during signing, data capture or corrections made during data editing. To prevent processing errors, the programs used were tested extensively. To prevent signature errors or data capture errors, corresponding signature and value range checks were recorded in the data editing program. The tests and the plausibility checks minimised possible processing errors.
Most missing or erroneous information should be identified by the extensive data editing program. Where implausible or missing information occurred in the data material, they were completed or corrected by means of telephone follow-ups with the farmers, comparison with individual data of other holdings, comparison with previous surveys or comparison with administrative sources. The AGRA2010 processing program was the chief instrument for completeness and plausibility checks. This program stores 330 obligatory error tests, 207 facultative error tests and 15 automated corrections. In the following, we explain the differentiation of these error messages.
- Obligatory errors must be adjusted in all cases (e.g. missing age for an individual) and are obvious, unacceptable erroneous information or inconsistencies in correlations of data.
- Facultative errors occur when information or correlations of information are possible, but either are improbable or rare, taking into consideration the operating and economic circumstances in agriculture, or originate from chronologically different individual surveys and therefore need not necessarily match (e.g. maximum controls). In such cases, we checked whether and, if so, in what way correction of the relevant information is necessary through individual and targeted follow-ups with the holding or, from case to case, drawing on other information.
- Automatically adjusted errors are errors that can be corrected without a doubt and unequivocally based on the available information without follow-up interviews or data matching (e.g. by inserting missing total values).
The extensive plausibility checks cover the majority of the rules described in Annex 7 of the data supplier manual[1]. Due to a different approach in data editing, however, we cannot guarantee one-to-one implementation of the data editing rules. The transferred Eurofarm data material must consequently be verified for plausibility once again by Eurostat according to the rules in Annex VI of the data supplier manual. If the data editing program showed errors following the checks, these erroneous data had to be processed or corrected. Following these checks and the associated corrections no more missing or erroneous data should exist in the data material of the Farm Structure Survey.
[1] Eurofarm manual for data suppliers – Farm Structure Survey 2016, rev. 7, 20 December 2016 |
| 3. Tools used and people/organisations authorised to make corrections |
| All subsequent work on the individual material (follow-ups, corrections, input of data from administrative sources, etc.) was done by the staff members of the statistical offices of the Länder using the AGRA2010 processing and data editing program for agricultural statistics. |
|
| 6.3.4.1. Imputation - rate |
| Imputation - rate |
| The imputation rates of item non-response are not available. |
|
| 6.3.5. Model assumption error |
[Not requested] |
| 6.4. Seasonal adjustment |
[Not requested] |
| 6.5. Data revision - policy |
| Data revision - policy |
| We define a data revision as all subsequent modifications to data that have already been released to the public. This is the case when at first preliminary statistical results are published and final results at a later time. On principle, preliminary data are always identified as such in all publications. Errors in publications can also be the reason for data revisions. The treatment of errors in publications is prescribed at the Federal Statistical Office in a special guideline (Richtlinie zum Umgang mit Veröffentlichungsfehlern). Should publication errors occur they are allocated to error categories – depending on the severity of the error – and treated depending on the error category. Corrected data are then identified in the national publications by a special signature. The statistical offices of the Länder have comparable guidelines for handling publication errors or use a comparable procedure for revisions. |
|
| 6.6. Data revision - practice |
| Data revision - practice |
| Preliminary results were published online for the integrated Survey of Land Use as part of the 2016 FSS and in a press release, so there were two planned data revisions for the 2016 FSS (publication dates cf. Section 7.1.1). An additional data revision has been necessary due to errors in a national online publication on manure management (Series 2.2.2: Farm manure). The incorrect data were as quickly as possible corrected. The corrected data were flagged with a special signature. Additionally, errors, their reasons and treatments were described in the updated version of the publication. |
|
| 6.6.1. Data revision - average size |
[Not requested] |
