|
 |
|
| For any question on data and metadata, please contact: Eurostat user support |
|
|||
| 1.1. Contact organisation | German Federal Statistical Office |
||
| 1.2. Contact organisation unit | E106 "Structure of Earnings Survey, Labour Cost Survey, Statistics of Agreed Earnings" |
||
| 1.5. Contact mail address | Gustav-Stresemann-Ring 11 65189 Wiesbaden Germany |
||
|
|||
In this section of the national quality report only deviations from the EU quality report are reported. |
|||
| 2.1. Data description | |||
See EU quality report. |
|||
| 2.2. Classification system | |||
See EU quality report. |
|||
| 2.3. Coverage - sector | |||
See EU quality report. Optional NACE Rev. 2 Section O (Public administration and defence; compulsory social security) is covered. Optional size class of enterprises employing less than 10 employees (1 to 9) is covered. Nationally, NACE Rev. 2 Section A (Agriculture, forestry and fishing) is covered but data are not provided to Eurostat. |
|||
| 2.4. Statistical concepts and definitions | |||
See EU quality report. |
|||
| 2.5. Statistical unit | |||
See EU quality report. The statistical units are the employee job and local units with employee jobs. |
|||
| 2.6. Statistical population | |||
All employee jobs with remuneration in the reference month April 2018 in all local units of NACE Rev. 2 sections B to S. |
|||
| 2.7. Reference area | |||
The Federal Republic of Germany. |
|||
| 2.8. Coverage - Time | |||
2018 |
|||
| 2.9. Base period | |||
Not applicable. |
|||
|
|||
| 3.1. Source data | |||
Not requested. |
|||
| 3.2. Frequency of data collection | |||
Not requested. |
|||
| 3.3. Data collection | |||
Not requested. |
|||
| 3.4. Data validation | |||
Not requested. |
|||
| 3.5. Data compilation | |||
Not requested. |
|||
| 3.6. Adjustment | |||
Not requested. |
|||
|
|||
| 4.1. Quality assurance | |||
Not requested. |
|||
| 4.2. Quality management - assessment | |||
Not requested. |
|||
|
|||
| 5.1. Relevance - User Needs | |||
In Germany, the results of the survey are used by the federal government and the Land governments, employers' and workers' organisations, the Minimum Wage Commission, regional representative offices of industry, economic and social sciences research and insurance companies. These users are mainly concerned with the distribution of gross earnings, that is the proportion of employees above or below certain earnings thresholds or in earnings bands. Enquiries are most frequently from private individuals wishing to find out about the average earnings in a particular occupation. At the level of the European Union, the use for the gender pay gap, i.e. the earnings gap between women and men, by the Commission (Directorate General Justice) is of importance. |
|||
| 5.2. Relevance - User Satisfaction | |||
No specific attempt has been made to collect information about the data requirement of the main users, their assessment of its completeness or redundancy or their satisfaction with the data they have been offered. |
|||
| 5.3. Completeness | |||
Not requested. |
|||
| 5.3.1. Data completeness - rate | |||
Not requested. |
|||
|
||||||||||||||||||||||||||||||||||||||||||||||||
| 6.1. Accuracy - overall | ||||||||||||||||||||||||||||||||||||||||||||||||
Not requested. |
||||||||||||||||||||||||||||||||||||||||||||||||
| 6.2. Sampling error | ||||||||||||||||||||||||||||||||||||||||||||||||
The overall sampling error is small for key results. For average gross hourly earnings (variable 4.3) it has been estimated to 0.20% of the estimate. For more estimates see the attached document "Coefficients of variation". |
||||||||||||||||||||||||||||||||||||||||||||||||
| 6.2.1. Sampling error - indicators | ||||||||||||||||||||||||||||||||||||||||||||||||
See annexes for indicators. Annexes: Coefficients of variation |
||||||||||||||||||||||||||||||||||||||||||||||||
| 6.3. Non-sampling error | ||||||||||||||||||||||||||||||||||||||||||||||||
Not requested. |
||||||||||||||||||||||||||||||||||||||||||||||||
| 6.3.1. Coverage error | ||||||||||||||||||||||||||||||||||||||||||||||||
It can be assumed that employees with extremely high earnings have been under-represented: the sample for the 2018 SES included 103 employees (grossed-up 2486 employees) with gross annual earnings in excess of EUR 1 million. On the other hand, the official wage and income tax statistics for 2016 (more recent data not yet available) included 2 886 persons with an estimated gross salary in excess of EUR 1 million. The under-representation might be due to the fact that company managing and other directors were paid separately from other staff in what were sometimes highly confidential payroll systems and were not included in reporting. Companies were not expressly requested in questionnaires either to include such persons or a sample of them in reporting, or to leave them out. There is no indication of under-representation or over-representation of employees with very low earnings. |
||||||||||||||||||||||||||||||||||||||||||||||||
| 6.3.1.1. Over-coverage - rate | ||||||||||||||||||||||||||||||||||||||||||||||||
There was an over-representation rate of 3.4% for the sample of 60 000 local units taken from the Statistical Business Register. This means that 34 out of 1 000 sample local units were not part of the target population, |
||||||||||||||||||||||||||||||||||||||||||||||||
| 6.3.1.2. Common units - proportion | ||||||||||||||||||||||||||||||||||||||||||||||||
There was no use of administrative data. The indicator is not directly applicable. But there was use of multiple data sources: 1) a sample of 60 000 local units in NACE Rev. 2 Sections A to S excluding O with jobs obliged to social security The sample covers 89% of the total SES 2018 target population. The SES variables were surveyed mainly by online questionnaire. 2) a sample of 245 000 employee jobs in NACE Rev. 2 Sections O and P in public employment The sample covers 10% of the total SES 2018 target population. The sample was taken from another national 100%-survey on public employment. The SES variables were generated on basis of the variables of that survey. 3) a sample of 10 000 local units in NACE Rev. 2 Sections A to S excluding O with no jobs obliged to social security (i.e. with jobs only in marginal employment [Geringfügige Beschäftigung]) The sample covers 2% of the total SES 2018 target population. The sample was taken from an administrative source with 100% coverage. The SES variables were generated by hot-deck-imputation using information from the data source no. 1. There is no overlap between sources 1 and 3 by definition. Overlap between sources 1 and 2 was observed during the field work and was adjusted by removing the unit from source 1. Overlap between sources 2 and 3 is expected to be very small. |
||||||||||||||||||||||||||||||||||||||||||||||||
| 6.3.2. Measurement error | ||||||||||||||||||||||||||||||||||||||||||||||||
Errors in collecting the data were kept as few as possible through detailed questionnaires and explanations of all variables. Payroll accounting definitions were adhered to closely, which means that the respondents were able to take most variables directly from the payroll. This included, in particular, the use of the code indicating activities in statutory social security reporting. The code must be used and maintained by employers for social security purposes with regard to all workers covered by social security (Data recording and transfer ordinance – DEÜV). The code had to be entered to all nine digits in the 2018 SES, making it unnecessary to use plain text to indicate occupation and education. This arrangement has considerably simplified matters for the respondents and statistical offices, but has made the quality of the survey variables obtained from the survey dependent on the quality of the code and its conversion into international classifications of occupation (ISCO-08) and education (ISCED 2011).
|
||||||||||||||||||||||||||||||||||||||||||||||||
| 6.3.3. Non response error | ||||||||||||||||||||||||||||||||||||||||||||||||
Unit response rate of the sample survey (main data source no. 1 in chapter 6.3.1.3): 96.8% = 57 237 / (57 237 + 746) (relating to the local units in the sample that belonged to the target population, i.e. "in-scope respondents"). 55 882 of the 60 000 local units in the sample submitted reports. 1308 of the 4118 non-reporting local units belonged to the target population and 2810 did not (see over-coverage rate under 6.3.1.1). |
||||||||||||||||||||||||||||||||||||||||||||||||
| 6.3.3.1. Unit non-response - rate | ||||||||||||||||||||||||||||||||||||||||||||||||
Unit non-response rate of the sample survey (main data source no. 1 in chapter 6.3.1.3): 3.2% of in-scope local units did not respond. About half of them were local units of enterprises with 1 to 9 employees. |
||||||||||||||||||||||||||||||||||||||||||||||||
| 6.3.3.2. Item non-response - rate | ||||||||||||||||||||||||||||||||||||||||||||||||
For most variables, missing data had been supplemented by re-contacting the respondent local units, until the data set was complete. Only if this was impossible were implausible or missing data estimated from comparable values for similar workers or average values from other surveys concerning earnings statistics. These cases were not flagged, making it impossible to count and to compute an item non-response rate. For two variables it was possible: The Highest successfully completed level of education and training variable (2.5) was derived from two national variables indicating formal respectively vocational education from statutory social security reporting. Both variables offer the option "Education unknown, no entry possible". The reporting local units used this option in 21% for formal education and in 18% for vocational education. |
||||||||||||||||||||||||||||||||||||||||||||||||
| 6.3.4. Processing error | ||||||||||||||||||||||||||||||||||||||||||||||||
Not requested. |
||||||||||||||||||||||||||||||||||||||||||||||||
| 6.3.4.1. Imputation - rate | ||||||||||||||||||||||||||||||||||||||||||||||||
Population imputation rate No such rate could be calculated, as missing data had in all cases been supplemented by re-contacting the respondent local units, until the data set was complete. Only if this was impossible were implausible or missing data estimated from comparable values for similar workers or average values from other surveys concerning earnings statistics. These cases were not flagged, making it impossible to compute an imputation rate. Item imputation rate for variable Gross earnings in reference month (4.2) No such rate could be calculated, as missing data had in all cases been supplemented by re-contacting the respondent local units, until the data set was complete. Item imputation rate for other variables For two variables the calculation was possible: The Highest successfully completed level of education and training variable (2.5) was derived from two national variables indicating formal respectively vocational education from statutory social security reporting. Both variables offer the option "Education unknown, no entry possible". The reporting local units used this option in 21% for formal education and in 18% for vocational education. The missing information was imputed by hot-deck-imputation using software CANCEIS by Statistics Canada. |
||||||||||||||||||||||||||||||||||||||||||||||||
| 6.3.5. Model assumption error | ||||||||||||||||||||||||||||||||||||||||||||||||
Correction of Unit-Nonresponse The 3.2% shortfall through Unit-Nonresponse was offset by giving the reporters belonging to the same sampling stratum a higher grossing-up factor. Data for sections O "Public administration, defence; compulsory social security" and P "Education" in public employment (data source no. 2 of chapter 6.3.1.2.) All of the data for section O and most of the data for section P were not collected by the SES survey but created on basis of the data of another national survey. The basic framework was provided by the data records available at almost individual level for 4.3 million public-sector employees from public-sector workforce statistics (Personalstandstatistik) as at 30 June 2018. The public-sector workforce statistics are an annual survey of all employees of public-sector employers. Only a few variables of the public-sector workforce statistics could be directly transferred to the dataset of the Structure of Earnings Survey. They included gender (2.1), age (2.2), contractual working hours (2.7), the normal number of working hours of a full-time worker (2.7.1) and gross monthly earnings in June 2018 (in the case of collectively-agreed changes extrapolated to April 2018) for variable 4.2. Unlike in the case of other data items, June, not April, is considered to be the reference month, except for in the case of gross monthly earnings. Other variables could only be approximated from the public-sector workforce statistics variables by making plausible assumptions. For example, Occupation (2.3) and Highest successfully completed level of education and training (2.5) were entered using the remuneration group and employment area. In the absence of data concerning taxes and social security contributions in the public-sector workforce statistics, they have been calculated using legal requirements (contribution rates, contribution ceilings, intermediate categories for midi-jobs, additional worker contribution rate, guidelines relating to the Income Tax Act). Wage tax category 1 has been assumed for all workers, since it was impossible to differentiate between wage tax categories. This means that the wage taxes (4.2.3.2) of women have been underestimated and those of men overestimated on average. The top-ups for part-time work for older employees are not taxed and no social security contributions are payable. Account has been taken of this in calculations based on the assumption of wage category 1. Seniority has been calculated on the basis of age and level of education. The following variables could not be derived and calculated and were entered as zero: Number of overtime hours paid in the reference month (3.2.1), Remuneration for overtime (4.2.1) and Special payments for shift work (4.2.2). The drops in quality are presumably very small in section P, where shift work and the payment of overtime are rare. This is not the case in section O, however, since special working hours are common in certain occupations, for example in the police and fire service. There is no information concerning enterprise size categories. Because the data relate exclusively to workers in the public sector, the biggest enterprise size category (1 000 or more employees) was assumed. Data for local units in sections A to S excluding O with no jobs under social security (data source no. 3 of chapter 6.3.1.2.) To reduce burden local units with no jobs under social security were not taken to the sampling frame of the SES sample survey (data source no. 1 of chapter 6.3.1.2.). All of these units have only marginal employment jobs (Geringfügige Beschäftigung). Most of them are very small units, on average they have about two (marginal employment) jobs. Instead, a sample of 10 000 of these 425 000 local units was taken from an administrative source with 100% coverage. The variables geographical location (1.1) and economic activity (1.3) were known from the administrative source, as well the number of employee jobs in April 2018. The remaining SES variables of the local unit and all variables of the employee jobs were imputed by hot-deck-imputation using CANCEIS by Statistics Canada. |
||||||||||||||||||||||||||||||||||||||||||||||||
| 6.4. Seasonal adjustment | ||||||||||||||||||||||||||||||||||||||||||||||||
No seasonal adjustment necessary. No seasonal adjustment done. |
||||||||||||||||||||||||||||||||||||||||||||||||
| 6.5. Data revision - policy | ||||||||||||||||||||||||||||||||||||||||||||||||
A preliminary result was prepared for the first time for the 2018 earnings structure survey. The background for this was the need for data on the topic of employment in and below the minimum wage, in particular by the Minimum Wage Commission. |
||||||||||||||||||||||||||||||||||||||||||||||||
| 6.6. Data revision - practice | ||||||||||||||||||||||||||||||||||||||||||||||||
Data collection and plausibility checks were carried out decentral in the statistical offices of the Länder from 1 January 2019 to February/March/April 2020. For the reason mentioned in point 6.5, a deduction of the plausible material in the state statistical offices was sent to the Federal Statistical Office at the end of November 2019. At that time, about 88% of the reports of the companies were available. On this basis, a provisional and at the same time representative result was determined with the help of mathematical-statistical methods. |
||||||||||||||||||||||||||||||||||||||||||||||||
| 6.6.1. Data revision - average size | ||||||||||||||||||||||||||||||||||||||||||||||||
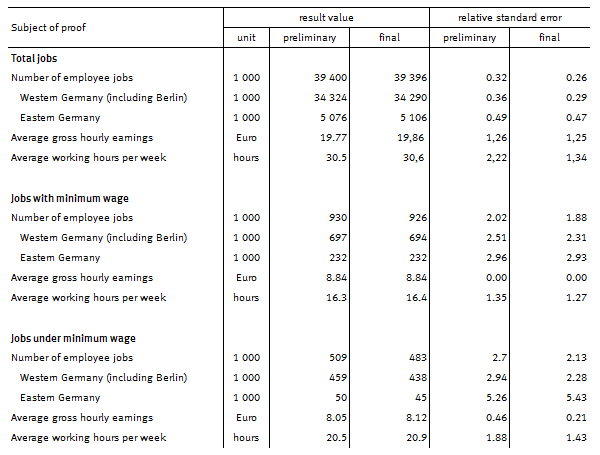
Publication of the results based on the preliminary data was limited to the number of employee jobs, average gross hourly earnings and the average number of working hours per week. In addition to comparing the preliminary and final results, the following table also presents the relative standard errors as an indicator of the robustness of the data.
|
||||||||||||||||||||||||||||||||||||||||||||||||
|
|||
| 7.1. Timeliness | |||
See 7.1.1. |
|||
| 7.1.1. Time lag - first result | |||
The first results at national level were published with a press release on 27 February 2020. This means that there was a period of 14 months between the reference period and first publication. Normally, first SES results are published 19 months after the reference period. But for SES 2018 there was a special demand for data by the German Minimum Wage Commission due February 2020 to be met. |
|||
| 7.1.2. Time lag - final result | |||
Final results were first published with a press release on 29 June 2020. Most results were published in an online publication for downloading on 14 September 2020. This means that there was a period of 21 months between the reference period and main publication. |
|||
| 7.2. Punctuality | |||
The time schedule was met. The Federal Statistical Office draw the sample for the SES sample survey (the main data source no. 1 of chapter 6.3.1.2.) in September and October 2018. Field work was carried out by 14 Land statistical offices. The selected local units received the online survey questionnaire in January and February 2019. The reply deadline was usually 31 March 2019, but varied from mid March to the end of April. After that date, local units that had failed to reply were sent phased reminders, warnings and notices of administrative proceedings. The survey data were collected and checked and any further questions were sent to the local units during this period. The plausibility checks were completed and the data collected sent to the Federal Statistical Office in in the period from end of February to beginning of April 2020, depending on the Land office (the originally planned deadline was 31 March 2020). From January to June 2020, the Federal Statistical Office generated data for data sources 2 and 3 of chapter 6.3.1.2. It imputed missing data and computed final weights for grossing-up. It checked, returned and corrected the data collected by the Land statistical offices using Eurostat’s and own checks. |
|||
| 7.2.1. Punctuality - delivery and publication | |||
The Federal Statistical Office delivered final data to Eurostat on 15 June 2020. This was 15 days before the legal deadline of 30 June 2020. The Federal Statistical Office published first results on 27 February 2020 as scheduled. |
|||
|
|||
| 8.1. Comparability - geographical | |||
Results for section O "Public administration, defence; compulsory social security" (all) and section P "Education" (most) were determined not through the SES survey, but through estimation procedures. The geographical comparability of the results of these sections with other EU States is limited by the estimation procedures. Further, there was no information about enterprise size categories. Because all the workers were in the public sector, the biggest enterprise size category (1 000 or more employees) was always chosen and entered in variable 1.2. |
|||
| 8.1.1. Asymmetry for mirror flow statistics - coefficient | |||
Not applicable. |
|||
| 8.2. Comparability - over time | |||
Comparability over time is limited and should be checked carefully. Do not compare between 2018 and before 2014:
Background and explanations for the limited comparability For reference year 2014 the German SES sample survey was significantly improved to provide better data for the analysis of effects of the introduction of a general minimum wage in Germany 1 January 2015. Measures had been taken to reach full coverage of employee jobs and better coherence to other national statistics on employment. A) Changes in coverage limiting comparability over time In 2014 for the first time the German SES covered NACE rev. 2 section A and local units of enterprise size class 1-9 employees. Generally, comparisons over time should be restricted to NACE rev. 2 sections B to S and enterprise size classes 10+ employees. But also for this population the coverage increased. In 2014, the SES sample survey covered 3 groups of jobs, not covered before: 1) Local units which cross the 10+ threshold only after taking into account marginal employment Before 2014, the units of the sampling frame were defined as all units with at least 10 jobs. Marginal employment jobs (Geringfügige Beschäftigung) could not be taken into account because there was no information available. For SES 2014 this information was available. Consequently, more units passed the threshold of 10 jobs and made the 10+ sampling frame and survey population bigger. Compared to 2010 this increased the survey population by about 2.2 million jobs or 10%, most of them (naturally) marginal jobs. Almost all marginal jobs are part-time jobs. Therefore the change does not affect statistics on full-time employment. 2) Local units in NACE Rev. 2 activities P85.1 to P85.4 in private ownership Before 2014, SES did not cover private kindergartens, schools and universities due to missing information in the sampling frame, the Statistical business register. For SES 2014 the missing information became available and the units were covered. Compared to 2010 this increased the survey population by about 0.4 million jobs or 2%. 3) Local units with less than 10 jobs of enterprises with 10+ jobs Before 2014, the SES sample was based on local units with 10+ jobs. Local units with less than 10 jobs but belonging to an enterprise with 10+ jobs were not covered. SES 2014 sample covered all sizes of local units. Compared to 2010 this increased the survey population by about 0.3 million jobs or 1%. B) Changes in methods limiting comparability over time Before 2014, SES was grossed-up by a simple Horvitz–Thompson method. No adjustment was done for weaknesses of the sampling frame as inactive or missing units. SES 2014 used a generalized regression estimator (GREG) for grossing-up. The auxiliary information used in the GREG was the number of jobs in the reference month in the local unit according to the social security register. This brought SES 2014 job count in coherence to other national statistics on employment (see chapter 8.3.). Compared to 2010 the method increased the population (sections B to S, size classes 10+ employees) by about 2.0 million jobs or 9%. Special national dataset preserving comparability The Federal Statistical Office of Germany has available a data set which preserves comparability between SES 2018 and before SES 2014. The data set allows setting back the changes A and B completely. The Federal Statistical Office uses this data set if comparability over time is essential for the analysis |
|||
| 8.2.1. Length of comparable time series | |||
For enterprise size class 10 or more employees in NACE Rev. 2 sections B to F (NACE Rev. 1 sections C to F respectively) time series are available from 1995 to 2018. For enterprise size class 10 or more employees in NACE Rev. 2 sections B to N (NACE Rev. 1 sections C to K respectively) time series are available from 2001 to 2018. For enterprise size class 10 or more employees in NACE Rev. 2 sections B to S time series are available from 2006 to 2018. |
|||
| 8.3. Coherence - cross domain | |||
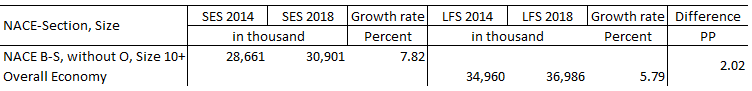
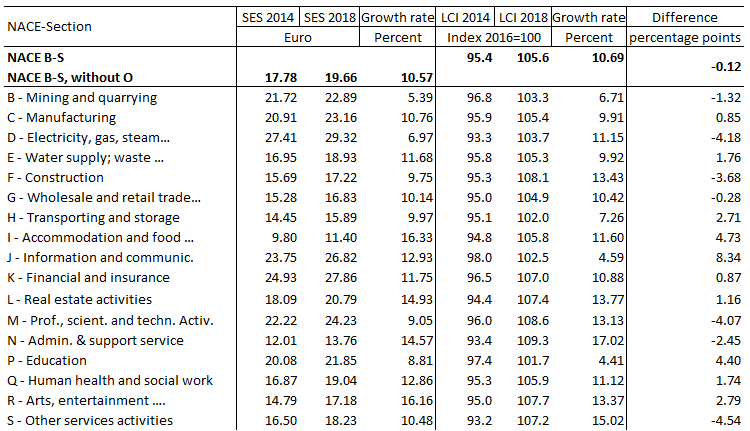
The grossing-up method applied to the SES sample produced good coherence of SES 2018 and other national statistics. Full coherence is not achievable due to different cut-off thresholds and coverage of NACE sections. Eurostat has requested the following cross-domain comparisons based on the results published in the Eurostat database for SES 2018. For comparisons with National Accounts see point 8.5. LCI: Labour Cost Index Table:Rate of change number of employment relationships
Table: Development of average gross hourly earnings vs. average change Index Wages and Salaries
Table: Rate of change paid hours per month vs. weekly working time in the main job
|
|||
| 8.4. Coherence - sub annual and annual statistics | |||
Not requested. |
|||
| 8.5. Coherence - National Accounts | |||
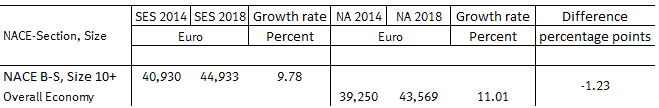
Overall, the comparison of mean levels of earnings signals good coherence between SES and National Accounts for 2018. Table: Development of average gross hourly earnings compared to the average change in compensation of employees
Table: Development of average gross annual earnings and compensation of employees
|
|||
| 8.6. Coherence - internal | |||
Not requested. |
|||


|
|||
According to EU-regulation No. 698/2006 reporting on accessibility and clarity is due 31 December 2021. Information on this chapter is preliminary and will be updated by 31 December 2021. |
|||
| 9.1. Dissemination format - News release | |||
Press release No. 060/2020 of the Federal Statistical Office on 27 February 2020: "Number of minimum wage jobs continuously down between 2015 and 2018". Press release No. 238/2020 of the Federal Statistical Office on 26 June 2020: "Just under two million jobs benefit from minimum wage increase in 2019". Press release No. 416/2020 of the Federal Statistical Office on 14 September 2020: "8 million low-wage jobs in 2018". |
|||
| 9.2. Dissemination format - Publications | |||
Federal Statistical Office: Verdienststrukturerhebung 2018 [Structures of Earnings Survey 2018]. Volume 16, Books 1 to 3, Wiesbaden: September 2018. The Books 1 to 3 refer to Germany, West Germany including Berlin, East Germany. |
|||
| 9.3. Dissemination format - online database | |||
No dissemination via online database. |
|||
| 9.3.1. Data tables - consultations | |||
Not applicable. |
|||
| 9.4. Dissemination format - microdata access | |||
The micro-data of the Structure of Earnings Surveys (or the former Surveys of Salary and Wage Structure) for 1990, 1992, 1995, 2001, 2006, 2010,2014 and 2018 are provided by the research data centres of the Federal and Land statistical offices for academic research purposes. The surveys for all the years are available in-house the research data centres (visiting academics, remote data processing). A Public-Use-File is now available for survey years 2001 to 2014 and a Scientific-Use-File for survey years 2001 to 2014 (https://www.forschungsdatenzentrum.de/en). A Scientific-Use-File for 2018 is coming soon. |
|||
| 9.5. Dissemination format - other | |||
Online map from 29 June 2020: "Minimum wage: interactive map shows regions that are particularly affected". The Land statistical offices publish own press releases and publications for regions. To a certain extend the Federal Statistical Office and the Land statistical offices provide tailor-made tables and analyes if requested by users. The reporting local units were sent the results only on request. |
|||
| 9.6. Documentation on methodology | |||
Will be updated by 31 December 2021. |
|||
| 9.7. Quality management - documentation | |||
A national quality report was produced and published, see Annexes. The report includes the questionnaire of the SES 2018 sample survey. |
|||
| 9.7.1. Metadata completeness - rate | |||
Not requested. |
|||
| 9.7.2. Metadata - consultations | |||
Not requested. |
|||
|
|||
The burden on respondents associated with the SES 2018 sample survey was estimated to amount to 7.9 million Euro. |
|||
|
|||
| 11.1. Confidentiality - policy | |||
Not requested. |
|||
| 11.2. Confidentiality - data treatment | |||
Not requested. |
|||
|
|||
Not requested. |
|||
|
|||
|
|||
| National Quality Report (in German) |
|||