 |
|
 |
|
| For any question on data and metadata, please contact: EUROPEAN STATISTICAL DATA SUPPORT |
|
|||
| 1.1. Contact organisation | Statistics Norway. |
||
| 1.2. Contact organisation unit | Division For income and wage statistics. |
||
| 1.5. Contact mail address | Statistisk sentralbyrå |
||
|
|||
| 2.1. Data description | |||
This report covers all the main points related to quality that are normally covered and commented on in connection with the publication of statistics, and in this case statistics on earnings. The aim is to supply information on the quality of the data and statistics from Norway that are reported to and distributed by Eurostat in connection with the Structure of Earnings Survey 2014. Since the national statistics on earnings are the same as those forwarded in connection with the survey mentioned above, this report should also be of interest to users of national statistics on earnings published on Statistics Norway’s website. |
|||
| 2.2. Classification system | |||
The "economic activity" is coded in NACE Rev. 2 (General industrial classification of economic activities within the European Communities) whereas the "occupation" is coded on the use of the International Standard Classification of Occupations (ISCO-08). Information on the 'Highest successfully completed level of education and training' variable is classified using the International Standard Classification of Education, 2011 version (ISCED 2011). Regional breakdown is based on the Nomenclature of Territorial Units for Statistics (NUTS) reference year 2014. |
|||
| 2.3. Coverage - sector | |||
The SES 2014 statistics for Norway cover all economic activities defined in NACE Rev. 2 sections B to S, excluding O. The enterprises included employ at least 10 employees and the size classes (corresponding to the number of employees) available are 10 to 49, 50 to 249, 250 to 499, 500 to 999 and more than 1 000. The size class of enterprises employing less than 10 employees (1 to 9) is optional and covered by Norway. Small enterprises with fewer than three, four or five employees according to industry, is not included in the statistics. |
|||
| 2.4. Statistical concepts and definitions | |||
Employees are all persons who have a direct employment contract with the enterprise or local unit and receive remuneration, irrespective of the type of work performed, the number of hours worked (full or part-time) and the duration of the contract (fixed or indefinite). Mean annual gross earnings gives the actual gross earnings in the year 2014. Mean monthly gross earnings in the reference month cover remuneration in cash paid before any tax deductions and social security contributions payable by wage earners and retained by the employer. Mean hourly gross earnings are defined as gross earnings in the reference month divided by the number of hours paid during the same period. Number of hours paid includes all normal and overtime hours worked and remunerated by the employer during the reference month. Hours not worked but nevertheless paid are counted as 'paid hours' (e.g. for annual leave, public holidays, paid sick leave, paid vocational training, paid special leave, etc.). |
|||
| 2.5. Statistical unit | |||
The compilation of structural statistics on earnings is based on local units and enterprises, and provides information on employees in enterprises classified by size and economic activity. The statistical units are identical to the units used in other countries. The reference population is basically all active enterprises in the section, with the exception of small enterprises with less than 3, 4 or 5 employees (depending on section), which are not included in the reference population. The statistics cover all activities defined in NACE Rev. 2 sections B to S (excluding O). |
|||
| 2.6. Statistical population | |||
The SES 2014 statistics for Norway refer to enterprises in the areas of economic activities defined by NACE Rev. 2 sections B to S, excluding O. |
|||
| 2.7. Reference area | |||
Norway. |
|||
| 2.8. Coverage - Time | |||
2014. |
|||
| 2.9. Base period | |||
2014. |
|||
|
|||||||||||||||||||||||||||||||||||||||||||||||||||||||||||||||||||||||||||||||||||||||||||||||||||||||||||||||||||||||||||||
| 3.1. Source data | |||||||||||||||||||||||||||||||||||||||||||||||||||||||||||||||||||||||||||||||||||||||||||||||||||||||||||||||||||||||||||||
The statistics are constructed by compiling several separate sample surveys. All of these surveys are subject to possible errors due to the sampling methods applied, the quality of the reporting and the quality of the source used as population. The populations for all surveys on earnings are based on the Norwegian Central Register of Enterprises and Establishments. All enterprises with local units that have employees in the reference period are included as the population. The sample in each survey is limited by use of cut-off, which varies between industries.
a) Probability sampling All of the aforementioned surveys are based on stratified random sampling of clusters (sampling unit), where the clusters are defined as enterprises and their local units by section according to Nace Rev. 2. Education (section P) and Health and social work (section Q) industries in particular include both private enterprises and public enterprises. The latter are included in full, not as a sample. Weights are calculated by use of post stratification procedures, calculating the inverse inclusion probability, the aim being to estimate how many employed persons there are in the population in the reference period. The main aim is of course by using weights to make it possible to estimate earnings of the population.
Stratification The variables used for stratification are industry and number of employees. Each of the industries represent a separate survey in the national earnings statistics. The stratification is different for each industry when defining size groups of enterprises and sub-groups of industry. The reason for this is that the distribution of small and large enterprises is different between industries, and furthermore that what can be called large may vary a great deal from one industry to another. These properties and arguments are especially important if the level and distribution of earnings are actually different from one stratum to another within the same industry. Annexes: Sample design |
|||||||||||||||||||||||||||||||||||||||||||||||||||||||||||||||||||||||||||||||||||||||||||||||||||||||||||||||||||||||||||||
| 3.2. Frequency of data collection | |||||||||||||||||||||||||||||||||||||||||||||||||||||||||||||||||||||||||||||||||||||||||||||||||||||||||||||||||||||||||||||
Annually. |
|||||||||||||||||||||||||||||||||||||||||||||||||||||||||||||||||||||||||||||||||||||||||||||||||||||||||||||||||||||||||||||
| 3.3. Data collection | |||||||||||||||||||||||||||||||||||||||||||||||||||||||||||||||||||||||||||||||||||||||||||||||||||||||||||||||||||||||||||||
All of the surveys are based on stratified random sampling of clusters (sampling unit), where the clusters are defined as enterprises and their local units by section according to Nace rev. 2. |
|||||||||||||||||||||||||||||||||||||||||||||||||||||||||||||||||||||||||||||||||||||||||||||||||||||||||||||||||||||||||||||
| 3.4. Data validation | |||||||||||||||||||||||||||||||||||||||||||||||||||||||||||||||||||||||||||||||||||||||||||||||||||||||||||||||||||||||||||||
Data validation consists of global checks and plausibility checks. Global checks are necessary to ensure that microdata records consist of complete data. All microdata records contain data for all mandatory variables. Furthermore, plausibility checks on all variables were done to ensure that the data are reasonable and consistent with other variables. Measurement errors are identified and corrected both by logical, automated computer controls, as well as manual checks of extreme outliers and conspicuous changes in wage levels, and number of employees in the enterprises, compared to the previous years. |
|||||||||||||||||||||||||||||||||||||||||||||||||||||||||||||||||||||||||||||||||||||||||||||||||||||||||||||||||||||||||||||
| 3.5. Data compilation | |||||||||||||||||||||||||||||||||||||||||||||||||||||||||||||||||||||||||||||||||||||||||||||||||||||||||||||||||||||||||||||
Probability sampling
All of the surveys are based on stratified random sampling of clusters (sampling unit), where the clusters are defined as enterprises and their local units by section according to Nace rev. 2. Education (section P) and Health and social work (section Q) industries in particular include both private enterprises and public enterprises. The latter are included in full, not as a sample.
Weights are calculated by use of post stratification procedures, calculating the inverse inclusion probability, the aim being to estimate how many employed persons there are in the population in the reference period. The main aim is of course by using weights to make it possible to estimate earnings of the population. Estimation of weights
Below, all comments on population refer to the population as it is found and defined by use of Norway’s Central Register of Establishments and Enterprises, for the relevant industries.
Notation
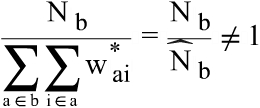
The weights in the Norwegian Structure of Earnings Survey are defined as:
1)
2) gives an estimation of the number of enterprises in a strata b in the population. The preferred ideal for the weights in the earnings statistics is to be able to express
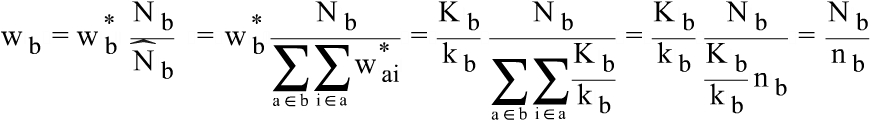
Post-stratification procedures to establish This implies that we wish the final weights to give an estimate on the number of employees in the population. The final weights can therefore be described as:
3) where
A further inspection of the weights can be done through a comparison with other sources.
It is clear that the final weighted distribution of the SES has a closer resemblance to the distributions found in the National Account (NA) and the Labour Force Survey (LFS). This does not prove the accuracy of the weights as far as estimation of earnings is concerned, but the improvement of the distribution caused by the weights is a claim that they at least make for a better understanding of the actual composition of the population. |
|||||||||||||||||||||||||||||||||||||||||||||||||||||||||||||||||||||||||||||||||||||||||||||||||||||||||||||||||||||||||||||
| 3.6. Adjustment | |||||||||||||||||||||||||||||||||||||||||||||||||||||||||||||||||||||||||||||||||||||||||||||||||||||||||||||||||||||||||||||
Not applicable. |
|||||||||||||||||||||||||||||||||||||||||||||||||||||||||||||||||||||||||||||||||||||||||||||||||||||||||||||||||||||||||||||
|
|||
| 4.1. Quality assurance | |||
By collecting individual employees with person identification numbers it is possible to add information from administrative sources. The quality of these identification keys is stressed both in the questionnaires and in the administrative data and reduces the relative level of errors to a minimum. According to Regulation (EC) 530/1999 national authorities shall ensure that the results reflect the true situation of the total population of units with a sufficient degree of representativity. For Norway the statistical units, reference population and classifications used are all according to the international standards. |
|||
| 4.2. Quality management - assessment | |||
Upon transmission to Eurostat, SES microdata are checked for completeness and consistency. |
|||
|
|||
| 5.1. Relevance - User Needs | |||
The purpose of the statistics is to provide an overview of levels and changes in earnings for all employees (wage and salary earners) independent of industry or working hours, and in accordance with user needs. Statistics are provided for each industry separately, broken down by sex, occupational group, age, and educational level in order to meet the demands of public and private users. Major users outside Statistics Norway are the Technical Reporting Committee on the Income Settlement, research and policy institutes, employee and employer organisations, Eurostat, ILO, OECD, the media, enterprises, and private persons. The statistics are also used in Statistics Norway's Labour Accounts and in quarterly wage indices. |
|||
| 5.2. Relevance - User Satisfaction | |||
Based on the extensive use and feedback concerning Statistics Norway's earnings statistics, it is generally perceived that the statistics meet most user needs. Expressed needs for more statistics from the source are always an integral part of planning annual work programmes within the field. |
|||
| 5.3. Completeness | |||
SES microdata is provided for all mandatory variables and also for some of the optional variables. |
|||
| 5.3.1. Data completeness - rate | |||
41/32. |
|||
|
||||||||||||||||||||||||||||||||||||||||||||||||||||||||||||||||||||||||||||||||||||||||||||||||||||||||||||||||||||||||
| 6.1. Accuracy - overall | ||||||||||||||||||||||||||||||||||||||||||||||||||||||||||||||||||||||||||||||||||||||||||||||||||||||||||||||||||||||||
The statistics are constructed by compiling several separate sample surveys. All of these surveys are subject to possible errors due to the sampling methods applied, the quality of the reporting and the quality of the source used as population. The populations for all surveys on earnings are based on the Norwegian Central Register of Enterprises and Establishments. All enterprises with local units that have employees in the reference period are included as the population. The sample in each survey is limited by use of cut-off, which varies between industries. All of the aforementioned surveys are based on stratified random sampling of clusters (sampling unit), where the clusters are defined as enterprises and their local units by section according to Nace rev. 2. Education and Health and social work industries in particular include both private enterprises and public enterprises. The latter are included in full, not as a sample. Weights are calculated by use of post stratification procedures, calculating the inverse inclusion probability, the aim being to estimate how many employed persons there are in the population in the reference period. The main aim is of course by using weights to make it possible to estimate earnings of the population. |
||||||||||||||||||||||||||||||||||||||||||||||||||||||||||||||||||||||||||||||||||||||||||||||||||||||||||||||||||||||||
| 6.2. Sampling error | ||||||||||||||||||||||||||||||||||||||||||||||||||||||||||||||||||||||||||||||||||||||||||||||||||||||||||||||||||||||||
a) Probability sampling Bias The statistics on earnings are, as with all other sample based statistics, subject to bias, which arises when the distribution on some variables in different parts of the sample is not the same as the corresponding distribution in the population. Dividing the population into groups (strata) according to certain stratification variables reduces the possibility of imbalances in the sample. Partial non-response in several of the items collected by form and used in the wage statistics can normally be logically calculated on the basis of other information given on the form or imputed from earlier years. Post-stratification adjusts any imbalances arising in the distribution between the stratification variables due to non-response. The weights are additionally adjusted for any imbalances due to non-response. Non-response that is not randomly distributed may bias the separate samples for the different sections, and this may have some influence on these statistics. Non-response with respect to the number of employees reported to the wage statistics of Statistics Norway is between 0 and 5 per cent. Possible sample bias in the individual statistics will be of less importance for these statistics due to the considerable quantity of data it is based on. The use of cut-off may be a source of bias. In most industries, the sample consists of sampling units with five or more employees.
b) Non-probability sampling Not applicable |
||||||||||||||||||||||||||||||||||||||||||||||||||||||||||||||||||||||||||||||||||||||||||||||||||||||||||||||||||||||||
| 6.2.1. Sampling error - indicators | ||||||||||||||||||||||||||||||||||||||||||||||||||||||||||||||||||||||||||||||||||||||||||||||||||||||||||||||||||||||||
a) Probability sampling Variance Variance of interest in this case is variance that arises due to the size and composition of the sample, more specifically the sampling model, so-called sample variance. Statistics on earnings make use of random sampling of clusters (enterprises by industry), however the samples are large and this therefore results in relatively low variance. The coefficient of variance varies theoretically between 0 and 1, and is in some cases used as a percentage. A low value presents the argument that very little of the variance derives from the sample (Appendix A Coefficient of variance).
Coefficient of variance for monthly earnings of full-time employees in the SES, by industry
Annexes: Variance tables Appendix A Coefficient of variance |
||||||||||||||||||||||||||||||||||||||||||||||||||||||||||||||||||||||||||||||||||||||||||||||||||||||||||||||||||||||||
| 6.3. Non-sampling error | ||||||||||||||||||||||||||||||||||||||||||||||||||||||||||||||||||||||||||||||||||||||||||||||||||||||||||||||||||||||||
Statistics Norway have some challenges in the wage statistics with some non-sampling errors. |
||||||||||||||||||||||||||||||||||||||||||||||||||||||||||||||||||||||||||||||||||||||||||||||||||||||||||||||||||||||||
| 6.3.1. Coverage error | ||||||||||||||||||||||||||||||||||||||||||||||||||||||||||||||||||||||||||||||||||||||||||||||||||||||||||||||||||||||||
The population consists of all enterprises in Statistics Norway's Central Register of Establishments and Enterprises, with the exception of small enterprises with fewer than three, four or five employees according to industry. Each enterprise covers one or more local units grouped by industrial category. The sample in each section consists of enterprises drawn from the population, dependent on activity code and the number of employees. The wage statistics data are obtained for each person employed in the local units in the reference period covered in the industrial sectors according to Nace. Errors in the stratification variables, activity (Nace ) and number of employees could be a source of errors. Additionally, actual differences between the population and the sample may lead to problems such as over-coverage or under-coverage in sub-populations. In order to deal with this potential problem, the local units in the sample are asked to control the preprinted code of activity on the form. If this code is believed to be incorrect, the local units are asked to describe their activities in order to correct this code. In each specific case, this information is assessed in order to come up with a correct classification of the unit. In the wage statistics, some under-coverage may be expected due to a time lag in the registration of new units in the Central Register of Establishments and Enterprises. Over-coverage may also be present for the same reason, i.e. the time lag in the registration process when enterprises no longer have employees because the business has been closed, sold or taken over by new owners, has gone bankrupt or has been merged in the time period between the selection of the sample and the time of the census. As long as these errors are fairly constant, the effect on the statistics is minimal. |
||||||||||||||||||||||||||||||||||||||||||||||||||||||||||||||||||||||||||||||||||||||||||||||||||||||||||||||||||||||||
| 6.3.1.1. Over-coverage - rate | ||||||||||||||||||||||||||||||||||||||||||||||||||||||||||||||||||||||||||||||||||||||||||||||||||||||||||||||||||||||||
None. |
||||||||||||||||||||||||||||||||||||||||||||||||||||||||||||||||||||||||||||||||||||||||||||||||||||||||||||||||||||||||
| 6.3.1.2. Common units - proportion | ||||||||||||||||||||||||||||||||||||||||||||||||||||||||||||||||||||||||||||||||||||||||||||||||||||||||||||||||||||||||
Not applicable. |
||||||||||||||||||||||||||||||||||||||||||||||||||||||||||||||||||||||||||||||||||||||||||||||||||||||||||||||||||||||||
| 6.3.2. Measurement error | ||||||||||||||||||||||||||||||||||||||||||||||||||||||||||||||||||||||||||||||||||||||||||||||||||||||||||||||||||||||||
Measurement errors are defined as a discrepancy between the value of a variable reported by the respondent and the "true" value. Such errors mainly arise because the respondent lacks the information or finds it difficult to calculate the value. This may be due to the following:
However, the increasing use of the electronic standard for reporting statistics has reduced the amount of measurement errors in reporting. This standard basically retrieves wage data directly from the enterprises’ wage and personnel systems, thus eliminating several possible sources of error that arise when using traditional forms. On the other hand, new problems arise when making use of new methods of collection and processing. In general however, these problems have been more easily identified and corrected when making use of electronic solutions in data collection and processing. Measurement errors are identified and corrected both by logical, automated computer controls, as well as manual checks of extreme outliers and conspicuous changes in wage levels, and number of employees in the enterprises, compared to the previous years.
Distribution of collected observations by source. Per cent by industry, 2014
|
||||||||||||||||||||||||||||||||||||||||||||||||||||||||||||||||||||||||||||||||||||||||||||||||||||||||||||||||||||||||
| 6.3.3. Non response error | ||||||||||||||||||||||||||||||||||||||||||||||||||||||||||||||||||||||||||||||||||||||||||||||||||||||||||||||||||||||||
Unit non-response Unit non-response refers to the fact that the respondent, in this case an enterprise, has not completed and returned the statistics questionnaire. In the statistics, the unit non-response is between 0 and 11.4 per cent. The main reasons for non-response are that units have ceased to exist, been sold or transferred to a new owner, gone bankrupt or have been merged. Furthermore, there is also a small group reporting too late to be included in the statistics, or providing data of a quality that cannot be used for statistical purposes. In the case of unit non-response, the weights of the units on which the statistics are based are adjusted to compensate for the non-response.
Partial non-response In the case of methods making use of clusters as sampling units, it is necessary to make distinctions between two types of partial non-response. The first and most typical type of non-response for a sample survey is that the sample unit, enterprise in this case, has not reported all employees. The second type of non-response would be the traditional type, where elements of information regarding the unit of analysis are missing. Some of the items can often be calculated on the basis of other information and possibly imputed from previous years. For Norway, this kind of partial non response applies to a very small portion of the data reported. |
||||||||||||||||||||||||||||||||||||||||||||||||||||||||||||||||||||||||||||||||||||||||||||||||||||||||||||||||||||||||
| 6.3.3.1. Unit non-response - rate | ||||||||||||||||||||||||||||||||||||||||||||||||||||||||||||||||||||||||||||||||||||||||||||||||||||||||||||||||||||||||
Response rate for enterprises by industry
|
||||||||||||||||||||||||||||||||||||||||||||||||||||||||||||||||||||||||||||||||||||||||||||||||||||||||||||||||||||||||
| 6.3.3.2. Item non-response - rate | ||||||||||||||||||||||||||||||||||||||||||||||||||||||||||||||||||||||||||||||||||||||||||||||||||||||||||||||||||||||||
Not applicable. |
||||||||||||||||||||||||||||||||||||||||||||||||||||||||||||||||||||||||||||||||||||||||||||||||||||||||||||||||||||||||
| 6.3.4. Processing error | ||||||||||||||||||||||||||||||||||||||||||||||||||||||||||||||||||||||||||||||||||||||||||||||||||||||||||||||||||||||||
Processing errors are errors that can arise during the course of computer processing of the reported data from the respondent and up to the point the statistics are completed. This applies to factors such as data transmission, registration, encoding, and error correction. Reported forms are registered either optically or manually, while electronically reported data are either downloaded to the database through the internet portal for public reporting (Altinn), or entered directly into the tables where data information is compiled. |
||||||||||||||||||||||||||||||||||||||||||||||||||||||||||||||||||||||||||||||||||||||||||||||||||||||||||||||||||||||||
| 6.3.4.1. Imputation - rate | ||||||||||||||||||||||||||||||||||||||||||||||||||||||||||||||||||||||||||||||||||||||||||||||||||||||||||||||||||||||||
Not applicable. |
||||||||||||||||||||||||||||||||||||||||||||||||||||||||||||||||||||||||||||||||||||||||||||||||||||||||||||||||||||||||
| 6.3.5. Model assumption error | ||||||||||||||||||||||||||||||||||||||||||||||||||||||||||||||||||||||||||||||||||||||||||||||||||||||||||||||||||||||||
The wage statistics for all employees are based on a re-weighting of several wage statistics and the underlying assumptions for this weighting are a source of model error. To be considered is how appropriate the employment figures from the Norwegian Central Register of Enterprises and Establishments are for this purpose and the quality and demands that these figures rely on. One model assumption is that the sample from the respective wage statistics reflects the distribution of full-time and part-time employees in the population. Statistics Norway has chosen to use September and October as the reference months for the annual wage statistics. These months are believed to be less affected by holidays and the most stable regarding wages and therefore also considered representative. The accounting and fiscal year is identical to the calendar year in Norway. Hence, this is not subject to any errors regarding the wage statistics. The sample model used for all sections is based on stratified samples. Dividing the population into groups (strata) according to certain stratification variables reduces the possibility of imbalances in the sample and assures a better coverage of certain units or groups of units in the wage statistics. The stratification is made according to industry and the size (number of employees) of the enterprises, on the assumption that wages and composition of occupations in large enterprises differ from those in small ones, and that there are differences according to industry. In each stratum, this sample model ensures a minimal dispersion in the main variables measured, i.e. wage. The number of employees is an important feature with regard to the stratification. Some assessment of this size is made through to the sampling process and serves as guidance for ongoing improvement. In each stratum, the mean number of employees is calculated along with the standard deviation. This is done to ensure an optimum stratification that reflects the differences between the strata. The different products in the wage statistics are separated according to section. Each section in the wage statistics represents one part of the total population, and these are therefore also to be considered as a part of the stratification. This stratification ensures that each section is fully covered, and that no major enterprises are left out. Also the coverage of other related sections is ensured through this model. |
||||||||||||||||||||||||||||||||||||||||||||||||||||||||||||||||||||||||||||||||||||||||||||||||||||||||||||||||||||||||
| 6.4. Seasonal adjustment | ||||||||||||||||||||||||||||||||||||||||||||||||||||||||||||||||||||||||||||||||||||||||||||||||||||||||||||||||||||||||
Not applicable. |
||||||||||||||||||||||||||||||||||||||||||||||||||||||||||||||||||||||||||||||||||||||||||||||||||||||||||||||||||||||||
| 6.5. Data revision - policy | ||||||||||||||||||||||||||||||||||||||||||||||||||||||||||||||||||||||||||||||||||||||||||||||||||||||||||||||||||||||||
Not applicable. |
||||||||||||||||||||||||||||||||||||||||||||||||||||||||||||||||||||||||||||||||||||||||||||||||||||||||||||||||||||||||
| 6.6. Data revision - practice | ||||||||||||||||||||||||||||||||||||||||||||||||||||||||||||||||||||||||||||||||||||||||||||||||||||||||||||||||||||||||
Not applicable. |
||||||||||||||||||||||||||||||||||||||||||||||||||||||||||||||||||||||||||||||||||||||||||||||||||||||||||||||||||||||||
| 6.6.1. Data revision - average size | ||||||||||||||||||||||||||||||||||||||||||||||||||||||||||||||||||||||||||||||||||||||||||||||||||||||||||||||||||||||||
Not applicable. |
||||||||||||||||||||||||||||||||||||||||||||||||||||||||||||||||||||||||||||||||||||||||||||||||||||||||||||||||||||||||
|
||||||||||||||||||||||||||||||||||||||||||||||||||||||||||||||||||||||||||||||||||||
| 7.1. Timeliness | ||||||||||||||||||||||||||||||||||||||||||||||||||||||||||||||||||||||||||||||||||||
The wage statistics for all employees 2014 were published on 20 March 2015. These statistics are produced by using the wage statistics for several industrial sections with the following publishing dates:
|
||||||||||||||||||||||||||||||||||||||||||||||||||||||||||||||||||||||||||||||||||||
| 7.1.1. Time lag - first result | ||||||||||||||||||||||||||||||||||||||||||||||||||||||||||||||||||||||||||||||||||||
Not applicable. |
||||||||||||||||||||||||||||||||||||||||||||||||||||||||||||||||||||||||||||||||||||
| 7.1.2. Time lag - final result | ||||||||||||||||||||||||||||||||||||||||||||||||||||||||||||||||||||||||||||||||||||
|
||||||||||||||||||||||||||||||||||||||||||||||||||||||||||||||||||||||||||||||||||||
| 7.2. Punctuality | ||||||||||||||||||||||||||||||||||||||||||||||||||||||||||||||||||||||||||||||||||||
The reference period for the surveys is September 1 for sections G, K, L, M and N and October 1 for the remainder. The statistics are collected by way of the mandate given through "The Statistics Act of 1989",which, for the statistics presented here, makes response mandatory.
Key dates in the data collection process: September 1:
October 1:
In addition to the forms, large enterprises are phoned during this period to ensure that the questionnaires are returned. The post-collection phase begins as soon as questionnaires are received. Working deadlines are set as the process takes place, and in accordance with priorities given by the pre-planned list for publication. There are no given and explicit deadlines for the different elements in the post-collection phase, except for the final deadline; the statistics for the different sections are finished and approved one week prior to the publishing dates. |
||||||||||||||||||||||||||||||||||||||||||||||||||||||||||||||||||||||||||||||||||||
| 7.2.1. Punctuality - delivery and publication | ||||||||||||||||||||||||||||||||||||||||||||||||||||||||||||||||||||||||||||||||||||
The wage statistics for all employees and the wage statistics for several industrial sections were all released according to the target date on which they were scheudeled for release. |
||||||||||||||||||||||||||||||||||||||||||||||||||||||||||||||||||||||||||||||||||||
|
||||||||||||||||||||||||||||||||||||
| 8.1. Comparability - geographical | ||||||||||||||||||||||||||||||||||||
The Norwegian earnings statistics are collected annually and comply with most mandatory points drawn up in the council regulation 530/1999, and subsidiary commission regulations. Specific exceptions are stated in the EEA agreement Annex XXI - p.25. Some special features for Norway do however apply:
The statistical units are identical to the units used in other countries; the reference population is basically all active enterprises in the section, with the exception of small enterprises with less than 3, 4 or 5 employees (depending on section), which are not included in the reference population. Statistics Norway also uses international standards with regard to classifications of different variables. Some national adaptations are made, but these are not present in the transferred SES files. |
||||||||||||||||||||||||||||||||||||
| 8.1.1. Asymmetry for mirror flow statistics - coefficient | ||||||||||||||||||||||||||||||||||||
Not applicable. |
||||||||||||||||||||||||||||||||||||
| 8.2. Comparability - over time | ||||||||||||||||||||||||||||||||||||
Comparable annual statistics on earnings were established for most industrial sections in 1997, a few sections were included later. The statistics are comparable from 1997 and are uniform and comparable among the sections. There has not been any change in the definitions of variables since 1997. The applied methods and models have however been subject to ongoing improvement based on increased knowledge and new requirements since they were established. These ongoing improvements have not affected comparability. |
||||||||||||||||||||||||||||||||||||
| 8.2.1. Length of comparable time series | ||||||||||||||||||||||||||||||||||||
New annual wage statistics for most industrial sections were established in 1997. The wage statistics are to be uniform and comparable among the sections. Wage statistics in 2009 apply a new Standard industrial classification (SN2007). Wage statistics from 2008/2009 are thus according to the new standard. Due to this, wage statistics from 2007 and earlier years are not directly comparable to the statistics from 2008/2009 and the years later. |
||||||||||||||||||||||||||||||||||||
| 8.3. Coherence - cross domain | ||||||||||||||||||||||||||||||||||||
Coherence with the Labour Force Survey (LFS) 3rd quarter 2014 The following is a short presentation and comparison of the Norwegian SES and the Norwegian LFS surveys. It is important to point out basic differences that possibly could be the cause of differences between the surveys as they are observed in the following tables. Statistics from the LFS are based on published figures.
Comparison of basic information on model assumption, sampling, units and purpose In the following , several basic aspects of the LFS and SES are compared. One of the main reasons for different surveys is to meet different needs. Consequently, the statistics are based on assumptions that meet these specific user needs. The LFS survey monitors and documents quarterly changes in the composition and distribution of the work force. It is based on a sample survey covering individuals (the sample unit is family) that report on their status in the work force. The earnings statistics on the other hand are structured to answer questions concerning the level and distribution of earnings. As described earlier, the source is a sample of enterprises that reports on employees. There is significant overlap between the populations of the two surveys, but the source of information is different and so are the sampling models. Furthermore, the two surveys have different reference periods and utilize different sources for control, verification and finally dissemination. Both statistics are nonetheless used for explaining different properties of the same field of interest and in this capacity we can use the LFS to understand the distribution and composition of jobs and employees as they are described in the earnings survey. Discrepancies should, where they occur, be explained and understood as a consequence of overlapping information.
Tabular results and comparisons with the LFS See the attached document Coherence with LFS For the tables that refer to distributions of full-time and part-time employees respectively by age, discrepancies are small. Most of the differences between the two sources might very well be a result, at least to some extent, explained by the differences described. Differences in the definitions of full-time employees in particular may contribute to some of the observed discrepancies even though these should be viewed as small to minimal in this case. The same factors mentioned above will also explain discrepancies between the tables that show the distribution of full-time employees by industry. In general it seems that the distribution of employees by sex and industry and sex and age are very similar. This also gives more credit to the assumptions concerning the sampling model and hence model assumptions and bias.
Coherence with National Accounts In the two tables in the attached document Coherence with National Accounts, comparisons between National Accounts and the SES are shown. The first table gives the distribution of wages by industry as the estimated sum of annual wages from the SES and compensation of employees in the National Accounts. The other table compares the distribution of employees by industry. Discrepancies can mostly be explained through differences in definitions, reference periods between the two sources and revision of the NA data. All statistics from the National Accounts are based on published figures for 3rd quarter 2014. Annexes: Coherence with LFS Coherence with National Accounts |
||||||||||||||||||||||||||||||||||||
| 8.4. Coherence - sub annual and annual statistics | ||||||||||||||||||||||||||||||||||||
The quarterly wage index is closely tied with annual statistics on wages. The wage concepts on which the two index series are based (basic salaries and average monthly earnings) are identical with wage concepts used in annual statistics on wages. Changes in basic salaries are directly comparable between the two statistics. Changes in monthly earnings are, however, not directly comparable. The reason for this is that irregular payments and bonuses are estimated as an average over the year in the annual statistics while in the quarterly wage index the average of the aggregates is estimated for only the current quarter. Thus the timing of disbursement influences the index and might therefore be subject to greater fluctuations between the quarters. Preliminary indexes are final when the annual statistics for each industry is released. |
||||||||||||||||||||||||||||||||||||
| 8.5. Coherence - National Accounts | ||||||||||||||||||||||||||||||||||||
see item 8.3 - "Coherence - cross domain". |
||||||||||||||||||||||||||||||||||||
| 8.6. Coherence - internal | ||||||||||||||||||||||||||||||||||||
see item 8.3 - "Coherence - cross domain". |
||||||||||||||||||||||||||||||||||||
|
|||
The purpose of the sample model selection process is basically to get samples that ensure a representative basis for the wage statistics and avoid burdening all enterprises in the industry with forms to fill in. This limits the size of the samples while focusing on main variables. Another objective is to ensure that the burden of reporting obligations is minimized as much as possible for the smallest enterprises. Statistics Norway likes to believe that these purposes are well fulfilled. |
|||
|
|||
| 11.1. Confidentiality - policy | |||
The Statistics Act of 1989 (Act No. 54 of June 16 1989) - https://www.ssb.no/en/omssb/styringsdokumenter/lover-og-prinsipper/the-statistics-act-of-1989, Chapter 2, § 2-4 - § 2-7, prevent unauthorised disclosure of data that identify a person or economic entity either directly or indirectly. |
|||
| 11.2. Confidentiality - data treatment | |||
Information of respondents are taken care of or destroyed in a proper manner. According to Statistics Act Section 2-6, figures shall not be published in such a way that they may be traced to a particular respondent. The anonymisation method consists of several confidentiality rules. Examples of such rules are: - minimum frequency rule - dominance rule |
|||
|
|||
References
Annexes: Structure of Earnings Survey - grossed results - tabular analyses Appendix B Variables covered in the document |
|||
|
|||
|
|||