|
 |
|
| For any question on data and metadata, please contact: Eurostat user support |
|
|||
| 1.1. Contact organisation | Statec Luxembourg |
||
| 1.2. Contact organisation unit | Labour Market and Education (SOC2) |
||
| 1.5. Contact mail address | 13 Rue Erasme, 1468 Luxembourg |
||
|
|||
| 2.1. Data description | |||
[Not requested] |
|||
| 2.2. Classification system | |||
Not available. |
|||
| 2.3. Coverage - sector | |||
Not available. |
|||
| 2.4. Statistical concepts and definitions | |||
Not available. |
|||
| 2.5. Statistical unit | |||
Not available. |
|||
| 2.6. Statistical population | |||
Not available. |
|||
| 2.7. Reference area | |||
Not available. |
|||
| 2.8. Coverage - Time | |||
Not available. |
|||
| 2.9. Base period | |||
Not available. |
|||
|
|||
| 3.1. Source data | |||
[Not requested] |
|||
| 3.2. Frequency of data collection | |||
[Not requested] |
|||
| 3.3. Data collection | |||
[Not requested] |
|||
| 3.4. Data validation | |||
[Not requested] |
|||
| 3.5. Data compilation | |||
[Not requested] |
|||
| 3.6. Adjustment | |||
[Not requested] |
|||
|
|||
| 4.1. Quality assurance | |||
Not available. |
|||
| 4.2. Quality management - assessment | |||
[Not requested] |
|||
|
|||
| 5.1. Relevance - User Needs | |||
The structure of earnings survey (SES) provides a rather complete picture of wages, hours worked and the personal characteristics of workers. As such, it is a unique source in Luxembourg. Alternative sources are less complete or less reliable. The social security records provide information on wages and hours worked. These records also provide some information on the workers’ characteristics, but two crucial items are missing: the level of education and the occupation. There is also information on wages in the Labour Force Surveys (LFS) and in EU-SILC. These surveys provide a wealth of information on the workers’ personal backgrounds. Unfortunately, the information on wages is less reliable. Indeed, the wages are self-declared by the workers, and are missing in several cases. Furthermore, there is no precise and reliable information on the amount of hours worked. Another drawback of the two latter sources is that they exclude the workers that work in Luxembourg, but live outside the country. These cross-border workers make up 44% of Luxembourg’s total wage employment. The SES covers 87% of Luxembourg’s total wage employment, much more than the LFS. For the 2014 SES, there has been a major change in the survey methodology. Most variables have been drawn from social security records. Only those variables that are missing in these records (or are of questionable quality) have been asked directly to the enterprises using a reduced survey questionnaire. Summary of national core users The most important national core user is STATEC. The other national core users include ministries, administrations, foreign embassies, researchers, media, employers’ federations, trade unions, companies from the private sector, as well as students from high-schools and universities. Description of their main needs including an assessment of their level of satisfaction with the data offered The users are mainly interested in breakdowns of wages along several variables. The most popular variables are sector, occupation, and educational level. Whereas most of the users are fine with tabular analyses, the researchers are also interested in a direct access to the microdata. |
|||
| 5.2. Relevance - User Satisfaction | |||
There is no systematic and formal assessment of the users’ satisfaction. Nevertheless, the small size of the national user community enables STATEC to have a direct contact with the users. As a result, STATEC can be very responsive to the users’ needs. The informal feedback suggests that the users’ needs are generally satisfied. |
|||
| 5.3. Completeness | |||
[Not requested] |
|||
| 5.3.1. Data completeness - rate | |||
[Not requested] |
|||
|
|||
| 6.1. Accuracy - overall | |||
[Not requested] |
|||
| 6.2. Sampling error | |||
This sections documents the sampling errors of the Structure of Earnings Survey 2014. |
|||
| 6.2.1. Sampling error - indicators | |||
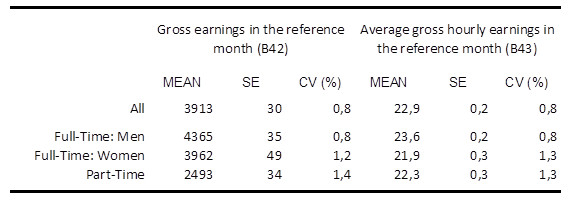
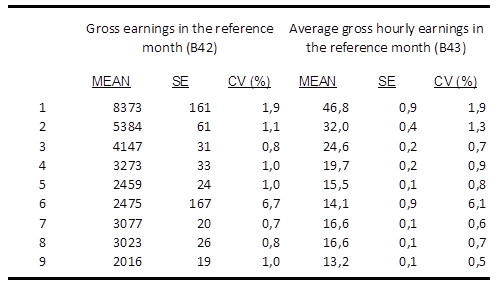
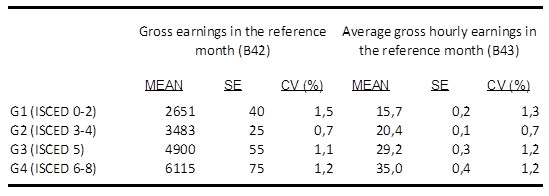
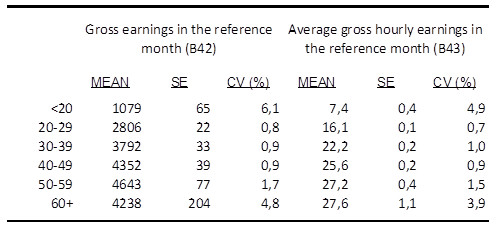
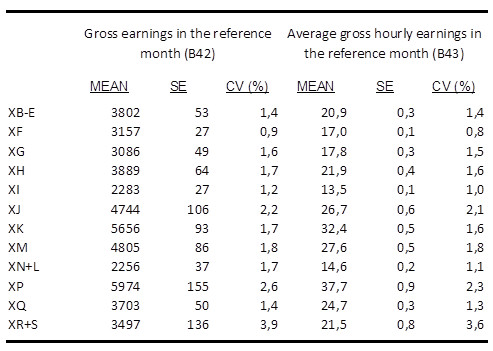
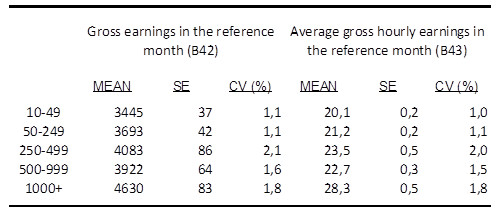
The following tables show the coefficient of variation for the average monthly earnings and average hourly earnings, broken down by the characteristics of the workers and the enterprises they are working in.
Average earnings for all employees and broken down by sex and by full-time/part-time workers:
Average earnings broken down by major ISCO-08 groups:
Average earnings broken down by ISCED2011 categories:
Average earnings broken down by the age of the workers:
Average earnings broken down by NACE rev2 sections (respecting confidentiality of some sections):
Average earnings broken down by the size of the enterprises (number of employees):
|
|||
| 6.3. Non-sampling error | |||
This sections documents the non-sampling errors of the Structure of Earnings Survey 2014. |
|||
| 6.3.1. Coverage error | |||
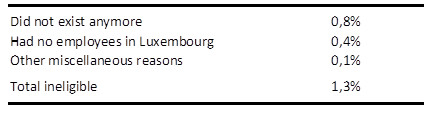
No problem of under-coverage is known. However, there has been some over-coverage, i.e. the sample included units that were out of scope. The reasons for this over-coverage stem from a discrepancy between the administrative files used for the sampling and the real world, and can be split into 3 categories:
|
|||
| 6.3.1.1. Over-coverage - rate | |||
The table below gives an estimate of the over-coverage rate with respect to the initial sample. Furthermore, the table distinguishes the above-mentioned causes for over-coverage.
|
|||
| 6.3.1.2. Common units - proportion | |||
[Not requested] |
|||
| 6.3.2. Measurement error | |||
Due to the new methodology introduced for the 2014 wave, there have been few inconsistencies between variables, as most variables had been drawn from social security registers. The main issues concerned: - Variable B271 (Share of a full-timer’s normal hours), where the values filled in by the enterprises in the questionnaire were inconsistent with the number of hours paid in the reference month drawn from social security. - Variable B422 (Special payments for shift work), where the values filled in by the enterprises in the questionnaire were inconsistent with the overall special payments in the reference month drawn from social security The inconsistencies on these variables were corrected via direct follow-up with the local units. The variable on Annual Holiday Leave (B33) had to be imputed based on legal minima and minima set by (known) collective agreements. As a result, the values of the variable B33 are likely to be underestimated. |
|||
| 6.3.3. Non response error | |||
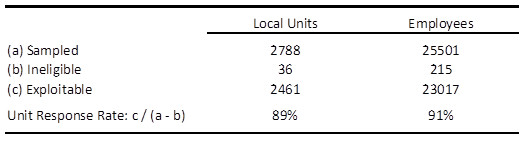
The table below shows the unit response rate. This rate is defined as follows:
The “Ineligible Units” are those mentioned in the section about Coverage errors. The “Exploitable Units” are those for which there was a response and who have passed the quality and plausibility checks.
|
|||
| 6.3.3.1. Unit non-response - rate | |||
[Not requested] |
|||
| 6.3.3.2. Item non-response - rate | |||
[Not requested] |
|||
| 6.3.4. Processing error | |||
None |
|||
| 6.3.4.1. Imputation - rate | |||
There has been no imputation of missing values. Most of the variables were drawn from social security where very little to no data were missing. For those variables collected by online questionnaire, all answers were made compulsory. In addition, an extensive follow-up allowed reducing the problems of item non-response and missing values to a minimum. Some employees (0.1%), for which all or some important variables were missing were dropped from the results entirely. |
|||
| 6.3.5. Model assumption error | |||
Does not apply. |
|||
| 6.4. Seasonal adjustment | |||
[Not requested] |
|||
| 6.5. Data revision - policy | |||
[Not requested] |
|||
| 6.6. Data revision - practice | |||
[Not requested] |
|||
| 6.6.1. Data revision - average size | |||
[Not requested] |
|||
|
|||
| 7.1. Timeliness | |||
The reference month for the Structure of Earnings Survey is October 2014. The final data have been available since the 28th of June 2016. The results are published in the last quarter of 2016. |
|||
| 7.1.1. Time lag - first result | |||
[Not requested] |
|||
| 7.1.2. Time lag - final result | |||
[Not requested] |
|||
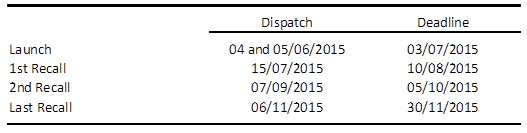
| 7.2. Punctuality | |||
The table below shows the dates at which the questionnaire and the recalls were dispatched, as well as the deadlines that have been imposed.
The fieldwork started on the 4th of June 2015. The fieldwork stopped on the 5th of Mars 2016, the day where the last questionnaire was received and validated. The data processing started on the 6th of June 2015, the day where the first questionnaires were received. The data processing ended on the 28th of June 2016, by transmitting the data to Eurostat. The results are published by STATEC in the last quarter of 2016. |
|||
| 7.2.1. Punctuality - delivery and publication | |||
[Not requested] |
|||
|
|||
| 8.1. Comparability - geographical | |||
In Luxembourg, the European concepts on the definition of statistical units, populations, reference times, classifications and definitions of variables have been used. |
|||
| 8.1.1. Asymmetry for mirror flow statistics - coefficient | |||
[Not requested] |
|||
| 8.2. Comparability - over time | |||
Coverage The Structure of Earnings Surveys of 1995, 2002, and 2006 cover the sections C to K of the NACE rev.1 classification. In 2006, the sections M, N and O have been added. In 2010, the NACE rev2 classification is used. The sections B to N and P to S have been covered. In 2014, as in 2010, there has been an experimental coverage of NACE section O (public administration) with the collection of data from the central governmental administration. The change in method described in part 1 (Relevance) might have caused a break in series for some variables, so users should be cautious when comparing data between previous waves and the 2014 collection. For section P (Education), there is clearly a break in series as section P covered only private educational institutions up to the 2010 collection, but covers also public educational institutions in 2014.
Survey Design The Structure of Earnings Surveys of 1995 onwards rely on a two-stage sample design. In a first stage a sample of local units is drawn, and in a second stage, the salaried workers are sampled within these local units. In 1995 and 2002, the local units were asked in the second stage to draw themselves a representative sample of their workers, the size of this sample being fixed by STATEC. In 2006, 2010 and 2014, the second-stage sample was directly drawn from social security records, using simple random sampling. |
|||
| 8.2.1. Length of comparable time series | |||
[Not requested] |
|||
| 8.3. Coherence - cross domain | |||
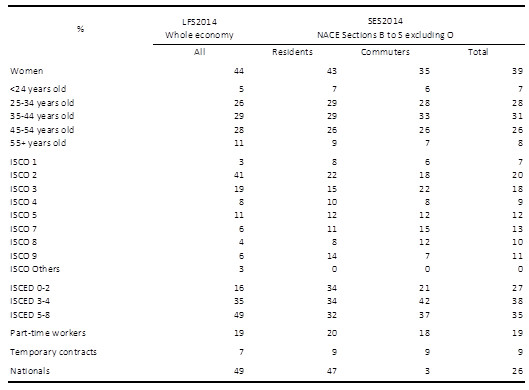
The following table compares the composition of the working population as found in the Structure of Earnings Survey (SES) 2014 to those of the Labour Force Survey (LFS) of the same year. There is however a big difference between these two surveys regarding their coverage. The LFS only covers workers living in Luxembourg. The SES covers persons working in Luxembourg, regardless if they are living in Luxembourg or not. Persons not living but working in Luxembourg make up 44% of the total wage employment. Moreover, the profiles of these workers are different from those of the resident workers. Hence, the following table presents the results for the SES for the workers living in Luxembourg (“Residents”) and for the persons working in Luxembourg and living abroad (“Commuters”) in separate columns. Only the column “Residents” should be compared to the results of the LFS. However, there are further divergences regarding the coverage of the SES and the LFS. The SES is restricted to enterprises with 10 employees or more, active in the NACE rev.2 sections B to S excluding O, i.e. the total economy with exception of Agriculture, Forestry and Fishing (section A), public administration (O) as well as the activities of households as employers (section T). Moreover, the LFS includes persons working for extraterritorial organizations (NACE section U). This group makes up roughly 5% of Luxembourg’s domestic employment. The LFS contains a variable on the activity of the employers and the size of the companies where the persons are working. However, this information is plagued by measurement error and non-response. Indeed, the information is self-declared by the workers. Hence, it was decided not to use this information for filtering purposes. More generally, non-response and measurement errors are an issue in the LFS, much more than they are in the SES. Characteristics of the Workers according to the Labour Force Survey 2014 and the Structure of Earnings Survey 2014 (in % with respect to all the workers)
Regarding gender, age, citizenship, the shares of part-time and of temporary workers, the results in the SES (for residents) and the LFS are fairly consistent. There is a divergence regarding the occupations. According to the LFS, 60% of the workers are in the ISCO-08 categories 2 (“Professionals”) and 3 (“Technicians and associate professionals”). However, these two groups only make up 40% in the SES. There is also a divergence regarding the highest attained level of education. Persons with at most ISCED0 to ISCED2 are, with a share of 34%, overrepresented in the SES, as compared to the LFS. On the other hand, the ISCED5 and ISCED8 categories are underrepresented by the same amount, i.e. 32% in the SES as compared to 49% in the LFS. Besides the non-response and measurement issues already mentioned, an additional problem can arise with the level of education. In the LFS the level of education is reported by the workers whereas it is reported by the employers in the SES. This might give rise to a so-called social desirability bias, a tendency that the workers declare higher levels of education than they really have. Furthermore, it is not sure whether the employers dispose of the most accurate information regarding their employees’ education. In some cases, they may have only encoded the level of education required for the job rather than the diploma a person disposes of. In other cases, employees may have followed since their hire some extra courses which can lead to a higher level of education. |
|||
| 8.4. Coherence - sub annual and annual statistics | |||
[Not requested] |
|||
| 8.5. Coherence - National Accounts | |||
The following table compares the variable “gross annual earnings in the reference year” from the Structure of Earning Survey (SES), to the variable “wages and salaries (D11) per employee” from the national accounts (NA). The figures presented are the overall means (including full-time and part-time employees). Some NACE sections are regrouped for confidentiality reasons.
On average, the SES and NA figures are nearly identical (SES is only 0.9% lower than NA), but on the NACE section level, some differences remain. The biggest differences are found in section I (accommodation and food service activities), where the SES average is 10.3% below the NA average, and in section N+L (administrative and support service activities + real estate activities), where the SES average is 11.8% lower than the NA average. In all other sections, the differences range between -5 and +4%. |
|||
| 8.6. Coherence - internal | |||
[Not requested] |
|||

|
|||
| 9.1. Dissemination format - News release | |||
At the same time as the "Bulletin du Statec" a news release (“Statnews”) will be dispatched. http://www.statistiques.public.lu/fr/actualites/index.php |
|||
| 9.2. Dissemination format - Publications | |||
References for core results publications, including those with commentary in the form of text, graphs, maps, etc.
http://www.statistiques.public.lu/en/publications/index.php
|
|||
| 9.3. Dissemination format - online database | |||
Several tables will be published on the “Portail des Statistiques”, under the following section: http://www.statistiques.public.lu/stat/ReportFolders/ReportFolder.aspx?IF_Language=fra&MainTheme=3&FldrName=1&RFPath=30 |
|||
| 9.3.1. Data tables - consultations | |||
[Not requested] |
|||
| 9.4. Dissemination format - microdata access | |||
[Not requested] |
|||
| 9.5. Dissemination format - other | |||
- |
|||
| 9.6. Documentation on methodology | |||
Description of and references for metadata provided Metadata will be published on the “Portail des statistiques”, together with the tables extracted from the survey.
References for core methodological documents relating to the statistics provided The “Bulletin du STATEC” published on this survey contains a methodological section. |
|||
| 9.7. Quality management - documentation | |||
[Not requested] |
|||
| 9.7.1. Metadata completeness - rate | |||
[Not requested] |
|||
| 9.7.2. Metadata - consultations | |||
[Not requested] |
|||
|
|||
[Not requested] |
|||
|
|||
| 11.1. Confidentiality - policy | |||
[Not requested] |
|||
| 11.2. Confidentiality - data treatment | |||
[Not requested] |
|||
|
|||
None |
|||
|
|||
|
|||