|
 |
|
| For any question on data and metadata, please contact: Eurostat user support |
|
|||
| 1.1. Contact organisation | Statistics Lithuania |
||
| 1.2. Contact organisation unit | Labour Statistics Division |
||
| 1.5. Contact mail address | 29 Gedimino Ave. LT–01500 Vilnius, Lithuania |
||
|
|||
| 2.1. Data description | |||
The statistical Structure of Earnings Survey (SES) provides detailed and comparable information on relationships between the level of gross earnings, personal characteristics of employees (sex, age, occupation, length of service, highest educational level attained, etc.) and their employer (economic activity, size of the enterprise). The results are relevant for making economic, job and social security-related decisions. The SES has been carried out since 2002 every four years at the individual level (by employees) and is based on the relevant regulating legal acts of the European Union. The data were collected from local units as well as from enterprises, institutions and organizations if they do not have local units with one and more employees using the questionnaire DUS-01. Administrative data, namely data on “the number of employees in the enterprise” were used from the State Social Insurance Fund Board (SODRA). The survey period is the year 2014, October was chosen as a representative month of the reference year. Lithuania has no regions; therefore the SES data are provided only at the NUTS 1 level. |
|||
| 2.2. Classification system | |||
National version (EVRK Rev. 2) of the Statistical Classification of Economic Activities in the European Community (NACE Rev. 2). Lithuanian Classification of Occupations (LPK 2008), developed on the basis of the International Standard Classification of Occupations ISCO-08; Lithuanian Educational Level Classification (IK 2), developed on the basis of the International Standard Classification of Education (ISCED 2011). |
|||
| 2.3. Coverage - sector | |||
The SES covers: all economic activities defined in NACE Rev. 2 sections B to S. NACE Section O (Public administration and defence; compulsory social security) is optional; however, it is also covered. six size classes of local units (enterprises): under 10 employees, 10 to 49 employees, 50 to 249 employees, 250 to 499 employees, 500 to 999 employees, 1000 and more employees. |
|||
| 2.4. Statistical concepts and definitions | |||
Gross earnings refers to remuneration in cash covering the basic wage and bonuses, payable by the employer to the employee directly, including social insurance contributions and income tax payable by the employee. Gross remunerationdoes not include material allowances, allowances for sick leave paid irrespective of sources of finance, cash compensations for unused annual vacation, severance pay, etc. Average gross hourly earnings are gross earnings per hour paid for (before taxes). Average number of employees in full-time units is the sum of two indicators: number of full-time employees and that of part-time employees converted into full-time units. Hours paid for are hours actually worked (normal and overtime), including hours not worked but paid for (such as annual leave, paid idle-time, etc.) in accordance with the procedure laid down by law or in a collective agreement. |
|||
| 2.5. Statistical unit | |||
Statistical unit compiles a local unit of an enterprise of any type and form of ownership or an enterprise if it has no local units and an employee. |
|||
| 2.6. Statistical population | |||
The statistical population consists of enterprises, institutions and organisations of all types and forms of ownership engaged in economic activities from B to S (according to NACE Rev. 2) and having one and more employees. |
|||
| 2.7. Reference area | |||
The data cover whole country. |
|||
| 2.8. Coverage - Time | |||
2014 |
|||
| 2.9. Base period | |||
Not applicable. |
|||
|
|||
| 3.1. Source data | |||
The source of statistical information is the Structure of Earnings Survey questionnaire DUS-01 and the administrative data – the data of the State Social Insurance Fund Board under the Ministry of Social Security and Labour (Sodra). |
|||
| 3.2. Frequency of data collection | |||
Four-yearly. |
|||
| 3.3. Data collection | |||
The survey is conducted applying a sampling method. The list of local units / enterprises from which a sample is selected is based on the list of economic entities in operation from the Statistical Register of Economic Entities. The overall sample fraction of local units / enterprises in the observed activities (sections B–S) was 5.2 per cent (4 744 of the total 90 781 in the population). Sampled local units / enterprises covered 3.6 per cent (44 361 employees of the total 1 228 946 in the population) of the total number of employees. Sample design A two-stage cluster sample is used. The first stage sampling units are local units / enterprises. The surveyed population of local units / enterprises was stratified by economic activity (B–S NACE Rev. 2,) at a 2-digit level and by the number of employees. The enterprise size bands were grouped as follows: 1–9, 10–49, 50–99, 100–249, 250–499, 500–999 and 1000 and more employees. The second stage sampling units are employees of the selected local units / enterprises. A simple random sample of employees is selected by the local units / enterprises. See also the attached document Sample design, including the number of employees to be selected depended on the size band of the local unit and the sample size of local units / enterprises and employees.
Annexes: Sample design |
|||
| 3.4. Data validation | |||
Validation procedures: population coverage is checked; the results are compared with those of previous periods, other surveys and administrative data sources. |
|||
| 3.5. Data compilation | |||
[Not requested] |
|||
| 3.6. Adjustment | |||
[Not requested] |
|||
|
|||
| 4.1. Quality assurance | |||
The quality of statistical information and its production process is ensured by the provisions of the European Statistics Code of Practice. In 2007, a quality management system, conforming with the requirements of the international quality management system standard ISO 9001, was introduced at Statistics Lithuania. |
|||
| 4.2. Quality management - assessment | |||
The quality of the information obtained is analysed. Additional statistical quality checks are performed at the macrodata level. Statistical indicators are compared with the previous period and other relevant indicators obtained from statistical surveys or administrative sources. |
|||
|
|||
| 5.1. Relevance - User Needs | |||
Indicators of the structure of earnings are relevant for the assessment of the level of economic development of the country, preparation of the forecasts for the economic growth, evaluation of the State and Government authorities (the Ministry of Social Security and Labour, equal possibilities for men and women). Indicators by occupational group and level of education are used to make decisions related to the labour market as well as social security. The main users are: State and Government authorities – the Ministry of Economy, other ministries, the Presidency, the Seimas (Parliament), the Bank of Lithuania, etc.; in addition to Eurostat (the main user of SES data), other users include the media, representatives of business and science, students, European institutions such as the ILO, etc. The users are mainly interested in breakdowns of earnings by several variables. The most popular variables are occupation, educational level, economic activity and county. |
|||
| 5.2. Relevance - User Satisfaction | |||
As it has been mentioned above, the main users are State and Government authorities, the media, representatives of business and science, students. It could be mentioned that users who have received information on request asked for a more detailed breakdown of earnings (in particular by counties, occupation at a detailed level). Most users, however, seek for information in the database and it is not clear whether SES data meet the demands of users. It is generally perceived that the statistics meet most user needs. |
|||
| 5.3. Completeness | |||
All statistical indicators and their components established by legislation are published. |
|||
| 5.3.1. Data completeness - rate | |||
[Not requested] |
|||
|
|||||||||||||||||||||||||||||||||||||||||||||||||||||||||||||||||||||||||||||||||||||||||||||||||||||||||||||||||||||||||||||||||||||||||||||||||||||||||||||||||||||||
| 6.1. Accuracy - overall | |||||||||||||||||||||||||||||||||||||||||||||||||||||||||||||||||||||||||||||||||||||||||||||||||||||||||||||||||||||||||||||||||||||||||||||||||||||||||||||||||||||||
[Not requested] |
|||||||||||||||||||||||||||||||||||||||||||||||||||||||||||||||||||||||||||||||||||||||||||||||||||||||||||||||||||||||||||||||||||||||||||||||||||||||||||||||||||||||
| 6.2. Sampling error | |||||||||||||||||||||||||||||||||||||||||||||||||||||||||||||||||||||||||||||||||||||||||||||||||||||||||||||||||||||||||||||||||||||||||||||||||||||||||||||||||||||||
See below. |
|||||||||||||||||||||||||||||||||||||||||||||||||||||||||||||||||||||||||||||||||||||||||||||||||||||||||||||||||||||||||||||||||||||||||||||||||||||||||||||||||||||||
| 6.2.1. Sampling error - indicators | |||||||||||||||||||||||||||||||||||||||||||||||||||||||||||||||||||||||||||||||||||||||||||||||||||||||||||||||||||||||||||||||||||||||||||||||||||||||||||||||||||||||
Sampling errors The coefficient of variation is calculated for every estimate as an indication of accuracy. Coefficients of variation (CV) concerning gross earnings in the reference month are broken down by:
The coefficients of variation of the estimate of total gross earnings was 0.8 per cent, average hourly gross earnings in October 2014 – 0.7 per cent. See also the attached document Coefficients of variation with detailed tables for the above mentioned breakdowns. Statistics Lithuania publishes estimates with a coefficient of variation up to 30. The estimates with the coefficient of variation between 10 and 30 per cent are published in brackets, whereas those over 30 per cent are not presented.
Annexes: Sampling errors |
|||||||||||||||||||||||||||||||||||||||||||||||||||||||||||||||||||||||||||||||||||||||||||||||||||||||||||||||||||||||||||||||||||||||||||||||||||||||||||||||||||||||
| 6.3. Non-sampling error | |||||||||||||||||||||||||||||||||||||||||||||||||||||||||||||||||||||||||||||||||||||||||||||||||||||||||||||||||||||||||||||||||||||||||||||||||||||||||||||||||||||||
See below. |
|||||||||||||||||||||||||||||||||||||||||||||||||||||||||||||||||||||||||||||||||||||||||||||||||||||||||||||||||||||||||||||||||||||||||||||||||||||||||||||||||||||||
| 6.3.1. Coverage error | |||||||||||||||||||||||||||||||||||||||||||||||||||||||||||||||||||||||||||||||||||||||||||||||||||||||||||||||||||||||||||||||||||||||||||||||||||||||||||||||||||||||
Under / over coverage errors (due to newly-born or non-active enterprises) were assumed to be negligible since the sampling frame was constructed at the end of the reference period and all possible administrative sources were used in order to specify the sampling frame. Some misclassification regarding the NACE group and size of an enterprise were identified and corrected. |
|||||||||||||||||||||||||||||||||||||||||||||||||||||||||||||||||||||||||||||||||||||||||||||||||||||||||||||||||||||||||||||||||||||||||||||||||||||||||||||||||||||||
| 6.3.1.1. Over-coverage - rate | |||||||||||||||||||||||||||||||||||||||||||||||||||||||||||||||||||||||||||||||||||||||||||||||||||||||||||||||||||||||||||||||||||||||||||||||||||||||||||||||||||||||
not available |
|||||||||||||||||||||||||||||||||||||||||||||||||||||||||||||||||||||||||||||||||||||||||||||||||||||||||||||||||||||||||||||||||||||||||||||||||||||||||||||||||||||||
| 6.3.1.2. Common units - proportion | |||||||||||||||||||||||||||||||||||||||||||||||||||||||||||||||||||||||||||||||||||||||||||||||||||||||||||||||||||||||||||||||||||||||||||||||||||||||||||||||||||||||
[Not requested] |
|||||||||||||||||||||||||||||||||||||||||||||||||||||||||||||||||||||||||||||||||||||||||||||||||||||||||||||||||||||||||||||||||||||||||||||||||||||||||||||||||||||||
| 6.3.2. Measurement error | |||||||||||||||||||||||||||||||||||||||||||||||||||||||||||||||||||||||||||||||||||||||||||||||||||||||||||||||||||||||||||||||||||||||||||||||||||||||||||||||||||||||
The SES questionnaires were collected from respondents using electronic questionnaires (on-line, .ffdata format). 98.9 per cent of all respondents filled out electronic templates of questionnaires. Other respondents sent data on paper questionnaires. The first verification of data was made in the regional statistical offices. Every statistician has a definite number of enterprises from which the questionnaires have to be collected. Then the collected data were entered, checked and corrected. Each questionnaire was validated according to the validation program. The validation program consists of the arithmetical and logical controls. The respondents were contacted via phone or e-mail. The second control of the data was accomplished at the Labour Statistics Division in Statistics Lithuania. Enterprises were re-contacted and the required corrections were made in the primary database in cases when errors had been found. Due to the heavy reporting burden respondents made many errors, although detailed explanatory notes were attached to the SES questionnaire with the aim of minimising errors. The total number of errors made up 41 831. The variables that have been corrected most often are the following:
|
|||||||||||||||||||||||||||||||||||||||||||||||||||||||||||||||||||||||||||||||||||||||||||||||||||||||||||||||||||||||||||||||||||||||||||||||||||||||||||||||||||||||
| 6.3.3. Non response error | |||||||||||||||||||||||||||||||||||||||||||||||||||||||||||||||||||||||||||||||||||||||||||||||||||||||||||||||||||||||||||||||||||||||||||||||||||||||||||||||||||||||
Response rates of enterprises are provided in the table below:
Response rates of local units / enterprises by economic activity and size band
The total response rate of local units / enterprises is 97.6 per cent. The weights were adjusted according to the non-response rate in each stratum. Statistics Lithuania uses national classification of non-response reasons. The results of the survey showed that 2.4 per cent of sampled local units / enterprises did not respond to the questionnaire, of which 0.8 per cent – due to legal reasons and 1.6 cent – due to illegal ones. Legal reasons are as follows: the bankruptcy of the enterprise, its liquidation and suspension of economic activity. The non-response to the questionnaire committed by an operating or not found enterprise or local unit is treated as an illegal reason. |
|||||||||||||||||||||||||||||||||||||||||||||||||||||||||||||||||||||||||||||||||||||||||||||||||||||||||||||||||||||||||||||||||||||||||||||||||||||||||||||||||||||||
| 6.3.3.1. Unit non-response - rate | |||||||||||||||||||||||||||||||||||||||||||||||||||||||||||||||||||||||||||||||||||||||||||||||||||||||||||||||||||||||||||||||||||||||||||||||||||||||||||||||||||||||
[Not requested] |
|||||||||||||||||||||||||||||||||||||||||||||||||||||||||||||||||||||||||||||||||||||||||||||||||||||||||||||||||||||||||||||||||||||||||||||||||||||||||||||||||||||||
| 6.3.3.2. Item non-response - rate | |||||||||||||||||||||||||||||||||||||||||||||||||||||||||||||||||||||||||||||||||||||||||||||||||||||||||||||||||||||||||||||||||||||||||||||||||||||||||||||||||||||||
[Not requested] |
|||||||||||||||||||||||||||||||||||||||||||||||||||||||||||||||||||||||||||||||||||||||||||||||||||||||||||||||||||||||||||||||||||||||||||||||||||||||||||||||||||||||
| 6.3.4. Processing error | |||||||||||||||||||||||||||||||||||||||||||||||||||||||||||||||||||||||||||||||||||||||||||||||||||||||||||||||||||||||||||||||||||||||||||||||||||||||||||||||||||||||
not available |
|||||||||||||||||||||||||||||||||||||||||||||||||||||||||||||||||||||||||||||||||||||||||||||||||||||||||||||||||||||||||||||||||||||||||||||||||||||||||||||||||||||||
| 6.3.4.1. Imputation - rate | |||||||||||||||||||||||||||||||||||||||||||||||||||||||||||||||||||||||||||||||||||||||||||||||||||||||||||||||||||||||||||||||||||||||||||||||||||||||||||||||||||||||
not available |
|||||||||||||||||||||||||||||||||||||||||||||||||||||||||||||||||||||||||||||||||||||||||||||||||||||||||||||||||||||||||||||||||||||||||||||||||||||||||||||||||||||||
| 6.3.5. Model assumption error | |||||||||||||||||||||||||||||||||||||||||||||||||||||||||||||||||||||||||||||||||||||||||||||||||||||||||||||||||||||||||||||||||||||||||||||||||||||||||||||||||||||||
No models of assumption errors were used in the SES 2014. |
|||||||||||||||||||||||||||||||||||||||||||||||||||||||||||||||||||||||||||||||||||||||||||||||||||||||||||||||||||||||||||||||||||||||||||||||||||||||||||||||||||||||
| 6.4. Seasonal adjustment | |||||||||||||||||||||||||||||||||||||||||||||||||||||||||||||||||||||||||||||||||||||||||||||||||||||||||||||||||||||||||||||||||||||||||||||||||||||||||||||||||||||||
[Not requested] |
|||||||||||||||||||||||||||||||||||||||||||||||||||||||||||||||||||||||||||||||||||||||||||||||||||||||||||||||||||||||||||||||||||||||||||||||||||||||||||||||||||||||
| 6.5. Data revision - policy | |||||||||||||||||||||||||||||||||||||||||||||||||||||||||||||||||||||||||||||||||||||||||||||||||||||||||||||||||||||||||||||||||||||||||||||||||||||||||||||||||||||||
[Not requested] |
|||||||||||||||||||||||||||||||||||||||||||||||||||||||||||||||||||||||||||||||||||||||||||||||||||||||||||||||||||||||||||||||||||||||||||||||||||||||||||||||||||||||
| 6.6. Data revision - practice | |||||||||||||||||||||||||||||||||||||||||||||||||||||||||||||||||||||||||||||||||||||||||||||||||||||||||||||||||||||||||||||||||||||||||||||||||||||||||||||||||||||||
No mistakes were found in the SES 2014after the information was published. |
|||||||||||||||||||||||||||||||||||||||||||||||||||||||||||||||||||||||||||||||||||||||||||||||||||||||||||||||||||||||||||||||||||||||||||||||||||||||||||||||||||||||
| 6.6.1. Data revision - average size | |||||||||||||||||||||||||||||||||||||||||||||||||||||||||||||||||||||||||||||||||||||||||||||||||||||||||||||||||||||||||||||||||||||||||||||||||||||||||||||||||||||||
[Not requested] |
|||||||||||||||||||||||||||||||||||||||||||||||||||||||||||||||||||||||||||||||||||||||||||||||||||||||||||||||||||||||||||||||||||||||||||||||||||||||||||||||||||||||
|
|||
| 7.1. Timeliness | |||
The time interval between the release of the publication and the end of the reference period was 21 months. |
|||
| 7.1.1. Time lag - first result | |||
[Not requested] |
|||
| 7.1.2. Time lag - final result | |||
[Not requested] |
|||
| 7.2. Punctuality | |||
On the 11th of November 2014, all the points to be accomplished regarding the SES 2014 were scheduled in “The Plan of Activities for SES 2014”. On the 27th of December, the statistical questionnaire DUS-01 and the methodical explanations for filling in the questionnaire of the Structure of Earnings Survey were approved by the Order No. DĮ- 320 of the Director General of Statistics Lithuania. A sample for the SES 2014 was drawn in November 2014. Letters for the sampled enterprises with no local units / enterprises were sent on 30 December 2014, for the enterprises that had local units / enterprises – on 10 January 2015. The letters informed concrete statistical units about the participation in the SES 2014 and invited them to submit the questionnaire until 15 March 2015. Part of respondents asked for more time and it was allowed to deliver the questionnaires later. The rest of enterprises received reminders. Data received from electronic questionnaires were transferred to the main database. Regional statistical offices collected, checked, corrected data according to an approved schedule. The data processing period in regional statistical offices stopped on the 31st of October 2015. The second control of data was accomplished by the Labour Statistics Division of Statistics Lithuania till the end of December 2015. The preparation of software for the calculation of estimates and standard errors continued until March 2016. The calculation of estimates, as well as verification of data at the aggregated level and their analysis, the coherence with data from other sources continued until June 2016. Data of the SES 2014 were transmitted to Eurostat on 28 June 2016. The press release and publication were prepared according to the Advance Release Calendar – on 4 July and 12 October 2016. |
|||
| 7.2.1. Punctuality - delivery and publication | |||
[Not requested] |
|||
|
|||
| 8.1. Comparability - geographical | |||
No differences between European and National concepts and definitions. |
|||
| 8.1.1. Asymmetry for mirror flow statistics - coefficient | |||
[Not requested] |
|||
| 8.2. Comparability - over time | |||
The time series of the indicator is not fully comparable. Data of the SES 2006 and 2002 are not directly comparable because the SES in 2002 did not cover individual enterprises. Data, excluding individual enterprises, are totally comparable. Surveys in 2002 and 2006 covered economic activities defined in sections from C to O of EVRK Rev. 1.1. The occupations of employees were classified according to the Lithuanian Classification of Occupations (LCO 2000 and LCO 2005), which is based on the International Standard Classification of Occupations (ISCO-88 and ISCO-88 (COM)). In the 2010 and 2014 surveys, statistical data were collected from economic activities from B to S according NACE Rev. 2. Occupations of employees are classified according to the Lithuanian Classification of Occupations LCO 2008, which is based on the International Standard Classification of Occupations (ISCO-08). No specific changes in definitions, coverage and methods occurred in 2014 compared to previous surveys. |
|||
| 8.2.1. Length of comparable time series | |||
[Not requested] |
|||
| 8.3. Coherence - cross domain | |||
[Not requested] |
|||
| 8.4. Coherence - sub annual and annual statistics | |||
[Not requested] |
|||
| 8.5. Coherence - National Accounts | |||
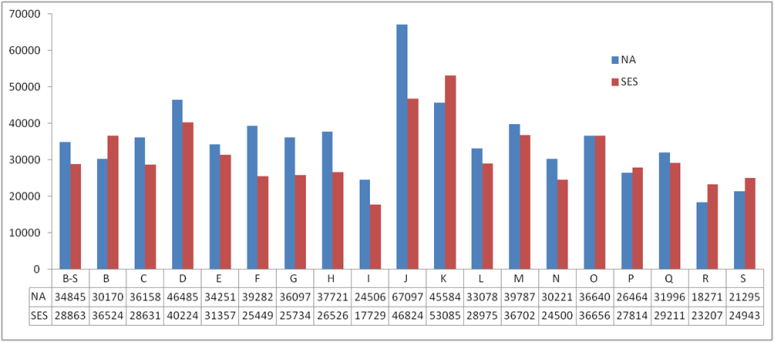
Comparison was made between the variable “gross annual earnings in the reference year” expressed per employee and the variable “wages and salaries” per employee of NA. The results are showed in figure below.
Gross annual earnings (SES) and annual wages and salaries (NA) per employee in 2014
In some NACE sections, “wages and salaries” figures from NA are higher than the SES average. These differences can be due to different methodologies used, different data sources, rate of black economy in NA, gratuities and daily allowances which are included in NA but not taken into account in SES. |
|||
| 8.6. Coherence - internal | |||
[Not requested] |
|||
|
|||
| 9.1. Dissemination format - News release | |||
| 9.2. Dissemination format - Publications | |||
The publication “Structure of Earnings 2014” is accessible for everybody free of charge for reading and downloading. The publication presents information on the number of employees, earnings, working time, etc. by employees’ occupation, level of education, age, length of service in the enterprise, sex, economic activity, etc. Statistical information is presented at the national and county levels. The main results of the survey were also published in the Statistical Yearbook of Lithuania 2015 available free of charge on the website of Statistics Lithuania. |
|||
| 9.3. Dissemination format - online database | |||
The information on the SES results, i.e. the number of employees, gross earnings by various breakdowns is accessible for everybody free of charge in the Database of Indicators on the Official Statistics Portal Lithuania at https://osp.stat.gov.lt/pradinis |
|||
| 9.3.1. Data tables - consultations | |||
[Not requested] |
|||
| 9.4. Dissemination format - microdata access | |||
[Not requested] |
|||
| 9.5. Dissemination format - other | |||
Not applicable. |
|||
| 9.6. Documentation on methodology | |||
The SES metadata is available on the Official Statistics Portal Lithuania http://osp.stat.gov.lt/en/metainformacija9 The SES methodology (in Lithuanian) is also available on the Official Statistics Portal Lithuania at https://osp.stat.gov.lt/en_GB/darbo-apmokejimas-ir-darbo-sanaudos |
|||
| 9.7. Quality management - documentation | |||
[Not requested] |
|||
| 9.7.1. Metadata completeness - rate | |||
[Not requested] |
|||
| 9.7.2. Metadata - consultations | |||
[Not requested] |
|||
|
|||
In 2014, a respondent spent, on average, 5 hours and 10 minutes on the preparation of statistical data and filling in the questionnaire. The sample rotation is performed in order to reduce the burden for small enterprises, i.e. part of the enterprises (about 25 per cent) is randomly dropped from the sample, and new enterprises are randomly sampled to replace them. |
|||
|
|||
| 11.1. Confidentiality - policy | |||
In the process of statistical data collection, processing and analysis and dissemination of statistical information, Statistics Lithuania fully guarantees the confidentiality of the data submitted by respondents (households, enterprises, institutions, organisations and other statistical units), as defined in the Confidentiality Policy Guidelines of Statistics Lithuania |
|||
| 11.2. Confidentiality - data treatment | |||
[Not requested] |
|||
|
|||
Conclusion The requirements of EC regulations have been fully met and SES 2014 micro data were transmitted to Eurostat on schedule. |
|||
|
|||
|
|||
| Sampling errors |
|||