|
 |
|
| For any question on data and metadata, please contact: Eurostat user support |
|
|||
| 1.1. Contact organisation | Czech Statistical Office |
||
| 1.2. Contact organisation unit | Labour Market and Equal Opportunities Statistic Department |
||
| 1.5. Contact mail address | Na padesatem 81 |
||
|
|||
| 2.1. Data description | |||
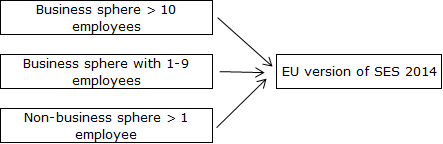
The composition of the 2014 Structure of Earnings Survey (SES) Quality Report is based on the EC Regulation No. 698/2006 of May 2006. The quality of the statistical data as well as the whole course of the survey is assessed according to criteria relevant for users, processors and administrators of the survey (relevance, accuracy, punctuality and timeliness, accessibility and clarity, comparability and coherence). The main statistical source for the SES data has been the ”Informacni system o prumernem vydelku“ (ISPV, i.e. Information System on the Average Earnings). The course and development of the survey is directed by the Commission on the direction and coordination of works on the ISPV, which is composed by representatives of the Ministry of Labour and Social Affairs, the Ministry of Finance, the Czech Statistical Office, the Czech National Bank, CERGE-Economic Institute, High School of Economics in Prague, Czech-Moravian Confederation of Trade Unions, Union of Industry and Transportation. The main goal of ISPV is to show earnings levels broken down by individual occupations, other results include estimations on the earnings parameters of the population of employees in the Czech Republic. The ISPV consists of two basic parts – surveys of business and non-business spheres of the national economy of the Czech Republic. The business sphere is composed of economical subjects (ES) – enterprises which remunerate their employees with wage according to the section 109, paragraph 2, of the Act No 262/2006 Coll.; the non-business sphere is composed of economic subjects (ES) which remunerate their employees with salary according to the section 109, paragraph 3, of the same Act. The ISPV in the business sphere has been taking place as a quarterly survey in enterprises with 10 or more employees (ISPV-MZS). With quarterly periodicity, basic data on wage sums and working time and numbers of employees. Half-yearly, the detailed databases are gathered: wage components, hourly earnings and working hours of individual employees. Since 2010, the ISPV covers also non-profit organizations and the small entrepreneurs from the SNA sector of Household. In addition, an 2015 ad-hoc survey for ES with less than 10 employees was made for 2014 reference year (micro-subjects). In the non-business spheres, the source of data has been Information System on Salary (ISP), which covers all ESs of the sphere, i.e. exhaustive survey. ISP is half yearly. Based on the data from both ISPV-MZS and ISP, the Structure of Earnings Survey is annual survey in the Czech Republic. The following scheme shows the system of earnings surveys for 2014:
|
|||
| 2.2. Classification system | |||
NACE Rev. 2 ISCO-08 ISCED-11 NUTS |
|||
| 2.3. Coverage - sector | |||
NACE Rev. 2 sections B to S |
|||
| 2.4. Statistical concepts and definitions | |||
Employees are all persons who have a direct employment contract with the enterprise or local unit and receive remuneration, irrespective of the type of work performed, the number of hours worked (full or part-time) and the duration of the contract (fixed or indefinite). Mean annual gross earnings also cover all 'non-standard payments', i.e. payments not occurring in each pay period, such as: 13th or 14th month payments, holiday bonuses, quarterly or annual company bonuses and annual payments in kind. Mean monthly gross earnings in the reference month cover remuneration in cash paid before any tax deductions and social security contributions payable by wage earners and retained by the employer, and are restricted to gross earnings which are paid in each pay period during the reference month. Mean hourly gross earnings are defined as gross earnings in the reference month divided by the number of hours paid during the same period. Number of hours paid includes all normal and overtime hours worked and remunerated by the employer during the reference month. Hours not worked but nevertheless paid are counted as 'paid hours' (e.g. for annual leave, public holidays, paid sick leave, paid vocational training, paid special leave, etc.).
|
|||
| 2.5. Statistical unit | |||
The unit under observation is the Local unit, but the data are usually taken from the enterprise information system.
|
|||
| 2.6. Statistical population | |||
The statistical population is formed as information on both enterprises and employees, linked together.
|
|||
| 2.7. Reference area | |||
The whole area of the Czech Republic is the reference area.
|
|||
| 2.8. Coverage - Time | |||
The data refer to the whole (calendar) year 2014.
|
|||
| 2.9. Base period | |||
The Structure of Earning Survey has no base period as it is a kind of ad-hoc survey.
|
|||
|
||||||||||||||||||||||||||||||||||||||||||||||||||||||||||||||
| 3.1. Source data | ||||||||||||||||||||||||||||||||||||||||||||||||||||||||||||||
The 2014 SES stemmed from three sources: the survey of the business sphere (ISPV-MZS), the survey of the non-business sphere (ISP) and the survey of micro-subjects of business sphere. The data base had been cut before computation with regard to some industries to meet Eurostat requirements (the national SES covers also NACE A). The following description regards the data adapted in this way. The survey of business sphere ISPV-MZS is a regular quarterly sample statistical survey. The sample of employees can be characterised as a two-stage probability sampling without repetition. In the first stage, enterprises are found using stratification sampling, all employees inside these enterprises are sampled in the second stage. Population frame for the first stage of the sampling is made using the Business Register of the CZSO and the RARIS register which allows to decide whether the enterprise belongs to business or non-business sphere. The population is created by active enterprises with 10 or more employees; it is stratified by:
Industrial strata are set according to the similarity in the labour nature and structure of occupations and average wages similarity according to the Wage Enterprise Reporting. The population is divided to 6 groups:
Within these groups more detailed strata are defined based on similarity in wage levels and occupational structures. There are four strata based on the size group of the ES: 10-49; 50-249; 250-999; 1000+. The NUTS 3 region is defined by Constitution Act no 347/1997,Coll. The 2014 frame population incorporated 37,705 enterprises, of which 3,949 have sent data worth of processing. The following table shows a summary on the cumulated sample stratification with the numbers of enterprises in the population and the probability of the sampling.
The survey of the non-business sphere ISP is a regular half-yearly exhaustive statistical survey. ESs bound to respond by law have been sending the information on all their employees. Consequently, there are no sampling errors in the non-business sphere, only non-sampling ones. The frame population for the 2014 incorporated 16,618 ESs, of which 13,530 send data worth of processing. The survey of micro-subjects An Ad hoc survey on the business sphere enterprises with less than ten employees was carried out in 2015 with reference year 2014. The sample of employees can be characterised as a two-stage probability sampling without revolving. In the first stage, enterprises are found using stratification sampling, while all employees inside these enterprises are sampled in the second stage. The frame population was stratified by:
Two size classes have been used for the stratification, see following table. There have also been ten industrial groupings, similarly as in the ISPV-MZS. The frame population for the 2014 incorporated 182,394 ESs, of which 1,545 ESs send data worth of processing. The following table show a summary on the cumulative sampling strata with the numbers of ESs in the frame population and sampling rates:
|
||||||||||||||||||||||||||||||||||||||||||||||||||||||||||||||
| 3.2. Frequency of data collection | ||||||||||||||||||||||||||||||||||||||||||||||||||||||||||||||
ISPV (business sphere) quarterly; ISP (non-business sphere) half-yearly; micro-subjects 4-yearly by EU-SES. |
||||||||||||||||||||||||||||||||||||||||||||||||||||||||||||||
| 3.3. Data collection | ||||||||||||||||||||||||||||||||||||||||||||||||||||||||||||||
The data of ISPV-MZS are collected from respondents in the form of databases; they include information on employer and employees. In more than 90 % cases, data stem directly from inter-enterprise information system on wages and personal information. About nine out of ten respondents use electronic mail for sending data, the rest use diskettes, rarely paper form. |
||||||||||||||||||||||||||||||||||||||||||||||||||||||||||||||
| 3.4. Data validation | ||||||||||||||||||||||||||||||||||||||||||||||||||||||||||||||
For data checking and entering respectively, there was “Local Acquisition Software ISPV”, which needed to be installed to local hard disk. The other way is use of Internet Checking Program, through which data could be sent. In contrast with the Local Acquisition Software, the data could not be directly edited in this way. Both programs are available on the website www.ispv.cz for free, see section “Pro respondenty šetření”. There is straight communication with the respondent via phone or e-mail. It could serve for revision of mistakes. |
||||||||||||||||||||||||||||||||||||||||||||||||||||||||||||||
| 3.5. Data compilation | ||||||||||||||||||||||||||||||||||||||||||||||||||||||||||||||
See 2. |
||||||||||||||||||||||||||||||||||||||||||||||||||||||||||||||
| 3.6. Adjustment | ||||||||||||||||||||||||||||||||||||||||||||||||||||||||||||||
No methods used to estimated/model the missing information have been created. Survey sapmles are supposed to represent the whole national economy. |
||||||||||||||||||||||||||||||||||||||||||||||||||||||||||||||
|
|||
| 4.1. Quality assurance | |||
See below 4.2
|
|||
| 4.2. Quality management - assessment | |||
The quality of the SES depends on the external provider contracted by MLSA. |
|||
|
|||
| 5.1. Relevance - User Needs | |||
Relevance denotes the degree to which statistics meet users’ needs. International survey of 2014 SES cannot be judged separately, the results of the national SES are predominantly used in the CR annually, and also results of the ISPV. Therefore, this part refers mainly line to relevance of these surveys and their results for the domestic users. The users of the structural earnings surveys results Central government, trade unions and organizations of employers: Ministry of Labour and Social Affairs, Labour Offices, Ministry of Finance, Czech Statistical Office, Czech National Bank, Czech-Moravian Confederation of Trade Unions, Confederation of Industry of the Czech republic. Their requirements and comments are formulated and assessed during meetings of the directing Commission. Research institutions and universities CERGE-EI, University of Economics, VŠB – Technical University of Ostrava, Aarhus School of Business. Their requirements on the width and quality of the data are formulated during joint research projects with the processing organization. Labour Offices and Courts Labour Offices are important users of both national ISPV and ISPV regional results. The Courts lords use the ISPV when solving some problems on labour laws. Respondents Respondents of the survey have possibility to get a free hard-copy of the publication of the ISPV-MZS results. The contact with them strengthens a feedback with processing organization, their comments help expose drawback of the survey and consequently remove them. Public The public has free electronic access to national survey results, the web pages are placed on MLSA (www.mpsv.cz or portal.mpsv.cz), or directly on the ISPV portal www.ispv.cz; also paper publication are available (for buying). The yearly results emphasising gender dimension are available at the CZSO domain www.czso.cz. |
|||
| 5.2. Relevance - User Satisfaction | |||
Satisfaction of the users have been formulated and assessed via the directing Commission. Main users put the importance on the wage distributions with key indicator of wage median. Also, the harmonization of SES results with national accounting has been put on table. Researcher predominantly yearn for data linking enterprise-employee, but complain about impossibility to compare the employee data in time, e.g. 2010 and 2014 data (within the recent circumstances, the employee identification is not feasible to keep in all cases). In addition, results of the respondents satisfaction questionnaires are periodically evaluated. Answers predominantly refer to national variables and saturation of domestic needs. |
|||
| 5.3. Completeness | |||
There is perfect complience with the Regulation on SES. |
|||
| 5.3.1. Data completeness - rate | |||
100% |
|||
|
||||||||||||||||||||||||||||||||||||||||||||||||||||||||||||||||||||||||||||||||||||||||||||||||||||||||||||||||||||||||||||||||||||||||||||||||||||||||||||||||||||||||||||||||
| 6.1. Accuracy - overall | ||||||||||||||||||||||||||||||||||||||||||||||||||||||||||||||||||||||||||||||||||||||||||||||||||||||||||||||||||||||||||||||||||||||||||||||||||||||||||||||||||||||||||||||||
Generally, accuracy denotes the closeness of computations or estimates to the exact or true values of the variables under consideration. The differences between estimations and true values are called errors, errors caused by the sampling are sampling errors and other errors are called non-sampling errors.
|
||||||||||||||||||||||||||||||||||||||||||||||||||||||||||||||||||||||||||||||||||||||||||||||||||||||||||||||||||||||||||||||||||||||||||||||||||||||||||||||||||||||||||||||||
| 6.2. Sampling error | ||||||||||||||||||||||||||||||||||||||||||||||||||||||||||||||||||||||||||||||||||||||||||||||||||||||||||||||||||||||||||||||||||||||||||||||||||||||||||||||||||||||||||||||||
The sampling error is expressed as a coefficient of variation of the mean. The CV is a division of the standard deviation of the mean (numerator) and the mean (denominator). The standard deviation have been calculated by means of common parametric method. The weighted data have been defined for the calculation adequately as a one-stage stratified probability sample of groups with limited number of elements in every stage with equal probabilities. |
||||||||||||||||||||||||||||||||||||||||||||||||||||||||||||||||||||||||||||||||||||||||||||||||||||||||||||||||||||||||||||||||||||||||||||||||||||||||||||||||||||||||||||||||
| 6.2.1. Sampling error - indicators | ||||||||||||||||||||||||||||||||||||||||||||||||||||||||||||||||||||||||||||||||||||||||||||||||||||||||||||||||||||||||||||||||||||||||||||||||||||||||||||||||||||||||||||||||
Coefficients of variation by age:
Coefficients of variation by occupation:
Coefficients of variation by education:
Coefficients of variation by size class:
Coefficients of variation by NACE section:
Coefficients of variation by type of contract and sex:
Overall coefficient of variation:
|
||||||||||||||||||||||||||||||||||||||||||||||||||||||||||||||||||||||||||||||||||||||||||||||||||||||||||||||||||||||||||||||||||||||||||||||||||||||||||||||||||||||||||||||||
| 6.3. Non-sampling error | ||||||||||||||||||||||||||||||||||||||||||||||||||||||||||||||||||||||||||||||||||||||||||||||||||||||||||||||||||||||||||||||||||||||||||||||||||||||||||||||||||||||||||||||||
The difference between target population required by EC Regulation 698/2006 and the reference population referring to the ESs from the CZSO Business register in 2014 has the solely reason in excluding employees with non-standard labour contracts (temporary jobs). There is no assessment of the under-coverage and over-coverage as there is no recent quality report on the Business Register available; there are some problems with the units size. |
||||||||||||||||||||||||||||||||||||||||||||||||||||||||||||||||||||||||||||||||||||||||||||||||||||||||||||||||||||||||||||||||||||||||||||||||||||||||||||||||||||||||||||||||
| 6.3.1. Coverage error | ||||||||||||||||||||||||||||||||||||||||||||||||||||||||||||||||||||||||||||||||||||||||||||||||||||||||||||||||||||||||||||||||||||||||||||||||||||||||||||||||||||||||||||||||
The dominant source of SES is the ISPV which is permanent survey and its sample file is defined and altering gradually. Because of this fact, some under-coverage errors occur due to the situation when the sampling plan for a specific part of the sampling file is created before the grossing-up plan. An assessment of these errors for individual sources is as follows: Coverage errors in the ISPV-MZS Sampling of ISPV-MZS goes in two stages – updating of the exhaustive part (every year) and progressive changes of sample part by the method of rotating panel. In addition, we must take into account the time needed for the creation of the sampling plan (approx. 2 months) and the time needed for incorporating the new ES into the survey (average time is approx. 6 months). As the survey is carried out just one month after the end of reference period for practical reasons, the new ESs cannot be incorporated at once to the sampling plan. The following table shows coverage errors that happened because of the sampling plan a technical obstacles, by size classes:
There has been an alteration in the sampling scheme between up to 2010 resulting in the reduction of coverage error. The reasons for the change were the implementation of the new version of the NACE classification and harmonization with the CZSO Wage Enterprise Reporting (See chapter 8). Coverage errors in the ISP The coverage errors have been eliminated by the system of data collection. The “submissioners” have been sending data for themselves as well as for the organizations under their direction (respondents). The submissioners are ministries, regional governments, state funds etc. They have to make a registration to enter the ISP. The purpose of the registration is to get information on the recent valid contact data, especially the electronic address. In the new campaign, only those submissioners make a registration whose contact data have changed. The respondents do not make a registration, their data are entered by the submissioner. Coverage errors in the micro-subject survey 2014 micro-subject survey had been carried out as ad-hoc survey. Because of the most recent support register data, we do not suppose any coverage error. |
||||||||||||||||||||||||||||||||||||||||||||||||||||||||||||||||||||||||||||||||||||||||||||||||||||||||||||||||||||||||||||||||||||||||||||||||||||||||||||||||||||||||||||||||
| 6.3.1.1. Over-coverage - rate | ||||||||||||||||||||||||||||||||||||||||||||||||||||||||||||||||||||||||||||||||||||||||||||||||||||||||||||||||||||||||||||||||||||||||||||||||||||||||||||||||||||||||||||||||
For the rates see table attached in 6.3.1. |
||||||||||||||||||||||||||||||||||||||||||||||||||||||||||||||||||||||||||||||||||||||||||||||||||||||||||||||||||||||||||||||||||||||||||||||||||||||||||||||||||||||||||||||||
| 6.3.1.2. Common units - proportion | ||||||||||||||||||||||||||||||||||||||||||||||||||||||||||||||||||||||||||||||||||||||||||||||||||||||||||||||||||||||||||||||||||||||||||||||||||||||||||||||||||||||||||||||||
Not appplicable. |
||||||||||||||||||||||||||||||||||||||||||||||||||||||||||||||||||||||||||||||||||||||||||||||||||||||||||||||||||||||||||||||||||||||||||||||||||||||||||||||||||||||||||||||||
| 6.3.2. Measurement error | ||||||||||||||||||||||||||||||||||||||||||||||||||||||||||||||||||||||||||||||||||||||||||||||||||||||||||||||||||||||||||||||||||||||||||||||||||||||||||||||||||||||||||||||||
In the ISP, data are send via secured internet page of the Ministry of Finance, where basic check mechanisms are embedded. The data gathered this way are then send to the processor. More difficult communication is in the ISP, because the data are send through a submissioner. On the other hand, this system minimizes coverage errors. All the data are send electronically. The data of ISPV-MZS are collected from respondents in the form of databases; they include information on employer and employees. In more than 90 % cases, data stem directly from inter-enterprise information system on wages and personal information. About nine out of ten respondents use electronic mail for sending data, the rest use diskettes, rarely paper form. In the ISP, data are send via secured internet page of the Ministry of Finance, where basic check mechanisms are embedded. The data gathered this way are then send to the processor. More difficult communication is in the ISP, because the data are send through a submissioner. On the other hand, this system minimizes coverage errors. All the data are send electronically. In the survey on micro-subjects, data were send electronically in 58 % cases and 42 % of respondents send data on paper questionnaires. The risk of wrong data was the biggest there. Revision was made by the processing firm during phone consultation with the respondent. In comparison with 2010 SES, the share of electronically sent data have risen by 20 p.p. All the data files (ISPV-MZS, ISP and micro-subjects) have been preserved in the seven data-stores. In the individual data-stores, there are saved original data from the respondents, data before the data-checks and data after the data-checks (both automatic and manual). Grossing-up to the whole population is made by applying weights for individual records on the final database file. Triple automatic check is made during the data collecting and processing. In addition, a visual check is made after that. Any mistakes found are dealt with in relation to their importance – either by contacting the respondent or directly by the processing company. Some help is obvious with coding of occupational classification since this task is the most difficult for the respondent; consultations by telephone are provided. After data entering, additional checks are made on the levels of regions and individual professions. Some checks are also made accordingly on the level of ESs. On the aggregated level, we search for changes in time and look for explanations. An example can be earnings level in the individual occupation in region – in case on change more than 20 % y-o-y the enterprise data are analysed. The very last stage is data check before their sending to Eurostat. 2,219,396 records passed all the checks, 26,835 have been erased. The most records erased didn’t pass the check on the number of weeks to which the yearly earnings refers - 12,263; 7,905 records failed in the check on the number of paid hours in month.
|
||||||||||||||||||||||||||||||||||||||||||||||||||||||||||||||||||||||||||||||||||||||||||||||||||||||||||||||||||||||||||||||||||||||||||||||||||||||||||||||||||||||||||||||||
| 6.3.3. Non response error | ||||||||||||||||||||||||||||||||||||||||||||||||||||||||||||||||||||||||||||||||||||||||||||||||||||||||||||||||||||||||||||||||||||||||||||||||||||||||||||||||||||||||||||||||
In this part of the chapter, reasons for non-response of whole enterprises are described together with procedures for minimising the errors. |
||||||||||||||||||||||||||||||||||||||||||||||||||||||||||||||||||||||||||||||||||||||||||||||||||||||||||||||||||||||||||||||||||||||||||||||||||||||||||||||||||||||||||||||||
| 6.3.3.1. Unit non-response - rate | ||||||||||||||||||||||||||||||||||||||||||||||||||||||||||||||||||||||||||||||||||||||||||||||||||||||||||||||||||||||||||||||||||||||||||||||||||||||||||||||||||||||||||||||||
Non-response rate in 2014 was 12.2%, which is by two p.p. better than for 2010.
Response rate in the ISP It is important to know the exact frame population of the survey, which comes to existence during the registration and data collecting itself (See 6.3.1).
Response rate in the micro-subject survey There was a big improvement in comparison with 2010 SES because of significantly more active role of the Ministry of Labour and Social Affairs during the data collection. Response rates in this ad hoc survey shows following table:
|
||||||||||||||||||||||||||||||||||||||||||||||||||||||||||||||||||||||||||||||||||||||||||||||||||||||||||||||||||||||||||||||||||||||||||||||||||||||||||||||||||||||||||||||||
| 6.3.3.2. Item non-response - rate | ||||||||||||||||||||||||||||||||||||||||||||||||||||||||||||||||||||||||||||||||||||||||||||||||||||||||||||||||||||||||||||||||||||||||||||||||||||||||||||||||||||||||||||||||
Not used. |
||||||||||||||||||||||||||||||||||||||||||||||||||||||||||||||||||||||||||||||||||||||||||||||||||||||||||||||||||||||||||||||||||||||||||||||||||||||||||||||||||||||||||||||||
| 6.3.4. Processing error | ||||||||||||||||||||||||||||||||||||||||||||||||||||||||||||||||||||||||||||||||||||||||||||||||||||||||||||||||||||||||||||||||||||||||||||||||||||||||||||||||||||||||||||||||
See below 6.3.4.1 |
||||||||||||||||||||||||||||||||||||||||||||||||||||||||||||||||||||||||||||||||||||||||||||||||||||||||||||||||||||||||||||||||||||||||||||||||||||||||||||||||||||||||||||||||
| 6.3.4.1. Imputation - rate | ||||||||||||||||||||||||||||||||||||||||||||||||||||||||||||||||||||||||||||||||||||||||||||||||||||||||||||||||||||||||||||||||||||||||||||||||||||||||||||||||||||||||||||||||
Items from Table A marked as A12, A13 were added from administrative sources. As for item A15 – type of collective pay agreement and A14 – the information was sent by respondent and then matched and improved with administrative source information on collective agreements (report of MLSA) and from the Information system on working conditions together with Business Register. If the true value was unknown, we supposed that no collective pay agreement existed (“unknown” is not possible in 2014 SES). 1,304 items have been imputed this way, predominantly from the micro-subject survey. In the non-business sphere, the ISP covers collective bargaining since 2015 and the gathered values have been linked back to 2014 SES. The following table shows numbers of imputed values and rates of imputation for items of Table B.
B25 item was imputed according to the occupation and age. There was no need to impute other variables; wrong records were misplaced during the creation of microdata file, respectively. There was a specific situation as for B23 item. Some records were refused as suspicious for wrong ISCO codes. (For the biggest part, it was because of extreme values referring to this specific occupation). Overall imputation rate Overall number of imputed variables and overall rate of imputation is lower than the sum of individual cases, because in some cases more than one imputation was made for one employee/record. The overall imputation rate is 3.5%. |
||||||||||||||||||||||||||||||||||||||||||||||||||||||||||||||||||||||||||||||||||||||||||||||||||||||||||||||||||||||||||||||||||||||||||||||||||||||||||||||||||||||||||||||||
| 6.3.5. Model assumption error | ||||||||||||||||||||||||||||||||||||||||||||||||||||||||||||||||||||||||||||||||||||||||||||||||||||||||||||||||||||||||||||||||||||||||||||||||||||||||||||||||||||||||||||||||
Enterprise grossing up and imputations The aim of the enterprise grossing up is to add weight coefficients to the enterprises from sample in a way to get to results of the same structure and of the same number of enterprises as the frame population had. The weights stem from probability sample weights of individual enterprises, they take account of non-response and sample respondents´ errors as well as recent structure of the frame population. As for the sector of non-financial enterprises and financial institutions with at least 10 employees (more that 60 % of employees population), the ESs are divided to strata using size class (10-49, 50-249) and NACE groupings and regional breakdown (Prague/rest of country). For each part of this three-dimensional stratum, the proper representation weight is calculated. Every enterprise has – by stratum and sample probability – primarily set a maximum weight (weight limit). In case that the representation in the three-dimensional stratum is too small, i.e. actual respondents cannot represent all existing ESs in this stratum, a second step of the weighting is necessary, in which the ESs from same size or regional or NACE groupings are used for additional “tuning”. As for 250-999 size class, only grossing up of the non-response is needed as these enterprises should be covered exhaustively. As for entrepreneurs with at least of 10 employees, a simplified one-stage grossing up is used; size class is not taken into account for stratification (special stratum is only for ESs with 250+ employees). Data on non-financial enterprises and financial institutions and entrepreneurs with less that 10 employees (micro-subjects) are collected once a 4 years. Enterprises´ weights are calculated upon the frame population which is up-to-date in the time of the survey. For following years, earnings data are modelled - indexed according to average earnings growth in these small businesses (based on CZSO Enterprise Wages Reporting). Proper extent and structure of the estimation is done by post-stratification and grossing up to recent results of CZSO. Non-profit organizations are collected exhaustively when they have at least 65 employees; smaller organizations are surveyed on a sample basis once a 4 years together with micro-subjects. Grossing up is similar to micro-subjects. Non-business sphere is surveyed exhaustively, only grossing up of the non-response is needed there. A method of historical imputation is used for total non-response in enterprises with 1000+ employees. It means that earnings data from the past of the same ES are modified using wage index of the group of similar enterprises. Post-stratification by NACE Final step of the data harmonization is a post-stratification and grossing up to results of the CZSO Enterprise Wages Reporting. The CZSO Department of Statistical Processing have been sending data on wages and numbers of employees which had been gathered during a series of CZSO Enterprise Reporting. The Reporting is done on a sample larger to a great extent than ISPV and the results variation on an aggregated level is much lower. The post-stratification is done in two steps. In the first step, the sample is (post-)stratified by spheres (business and non-business), by 6 basic sectors (5 sectors in business and 1 in non-business sphere), size class (0-9, 10-49, 50-249, 250-999 and 1000+) and by NACE sections (21). Resulting cross-stratification is collapsed to strata in which each one consists of representative sample of ESs (at least 10 respondent in optimum). On these strata – using enterprise weights – numbers of employees (in FTE) are calculated; those are grossed up to data from mirror strata of the frame population using weight coefficients. The very same numbers of employees are finally situated both in sample and frame population after application of enterprise and post-stratification weights. In the second step, the sample file is already (post)stratified by sphere (2) and NACE section (21), the earnings volumes are recalculated within cross-stratification using correction coefficients (based on the sample file using enterprise and post-stratification weights) resulting in the mirror earnings aggregates of the frame population. |
||||||||||||||||||||||||||||||||||||||||||||||||||||||||||||||||||||||||||||||||||||||||||||||||||||||||||||||||||||||||||||||||||||||||||||||||||||||||||||||||||||||||||||||||
| 6.4. Seasonal adjustment | ||||||||||||||||||||||||||||||||||||||||||||||||||||||||||||||||||||||||||||||||||||||||||||||||||||||||||||||||||||||||||||||||||||||||||||||||||||||||||||||||||||||||||||||||
The data are not seasonally adjusted. |
||||||||||||||||||||||||||||||||||||||||||||||||||||||||||||||||||||||||||||||||||||||||||||||||||||||||||||||||||||||||||||||||||||||||||||||||||||||||||||||||||||||||||||||||
| 6.5. Data revision - policy | ||||||||||||||||||||||||||||||||||||||||||||||||||||||||||||||||||||||||||||||||||||||||||||||||||||||||||||||||||||||||||||||||||||||||||||||||||||||||||||||||||||||||||||||||
The data are not revised. |
||||||||||||||||||||||||||||||||||||||||||||||||||||||||||||||||||||||||||||||||||||||||||||||||||||||||||||||||||||||||||||||||||||||||||||||||||||||||||||||||||||||||||||||||
| 6.6. Data revision - practice | ||||||||||||||||||||||||||||||||||||||||||||||||||||||||||||||||||||||||||||||||||||||||||||||||||||||||||||||||||||||||||||||||||||||||||||||||||||||||||||||||||||||||||||||||
The data are not revised. |
||||||||||||||||||||||||||||||||||||||||||||||||||||||||||||||||||||||||||||||||||||||||||||||||||||||||||||||||||||||||||||||||||||||||||||||||||||||||||||||||||||||||||||||||
| 6.6.1. Data revision - average size | ||||||||||||||||||||||||||||||||||||||||||||||||||||||||||||||||||||||||||||||||||||||||||||||||||||||||||||||||||||||||||||||||||||||||||||||||||||||||||||||||||||||||||||||||
The data are not revised. |
||||||||||||||||||||||||||||||||||||||||||||||||||||||||||||||||||||||||||||||||||||||||||||||||||||||||||||||||||||||||||||||||||||||||||||||||||||||||||||||||||||||||||||||||
|
||||||||||||||||||||||||
| 7.1. Timeliness | ||||||||||||||||||||||||
The results of the Structure of Earnings Survey have been processed and published at the national level separately for individual surveys: ISPV-MZS, ISP and micro-subjects survey. National SES have been created upon joint database of ISPV-MZS and ISP. The most important time limits are summarized in the following table:
|
||||||||||||||||||||||||
| 7.1.1. Time lag - first result | ||||||||||||||||||||||||
The data were sent in May 2016. |
||||||||||||||||||||||||
| 7.1.2. Time lag - final result | ||||||||||||||||||||||||
The data were sent in May 2016. |
||||||||||||||||||||||||
| 7.2. Punctuality | ||||||||||||||||||||||||
Based on the comments from the directing Commission, the ISPV quarterly results have been edited and published. They are available for public with 3 months delay after the end of reference period. As for the annual national SES, the tables have been available since the end of June 2015, i.e. 6 months delay after the end of reference year. The results of micro-subjects survey have been published during the session of the directing Commission in March 2016.
The final EU SES data have been send to Eurostat in June 2012, i.e. within the term. |
||||||||||||||||||||||||
| 7.2.1. Punctuality - delivery and publication | ||||||||||||||||||||||||
The results were published by Eurostat. |
||||||||||||||||||||||||
|
|||
There is one specific detail in the Czech SES – different concept of representative month. There is no calendar month earnings under survey in the CR, but so called average month. The representative month earnings is calculated as: (Annual Earnings – Irregular Bonuses) / number of paid months of the employee The reasons for this procedure is as follows:
Other differences of the CZ-SES concept from EU concept:
|
|||
| 8.1. Comparability - geographical | |||
The comparability along the whole area of the Czech Republic is kept by using the very same methods for all regions. |
|||
| 8.1.1. Asymmetry for mirror flow statistics - coefficient | |||
No mirror flow statistic. |
|||
| 8.2. Comparability - over time | |||
The time comparability of 2002, 2006, 2010 and 2014 SES are effected by following changes: - changes of the definition of reference population - changes of the grossing up and weighting methodology Changes of the definition of reference population
Changes of the grossing up and weighting methodology
|
|||
| 8.2.1. Length of comparable time series | |||
There are recently four datasets available: 2002, 2006, 2010 and 2014 SES, which are comparable with above mentioned limits. |
|||
| 8.3. Coherence - cross domain | |||
Coherence of statistics is the extent to which they can be reliably combined in different ways and for various uses. It is, however, generally easier to identify cases of incoherence than to prove coherence. Coherence should explain similarities and/or differences between SES and other earnings surveys. In the Czech Republic, it means ISPV and statistics based on enterprise report or SES and LFS.
Coherence with the Labour Force Survey The most important methodological inconsistency between ISPV and LFS is the different population coverage. ISPV does not cover self-employed persons and workers in precarious (temporary) jobs. On the other hand, LFS covers only individual households and their members, not collective households (hostels etc.) and people living there (especially foreigners). Also LFS does not distinguish the sizes of enterprises, it covers whole national economy. Different methods for coding of industrial and occupational classifications (NACE and ISCO) are other source of inconsistency. In ISPV, the NACE codes are gathered straight from the Business Register. The ISCO codes for employees are taken from enterprise´s personal system. In LFS, both the NACE and ISCO codes are coded in the field subjectively by respondent’s or interviewer’s opinion.
Coherence with Enterprise Report There were great changes between 2006 and 2010 both in ISPV and the Enterprise Report. Both surveys had widened their target population by all ESs with 1+ employees - now they have had the same coverage. Their harmonization was completed before 2014 SES. The harmonization of ISPV means that the grossing up both to the earnings volume and the number of employees from the Enterprise Reporting is made. The Enterprise Reporting brings more precise data on the overall earnings volumes and numbers of employees because of much wider extent of collaborating enterprises. ISPV aims on the detailed structures. The harmonization enables to match the information, to add a view on distribution to the totals, medians etc. Annexes: Harmonisation of the Average Earnings Information System (MoLSA) with the Wage Statistics (CZSO) - Kateřina Duspivová, Libor Malenovský |
|||
| 8.4. Coherence - sub annual and annual statistics | |||
not applicable
|
|||
| 8.5. Coherence - National Accounts | |||
not applicable
|
|||
| 8.6. Coherence - internal | |||
All the data sources have the same methodology. |
|||
|
|||
| 9.1. Dissemination format - News release | |||
There are no News releases. |
|||
| 9.2. Dissemination format - Publications | |||
See the Annex. Annexes: Structure of Earnings Survey Regionální statistika ceny práce Focus on Women and Men Statistical Yearbook of the Czech Republic |
|||
| 9.3. Dissemination format - online database | |||
There are no 2014 SES data on the CZSO online database. |
|||
| 9.3.1. Data tables - consultations | |||
not applicable |
|||
| 9.4. Dissemination format - microdata access | |||
The SES data are accessible only by Eurostat. |
|||
| 9.5. Dissemination format - other | |||
Not used |
|||
| 9.6. Documentation on methodology | |||
The development of the ISPV methodology is collected in the internal materials of the directing Commission. Respondents have been obtained with paper instruction manual how to prepare entering data before the data collection. It is available in electronic form too, on the www.ispv.cz, in section “Pro respondenty šetření”. Both publications on ISPV-MZS and ISP include Technical annex, with a basic description of the survey and statistical procedures. The results of the national SES have been presented during a special Press Conference of the Czech Statistical Office every year. The MLSA have published a Press Report on the ISPV-MZS and ISP results via internet. |
|||
| 9.7. Quality management - documentation | |||
Not used |
|||
| 9.7.1. Metadata completeness - rate | |||
Not used |
|||
| 9.7.2. Metadata - consultations | |||
Not used |
|||
|
|||
The original survey (ISPV) has been provided by the Ministry of Labour and Social Affairs as a regular data source. The cost is not estimated. Administrative burden on the respondents is an average time needed for supply of data: 3,0 hours. |
|||
|
|||
Confidential data are not disseminated. |
|||
| 11.1. Confidentiality - policy | |||
Confidential data are not disseminated. |
|||
| 11.2. Confidentiality - data treatment | |||
Confidential data are not disseminated. |
|||
|
|||
Not used |
|||
|
|||
|
|||