|
 |
|
| For any question on data and metadata, please contact: Eurostat user support |
|
|||
| 1.1. Contact organisation | Statistics Austria |
||
| 1.2. Contact organisation unit | Directorate Social Statistics |
||
| 1.5. Contact mail address | STATISTICS AUSTRIA Social Statistics Guglgasse 13 1110 Vienna AUSTRIA |
||
|
|||
| 2.1. Data description | |||
The Austrian Structure of Earnings Survey (SES) has been conducted every four years since 2002.The survey is based on Council Regulation (EC) No 530/1999 concerning structural statistics on earnings and on labour costs and Commission Regulation (EC) No 1738/2005. The survey covers all mandatory variables. Since 2010, the optional variable 'citizenship' has also been available. This quality report refers to the SES for the reference year 2014. It is based on the Commission Regulation (EC) No 698/2006 of 5 May 2006 Implementing Council Regulation (EC) No 530/1999 as regards quality evaluation of structural statistics on labour costs and earnings. |
|||
| 2.2. Classification system | |||
Statistical classification of economic activities in the European Community (NACE Rev. 2), International Standard Classification of Occupations (ISCO-08), International Standard Classification of Education (ISCED11), Nomenclature of Units for Territorial Statistics (NUTS). |
|||
| 2.3. Coverage - sector | |||
Enterprises with at least 10 employees in the sections B to S (excluding O) of NACE Rev. 2. |
|||
| 2.4. Statistical concepts and definitions | |||
The concept and the definitions are set out in the Council Regulation (EC) No 530/1999 of 9 March 1999 concerning structural statistics on earnings and on labour costs, the Commission Regulation (EC) No 1738/2005 of 21 October 2005 amending Regulation (EC) No 1916/2000 as regards the definition and transmission of information on the structure of earnings and the Structure of Earnings Survey 2014 Implementing Arrangements. |
|||
| 2.5. Statistical unit | |||
Enterprises or local units and employees in these units. |
|||
| 2.6. Statistical population | |||
Employees in enterprises with at least 10 employees in the sections B to S (excluding O) of NACE Rev. 2. |
|||
| 2.7. Reference area | |||
Austria. |
|||
| 2.8. Coverage - Time | |||
2014 |
|||
| 2.9. Base period | |||
Not applicable. |
|||
|
|||||||||||||||||||||||||||||||||||||||||||||||||||||||||||||||||||||||||||||||||||||||||||||||||||||||||||||||||||||||||||||||||||||||||||||||||||||||||||||||||||||||||||||||||||||||||||||||||||||
| 3.1. Source data | |||||||||||||||||||||||||||||||||||||||||||||||||||||||||||||||||||||||||||||||||||||||||||||||||||||||||||||||||||||||||||||||||||||||||||||||||||||||||||||||||||||||||||||||||||||||||||||||||||||
The SES 2014 was conducted as a combination of primary and secondary statistics. The use of secondary data meant that the survey could be restricted to those characteristics which cannot be obtained from sources of administrative data. With the exception of the variable "citizenship", optional variables were usually not included in the survey.
Earnings: gross earnings in reference month, earnings related to overtime, special payments for shift work Hours worked: full-time or part-time employee, % share of a full-timer's normal hours, number of hours paid, number of overtime hours paid Workplace-related characteristics: occupation, length of service in the enterprise, type of employment contract, annual days of holiday leave Enterprise-related variables: geographical location of the local unit, principal economic activity of the local unit, form of economic and financial control, collective pay agreement
Business register: geographical location of the enterprise, principal economic activity of the enterprise Social security data: size of the enterprise, sex, age, citizenship Wage tax data: number of weeks, gross annual earnings, annual bonuses and allowances Education register: highest successfully completed level of education |
|||||||||||||||||||||||||||||||||||||||||||||||||||||||||||||||||||||||||||||||||||||||||||||||||||||||||||||||||||||||||||||||||||||||||||||||||||||||||||||||||||||||||||||||||||||||||||||||||||||
| 3.2. Frequency of data collection | |||||||||||||||||||||||||||||||||||||||||||||||||||||||||||||||||||||||||||||||||||||||||||||||||||||||||||||||||||||||||||||||||||||||||||||||||||||||||||||||||||||||||||||||||||||||||||||||||||||
Reference year: 2014. Reference month: October 2014. |
|||||||||||||||||||||||||||||||||||||||||||||||||||||||||||||||||||||||||||||||||||||||||||||||||||||||||||||||||||||||||||||||||||||||||||||||||||||||||||||||||||||||||||||||||||||||||||||||||||||
| 3.3. Data collection | |||||||||||||||||||||||||||||||||||||||||||||||||||||||||||||||||||||||||||||||||||||||||||||||||||||||||||||||||||||||||||||||||||||||||||||||||||||||||||||||||||||||||||||||||||||||||||||||||||||
In Austria, the SES is conducted on the basis of a two-stage random sampling approach of enterprises (first stage) and employees (second stage). The population used for sampling comprises around 43 100 enterprises with at least 10 employees in NACE Rev. 2 sections B-N and P-S and the approximately 2.5 million employees of these enterprises. Some 11 800 enterprises and 216 000 employees were selected for sampling. As a first step, a stratified random sample of enterprises was drawn from the business register. The variables economic activity (NACE Rev. 2), location at level NUTS 1 and size of the enterprise were used as stratification criteria.
Sampling frame: Number of enterprises in the sample by economic activity and size of the enterprise in %
In a second step, a simple random sample of employees was drawn within the selected enterprises. Depending on the size of the enterprise, the corresponding number of employees per enterprise was selected. In order not to over-burden enterprises, the maximum number of selected employees per enterprise was limited to 80.
Selection of employees within the enterprises
Drawing the sample at the level of the local unit was not possible, because at the moment of sampling employees could be unambiguously allocated only at enterprise level. Enterprises with local units in different NACE divisions / NUTS 2 regions were, pursuant to the national implementing regulation[1]), required to allocate the employees selected to the local unit. This affected around 22% of the enterprises. For data transmission, 99% of the enterprises used the web-based questionnaire (eQuest-Web). [1] Order of the Federal Minister for Economic Affairs and Labour on the Structure of Earnings Survey in industry and parts of the service sector (Verdienststrukturstatistik-Verordnung), Federal Law Gazette (BGBl.) II No 66/2007, as amended by BGBl. II No 99/2011 |
|||||||||||||||||||||||||||||||||||||||||||||||||||||||||||||||||||||||||||||||||||||||||||||||||||||||||||||||||||||||||||||||||||||||||||||||||||||||||||||||||||||||||||||||||||||||||||||||||||||
| 3.4. Data validation | |||||||||||||||||||||||||||||||||||||||||||||||||||||||||||||||||||||||||||||||||||||||||||||||||||||||||||||||||||||||||||||||||||||||||||||||||||||||||||||||||||||||||||||||||||||||||||||||||||||
To ensure the quality of statistical results, the already tried and tested web-questionnaire (eQuest-Web) was used for the primary survey. To prevent errors the web-based questionnaire incorporated explanatory notes and plausibility tests on the individual survey parameters. Moreover, integrated classifications allowed the automatic recognition of NACE codes and occupations according to ISCO-08. A hotline was also available to provide information to enterprises. The submitted data were subjected to several layers of plausibility testing at both micro and macro levels for the ex-post identification of any measuring errors. The first step was for the survey data to be examined and corrected at micro level. In a second step the survey data were linked to the secondary data and subjected to another plausibility test. After weighting the data, aggregates were subject to a third plausibility test (macro plausibility). |
|||||||||||||||||||||||||||||||||||||||||||||||||||||||||||||||||||||||||||||||||||||||||||||||||||||||||||||||||||||||||||||||||||||||||||||||||||||||||||||||||||||||||||||||||||||||||||||||||||||
| 3.5. Data compilation | |||||||||||||||||||||||||||||||||||||||||||||||||||||||||||||||||||||||||||||||||||||||||||||||||||||||||||||||||||||||||||||||||||||||||||||||||||||||||||||||||||||||||||||||||||||||||||||||||||||
The following variables were calculated based on primary or administrative data: Gross hourly earnings: gross earnings in the reference month / number of hours paid Length of service in the enterprise: 31 October 2014 - entry date (career breaks exceeding one year have been deducted) Share of a full-timer's normal hours: contractually agreed working time / normal statutory or collectively agreed working time * 100 Number of weeks to which the gross annunal earnings relate: In order to determine the number of weeks to which the gross annual earnings relate, information was available from social security data (date of joining or leaving the enterprise), from wage tax data (reference period) and from survey data (entry date). In 84.8% of cases, all three sources concurred. In case of discrepancies, the number of weeks was determined by comparing the monthly earnings derived from primary data and the monthly earnings calculated from secondary data (gross annual earnings). The figure with the smallest difference was chosen (6.4% social security data, 7.3% wage tax data, 0.5% survey data). In 1.0% of cases the number of weeks was calculated on the basis of gross monthly earnings and gross annual earnings. |
|||||||||||||||||||||||||||||||||||||||||||||||||||||||||||||||||||||||||||||||||||||||||||||||||||||||||||||||||||||||||||||||||||||||||||||||||||||||||||||||||||||||||||||||||||||||||||||||||||||
| 3.6. Adjustment | |||||||||||||||||||||||||||||||||||||||||||||||||||||||||||||||||||||||||||||||||||||||||||||||||||||||||||||||||||||||||||||||||||||||||||||||||||||||||||||||||||||||||||||||||||||||||||||||||||||
[Not requested] |
|||||||||||||||||||||||||||||||||||||||||||||||||||||||||||||||||||||||||||||||||||||||||||||||||||||||||||||||||||||||||||||||||||||||||||||||||||||||||||||||||||||||||||||||||||||||||||||||||||||
|
|||
| 4.1. Quality assurance | |||
Not available. |
|||
| 4.2. Quality management - assessment | |||
[Not requested] |
|||
|
|||
| 5.1. Relevance - User Needs | |||
The results of the SES are used at national level mainly by various federal ministries, employer and employee organisations, universities and other research institutes, the media, enterprises and private individuals. |
|||
| 5.2. Relevance - User Satisfaction | |||
Information about the profile of users or the level of satisfaction with the data provided is not available for Austria. |
|||
| 5.3. Completeness | |||
[Not requested] |
|||
| 5.3.1. Data completeness - rate | |||
[Not requested] |
|||
|
|||||||||||||||||||||||||||||||||||||||||||||||||||||||||||||||||||||||||||||||||||||||||||||||||||||||||||||||||||||||||||||||||||||||||||||||||||||||||||||||||||||||||||||||||||||||||||
In Austria, responding to the SES is a legal requirement. The unit-response rate was 98%. |
|||||||||||||||||||||||||||||||||||||||||||||||||||||||||||||||||||||||||||||||||||||||||||||||||||||||||||||||||||||||||||||||||||||||||||||||||||||||||||||||||||||||||||||||||||||||||||
| 6.1. Accuracy - overall | |||||||||||||||||||||||||||||||||||||||||||||||||||||||||||||||||||||||||||||||||||||||||||||||||||||||||||||||||||||||||||||||||||||||||||||||||||||||||||||||||||||||||||||||||||||||||||
[Not requested] |
|||||||||||||||||||||||||||||||||||||||||||||||||||||||||||||||||||||||||||||||||||||||||||||||||||||||||||||||||||||||||||||||||||||||||||||||||||||||||||||||||||||||||||||||||||||||||||
| 6.2. Sampling error | |||||||||||||||||||||||||||||||||||||||||||||||||||||||||||||||||||||||||||||||||||||||||||||||||||||||||||||||||||||||||||||||||||||||||||||||||||||||||||||||||||||||||||||||||||||||||||
Provisional data. |
|||||||||||||||||||||||||||||||||||||||||||||||||||||||||||||||||||||||||||||||||||||||||||||||||||||||||||||||||||||||||||||||||||||||||||||||||||||||||||||||||||||||||||||||||||||||||||
| 6.2.1. Sampling error - indicators | |||||||||||||||||||||||||||||||||||||||||||||||||||||||||||||||||||||||||||||||||||||||||||||||||||||||||||||||||||||||||||||||||||||||||||||||||||||||||||||||||||||||||||||||||||||||||||
Coefficients of variation in %
|
|||||||||||||||||||||||||||||||||||||||||||||||||||||||||||||||||||||||||||||||||||||||||||||||||||||||||||||||||||||||||||||||||||||||||||||||||||||||||||||||||||||||||||||||||||||||||||
| 6.3. Non-sampling error | |||||||||||||||||||||||||||||||||||||||||||||||||||||||||||||||||||||||||||||||||||||||||||||||||||||||||||||||||||||||||||||||||||||||||||||||||||||||||||||||||||||||||||||||||||||||||||
Over-coverage was found with regard to just 0.7% of the enterprises in the sample. Statistical units in section O (public administration and defence; compulsory social security) were not part of the population, which meant that local units whose higher-level unit was allocated to section O in the business register were not recorded. According to the business register, this led to under-coverage of 8.6% of employees. |
|||||||||||||||||||||||||||||||||||||||||||||||||||||||||||||||||||||||||||||||||||||||||||||||||||||||||||||||||||||||||||||||||||||||||||||||||||||||||||||||||||||||||||||||||||||||||||
| 6.3.1. Coverage error | |||||||||||||||||||||||||||||||||||||||||||||||||||||||||||||||||||||||||||||||||||||||||||||||||||||||||||||||||||||||||||||||||||||||||||||||||||||||||||||||||||||||||||||||||||||||||||
The sample of enterprises is based on the business register. Therefore coverage errors are directly connected to the quality of the register data. In order to achieve a high level of completeness and relevance, Statistics Austria conducts ongoing technical comparisons between the business register and external sources of administrative data (register of companies, tax and social security data etc.). Moreover, information from economic surveys makes a substantial contribution to keeping the business register up to date. |
|||||||||||||||||||||||||||||||||||||||||||||||||||||||||||||||||||||||||||||||||||||||||||||||||||||||||||||||||||||||||||||||||||||||||||||||||||||||||||||||||||||||||||||||||||||||||||
| 6.3.1.1. Over-coverage - rate | |||||||||||||||||||||||||||||||||||||||||||||||||||||||||||||||||||||||||||||||||||||||||||||||||||||||||||||||||||||||||||||||||||||||||||||||||||||||||||||||||||||||||||||||||||||||||||
Over-coverage was found with regard to 0.7% of the enterprises in the sample. These enterprises were no longer active at the time of the survey and thus did not respond (see also point 6.3.3. Non-response errors). Statistical units in section O (public administration and defence; compulsory social security) were not part of the population, which meant that local units whose higher-level unit was allocated to section O in the business register were not recorded. According to the business register, this led to under-coverage of 8.6% of employees. According to the employee estimation model in the business register[1] the under-coverage relates to the service sector mainly, in particular to education (section P -52%) and to parts of public health and social services (section Q -26%). In the education sector, it is mainly employees in public schools and childcare facilities who are not covered[2]. In health and social work the same applies to some part of employees in public homes and hospitals. Smaller economic sectors were also affected. In the area of "arts, entertainments and recreation" (section R -20%), employees of public libraries, archives, museums and swimming baths are missing. In industry, municipal employees in section E "water supply and waste disposal" (-18%) were not recorded. This can lead to either an over-estimation or under-estimation of earnings in these sectors.
[1] Employees are allocated to a local unit on the basis of an allocation key. This allocation key is based on an estimation model according to which the employees of the enterprise are allocated to the local units. [2] Section P "education" includes private and faith-based childcare establishments and schools, all universities and colleges, driving schools and the adult education sector. |
|||||||||||||||||||||||||||||||||||||||||||||||||||||||||||||||||||||||||||||||||||||||||||||||||||||||||||||||||||||||||||||||||||||||||||||||||||||||||||||||||||||||||||||||||||||||||||
| 6.3.1.2. Common units - proportion | |||||||||||||||||||||||||||||||||||||||||||||||||||||||||||||||||||||||||||||||||||||||||||||||||||||||||||||||||||||||||||||||||||||||||||||||||||||||||||||||||||||||||||||||||||||||||||
[Not requested] |
|||||||||||||||||||||||||||||||||||||||||||||||||||||||||||||||||||||||||||||||||||||||||||||||||||||||||||||||||||||||||||||||||||||||||||||||||||||||||||||||||||||||||||||||||||||||||||
| 6.3.2. Measurement error | |||||||||||||||||||||||||||||||||||||||||||||||||||||||||||||||||||||||||||||||||||||||||||||||||||||||||||||||||||||||||||||||||||||||||||||||||||||||||||||||||||||||||||||||||||||||||||
To prevent measuring errors, the already tried and tested web-based questionnaire was used for the primary survey. The submitted data were subjected to several layers of plausibility testing at both micro and macro levels for the ex-post identification of any measuring errors (see point 3.4. Data validation). The secondary data were, in general, of very high quality. The business register is being continually improved in order to make it more comprehensive and up-to-date (see point 6.3.1. Coverage error). The social security data come from monthly notifications to the social security institutions, meaning that employment relationships can be recorded precisely to the day. Tests are carried out upstream in the Statistics Austria database system to ensure the good quality of these data. For wage tax, data from the Austrian wage tax statistics were used which had already been verified by the tax statistics department of Statistics Austria. In this way, optimum data quality could be ensured in the calculation of gross annual earnings and annual bonuses and allowances. The data from the education register are based on data from the 2001 census, which are constantly updated and supplemented according to the information sent by schools, universities and other educational establishments. The ongoing qualification of employees from other countries can be taken into account only if the training was completed in Austria, the qualification is officially recognised, the Public Employment Service Austria (AMS) provides the information or if an academic degree is entered in the Central Register of Residents (ZMR) (see point 6.3.3.2. Item non-response). |
|||||||||||||||||||||||||||||||||||||||||||||||||||||||||||||||||||||||||||||||||||||||||||||||||||||||||||||||||||||||||||||||||||||||||||||||||||||||||||||||||||||||||||||||||||||||||||
| 6.3.3. Non response error | |||||||||||||||||||||||||||||||||||||||||||||||||||||||||||||||||||||||||||||||||||||||||||||||||||||||||||||||||||||||||||||||||||||||||||||||||||||||||||||||||||||||||||||||||||||||||||
Enterprises are legally obligated to provide information [1]. In addition, the following measures were taken to limit non response: firstly, reminder letters to enterprises that did not reply by the response deadline; then dunning letters sent to those enterprises that had not replied to the reminder letter; thirdly, reminder telephone calls and, fourthly, reports to the authorities for suspected failure to comply with information obligations (see also point 7.2. Punctuality).
[1] Regulation of the Federal Minister for Economic Affairs and Labour on the Structure of Earnings Survey in industry and parts of the service sector (Verdienststrukturstatistik-Verordnung), Federal Law Gazette (BGBl.) II No 66/2007, as amended by BGBl. II No 99/2011 |
|||||||||||||||||||||||||||||||||||||||||||||||||||||||||||||||||||||||||||||||||||||||||||||||||||||||||||||||||||||||||||||||||||||||||||||||||||||||||||||||||||||||||||||||||||||||||||
| 6.3.3.1. Unit non-response - rate | |||||||||||||||||||||||||||||||||||||||||||||||||||||||||||||||||||||||||||||||||||||||||||||||||||||||||||||||||||||||||||||||||||||||||||||||||||||||||||||||||||||||||||||||||||||||||||
The overall unit response rate was 98.3%. The unit non-response rate of 1.7% (199 enterprises) can be broken down further into 0.7% over-coverage (see point 6.3.1. Coverage errors) and 1.0% refusals.
Unit-Response rate
|
|||||||||||||||||||||||||||||||||||||||||||||||||||||||||||||||||||||||||||||||||||||||||||||||||||||||||||||||||||||||||||||||||||||||||||||||||||||||||||||||||||||||||||||||||||||||||||
| 6.3.3.2. Item non-response - rate | |||||||||||||||||||||||||||||||||||||||||||||||||||||||||||||||||||||||||||||||||||||||||||||||||||||||||||||||||||||||||||||||||||||||||||||||||||||||||||||||||||||||||||||||||||||||||||
See point 6.3.4.1. Imputation. |
|||||||||||||||||||||||||||||||||||||||||||||||||||||||||||||||||||||||||||||||||||||||||||||||||||||||||||||||||||||||||||||||||||||||||||||||||||||||||||||||||||||||||||||||||||||||||||
| 6.3.4. Processing error | |||||||||||||||||||||||||||||||||||||||||||||||||||||||||||||||||||||||||||||||||||||||||||||||||||||||||||||||||||||||||||||||||||||||||||||||||||||||||||||||||||||||||||||||||||||||||||
Due to the complete changeover to a web-based questionnaire, that incorporates plausibility tests on the individual characteristics, it was possible to reduce the item non-response of the survey data. On the other hand, administrative data showed a slight increase of missing values. |
|||||||||||||||||||||||||||||||||||||||||||||||||||||||||||||||||||||||||||||||||||||||||||||||||||||||||||||||||||||||||||||||||||||||||||||||||||||||||||||||||||||||||||||||||||||||||||
| 6.3.4.1. Imputation - rate | |||||||||||||||||||||||||||||||||||||||||||||||||||||||||||||||||||||||||||||||||||||||||||||||||||||||||||||||||||||||||||||||||||||||||||||||||||||||||||||||||||||||||||||||||||||||||||
Missing information about the variable 'length of service in the enterprise' was calculated on the basis of information from social security data on the date of joining or leaving the enterprise. Information on the variable 'type of employment contract' was also completed with the aid of social security data. For the variable 'annual days of holiday leave', the statutory holiday entitlement was imputed, taking into account age and length of service.
Item imputation rate (survey data)
Wage tax data that could not be linked by the personal ID were matched using the enterprise ID and the variables age and sex. Thus, 2.1% could be clearly assigned by statistical matching. The remaining gaps in administrative data were completed using different imputation procedures. The variables 'gross annual earnings' and 'annual bonuses and allowances' were imputed using regression analysis. The basis of the calculation was the information on gross monthly earnings from the survey in combination with information on the date of joining or leaving the enterprise. Missing information on the 'highest completed level of education' was imputed based on a multinomial regression, using the predictors sex, gross hourly earnings, age-classes, occupation and citizenship (Austrian, EU-15 and other).
Item imputation rate (administrative data)
Information on education was missing for 0.7% of employees with Austrian citizenship and 46.4% of employees with other citizenship. This is because the education register receives ongoing notifications only from educational institutions in Austria. The ongoing qualification of employees from other countries can be taken into account only if the training was completed in Austria, the qualification is officially recognised, the Public Employment Service Austria (AMS) provides the information or if an academic degree is entered in the Central Register of Residents (ZMR) (see point 6.3.2. Measurement error). The value of the variable 'highest completed level of education' is therefore significantly restricted for non-Austrians. This means that the earnings of employees who are not Austrian, broken down by level of education, could be either over- or under-recorded. |
|||||||||||||||||||||||||||||||||||||||||||||||||||||||||||||||||||||||||||||||||||||||||||||||||||||||||||||||||||||||||||||||||||||||||||||||||||||||||||||||||||||||||||||||||||||||||||
| 6.3.5. Model assumption error | |||||||||||||||||||||||||||||||||||||||||||||||||||||||||||||||||||||||||||||||||||||||||||||||||||||||||||||||||||||||||||||||||||||||||||||||||||||||||||||||||||||||||||||||||||||||||||
To correct for unit non-response the net sample was adjusted to the population given by the selection framework. The weighting of the data, like the sampling, took place in several steps. The first step was to reproduce the sample design, by giving each enterprise the base weight of the sampled unit Wk, representing the reciprocal selection probability in the stratum h (Wk=Nh/nh). Using the total number of employees per enterprise as a basis, a sample weight was also calculated for each employee in the sample. Using the base weight Wk of the enterprise k, the number of employees Bk of this enterprise and the number of employees bk of the enterprise k in the sample, the base weight Wbhk was calculated for each employee in the sample unit. Wbhk= Wk*Bk/bk Based on the allocation of employees to local units by enterprises, a breakdown by economic activity and region at the level of the local unit could be conducted within the meaning of the European legal basis. For the weighting of the local units summarised as aggregates, it was necessary, in a next step, to calibrate the weights such that the sum of the weights of each NUTS 1 region cross-referenced with NACE sections matched the corresponding population. Then, the second step of the weighting was to modify the basic weighting Wbhk, which initially was allocated to each aggregate, so that the sum of the weights of these units corresponded both with the corresponding figures from the population in the cross-referencing of the NACE sections and NUTS 1 region and the sum of all male and female employees in the population.[1]
[1] Weighting by gender has been carried out since 2006, as the Structure of Earnings Survey has been used as the source for calculating the gender pay gap throughout the EU. |
|||||||||||||||||||||||||||||||||||||||||||||||||||||||||||||||||||||||||||||||||||||||||||||||||||||||||||||||||||||||||||||||||||||||||||||||||||||||||||||||||||||||||||||||||||||||||||
| 6.4. Seasonal adjustment | |||||||||||||||||||||||||||||||||||||||||||||||||||||||||||||||||||||||||||||||||||||||||||||||||||||||||||||||||||||||||||||||||||||||||||||||||||||||||||||||||||||||||||||||||||||||||||
[Not requested] |
|||||||||||||||||||||||||||||||||||||||||||||||||||||||||||||||||||||||||||||||||||||||||||||||||||||||||||||||||||||||||||||||||||||||||||||||||||||||||||||||||||||||||||||||||||||||||||
| 6.5. Data revision - policy | |||||||||||||||||||||||||||||||||||||||||||||||||||||||||||||||||||||||||||||||||||||||||||||||||||||||||||||||||||||||||||||||||||||||||||||||||||||||||||||||||||||||||||||||||||||||||||
[Not requested] |
|||||||||||||||||||||||||||||||||||||||||||||||||||||||||||||||||||||||||||||||||||||||||||||||||||||||||||||||||||||||||||||||||||||||||||||||||||||||||||||||||||||||||||||||||||||||||||
| 6.6. Data revision - practice | |||||||||||||||||||||||||||||||||||||||||||||||||||||||||||||||||||||||||||||||||||||||||||||||||||||||||||||||||||||||||||||||||||||||||||||||||||||||||||||||||||||||||||||||||||||||||||
[Not requested] |
|||||||||||||||||||||||||||||||||||||||||||||||||||||||||||||||||||||||||||||||||||||||||||||||||||||||||||||||||||||||||||||||||||||||||||||||||||||||||||||||||||||||||||||||||||||||||||
| 6.6.1. Data revision - average size | |||||||||||||||||||||||||||||||||||||||||||||||||||||||||||||||||||||||||||||||||||||||||||||||||||||||||||||||||||||||||||||||||||||||||||||||||||||||||||||||||||||||||||||||||||||||||||
[Not requested] |
|||||||||||||||||||||||||||||||||||||||||||||||||||||||||||||||||||||||||||||||||||||||||||||||||||||||||||||||||||||||||||||||||||||||||||||||||||||||||||||||||||||||||||||||||||||||||||
|
||||||||||||||||||||||||||||||||
| 7.1. Timeliness | ||||||||||||||||||||||||||||||||
The final data were delivered to Eurostat on 29 June 2016 (t+18). In order to keep the period of time between the reference period and the publication of data at national level as short as possible, first results were presented in press conference and a press release on 28 July 2016. |
||||||||||||||||||||||||||||||||
| 7.1.1. Time lag - first result | ||||||||||||||||||||||||||||||||
[Not requested] |
||||||||||||||||||||||||||||||||
| 7.1.2. Time lag - final result | ||||||||||||||||||||||||||||||||
[Not requested] |
||||||||||||||||||||||||||||||||
| 7.2. Punctuality | ||||||||||||||||||||||||||||||||
Overview of the data collection process
|
||||||||||||||||||||||||||||||||
| 7.2.1. Punctuality - delivery and publication | ||||||||||||||||||||||||||||||||
[Not requested] |
||||||||||||||||||||||||||||||||
|
|||||||||||||||||||||||||||||||||||||||||||||||||||||||||||||||||||||||||||||||||||||||||||||||||||||||||||||||||||||||||||||||||||||||||
| 8.1. Comparability - geographical | |||||||||||||||||||||||||||||||||||||||||||||||||||||||||||||||||||||||||||||||||||||||||||||||||||||||||||||||||||||||||||||||||||||||||
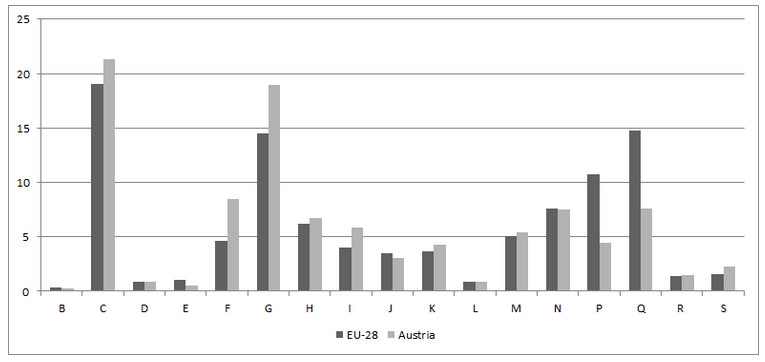
The comparability of the results between Member States is restricted because of under-coverage in NACE Rev. 2 sections P, Q, R and E (see point 6.3.1. Coverage error). Statistical units in section O were not part of the population, which meant that local units whose superordinate enterprise was allocated to section O in the business register were not recorded. The proportion of employees in those economic sectors (except R) was therefore much lower in Austria than the EU average. The exclusion of section O from the survey population also affects the results for certain professional groups such as teaching professionals (ISCO 23), health professionals (ISCO 22), health associate professionals (ISCO 32) and personal care workers (ISCO 53).
Proportion of employees by economic activity in %
Q: Eurostat. Not including Greece and Croatia. Enquiry of 28 November 2016. |
|||||||||||||||||||||||||||||||||||||||||||||||||||||||||||||||||||||||||||||||||||||||||||||||||||||||||||||||||||||||||||||||||||||||||
| 8.1.1. Asymmetry for mirror flow statistics - coefficient | |||||||||||||||||||||||||||||||||||||||||||||||||||||||||||||||||||||||||||||||||||||||||||||||||||||||||||||||||||||||||||||||||||||||||
[Not requested] |
|||||||||||||||||||||||||||||||||||||||||||||||||||||||||||||||||||||||||||||||||||||||||||||||||||||||||||||||||||||||||||||||||||||||||
| 8.2. Comparability - over time | |||||||||||||||||||||||||||||||||||||||||||||||||||||||||||||||||||||||||||||||||||||||||||||||||||||||||||||||||||||||||||||||||||||||||
The changes to the definitions between the 2002, 2006, 2010 and 2014 surveys are mainly the result of amendments to legal acts and classifications (NACE, ISCO, ISCED). Pursuant to Article 3 of Regulation (EC) No 530/1999, the inclusion of sections M – O of NACE Rev. 1 was optional for the SES 2002. Furthermore, a derogation from Article 6 has been in force for Austria in 2002, whereby the statistical unit could relate to the enterprise rather than to the local unit. Coverage
Statistical units
Weighting
Classifications
|
|||||||||||||||||||||||||||||||||||||||||||||||||||||||||||||||||||||||||||||||||||||||||||||||||||||||||||||||||||||||||||||||||||||||||
| 8.2.1. Length of comparable time series | |||||||||||||||||||||||||||||||||||||||||||||||||||||||||||||||||||||||||||||||||||||||||||||||||||||||||||||||||||||||||||||||||||||||||
[Not requested] |
|||||||||||||||||||||||||||||||||||||||||||||||||||||||||||||||||||||||||||||||||||||||||||||||||||||||||||||||||||||||||||||||||||||||||
| 8.3. Coherence - cross domain | |||||||||||||||||||||||||||||||||||||||||||||||||||||||||||||||||||||||||||||||||||||||||||||||||||||||||||||||||||||||||||||||||||||||||
[Not requested] |
|||||||||||||||||||||||||||||||||||||||||||||||||||||||||||||||||||||||||||||||||||||||||||||||||||||||||||||||||||||||||||||||||||||||||
| 8.4. Coherence - sub annual and annual statistics | |||||||||||||||||||||||||||||||||||||||||||||||||||||||||||||||||||||||||||||||||||||||||||||||||||||||||||||||||||||||||||||||||||||||||
[Not requested] |
|||||||||||||||||||||||||||||||||||||||||||||||||||||||||||||||||||||||||||||||||||||||||||||||||||||||||||||||||||||||||||||||||||||||||
| 8.5. Coherence - National Accounts | |||||||||||||||||||||||||||||||||||||||||||||||||||||||||||||||||||||||||||||||||||||||||||||||||||||||||||||||||||||||||||||||||||||||||
The characteristics 'wages and salaries' per employee in the National Accounts and 'gross annual earnings' in the SES are comparable only with certain caveats. Such comparisons lead to a discrepancy of -4%. The main reasons for this discrepancy are:
Comparison of wages and salaries per employee in National Accounts and gross annual earnings in the SES
|
|||||||||||||||||||||||||||||||||||||||||||||||||||||||||||||||||||||||||||||||||||||||||||||||||||||||||||||||||||||||||||||||||||||||||
| 8.6. Coherence - internal | |||||||||||||||||||||||||||||||||||||||||||||||||||||||||||||||||||||||||||||||||||||||||||||||||||||||||||||||||||||||||||||||||||||||||
[Not requested] |
|||||||||||||||||||||||||||||||||||||||||||||||||||||||||||||||||||||||||||||||||||||||||||||||||||||||||||||||||||||||||||||||||||||||||
|
|||
| 9.1. Dissemination format - News release | |||
The most important results were presented in the form of a press conference and a press release (English version). |
|||
| 9.2. Dissemination format - Publications | |||
Internet An overview of the key findings (text and tables in HTML, PDF and Excel formats) can be found on the website of Statistics Austria (English version). Statistische Nachrichten The main results of the Structure of Earnings Survey 2014 were published in volume 10/2016 of 'Statistische Nachrichten' (English summary). Printed publications Detailed results and tables will be presented in the publication entitled 'Verdienststrukturerhebung 2014 – Struktur und Verteilung der Verdienste in Österreich' (Print version, including CD ROM with tables in Excel format; free PDF file available from our website). Statistical Yearbook Selected results are published in the Statistical Yearbook in the chapters 'Income; earnings" and 'Employment and the labour market' (print version, including CD ROM with tables in Excel format). |
|||
| 9.3. Dissemination format - online database | |||
STATCUBE database The data can also be found on the Statistics Austria website under Publications & Services, STATcube– Statistical Database |
|||
| 9.3.1. Data tables - consultations | |||
[Not requested] |
|||
| 9.4. Dissemination format - microdata access | |||
[Not requested] |
|||
| 9.5. Dissemination format - other | |||
Not available |
|||
| 9.6. Documentation on methodology | |||
Metadata Meta data (definitions, explanations, methods, quality) can be found on the website of Statistics Austria (German version). |
|||
| 9.7. Quality management - documentation | |||
[Not requested] |
|||
| 9.7.1. Metadata completeness - rate | |||
[Not requested] |
|||
| 9.7.2. Metadata - consultations | |||
[Not requested] |
|||
|
|||
[Not requested] |
|||
|
|||
| 11.1. Confidentiality - policy | |||
[Not requested] |
|||
| 11.2. Confidentiality - data treatment | |||
[Not requested] |
|||
|
|||
Annex: Plausibility of variables Annexes: Plausibility of variables |
|||
|
|||
|
|||