|
 |
|
| For any question on data and metadata, please contact: Eurostat user support |
|
|||
| 1.1. Contact organisation | Statistical Office of the Republic of Slovenia |
||
| 1.2. Contact organisation unit | Labour Market Department |
||
| 1.5. Contact mail address | Litostrojska 54, 1000 Ljubljana |
||
|
|||
| 2.1. Data description | |||
List of abbreviations: |
|||
| 2.2. Classification system | |||
Not available. |
|||
| 2.3. Coverage - sector | |||
Not available. |
|||
| 2.4. Statistical concepts and definitions | |||
Not available. |
|||
| 2.5. Statistical unit | |||
Not available. |
|||
| 2.6. Statistical population | |||
Not available. |
|||
| 2.7. Reference area | |||
Not available. |
|||
| 2.8. Coverage - Time | |||
Not available. |
|||
| 2.9. Base period | |||
Not available. |
|||
|
||||||||||||||||||||||||||||||||||||||||||||||||||||||||||||||||||||||||||||||||||||||||||||||||||||||||||||||||||||||||||||||||||||||||||||||||||||||||||||||||
| 3.1. Source data | ||||||||||||||||||||||||||||||||||||||||||||||||||||||||||||||||||||||||||||||||||||||||||||||||||||||||||||||||||||||||||||||||||||||||||||||||||||||||||||||||
For SES 2010 the data collection stage was done by the Agency of the Republic of Slovenia for Public Legal Records and Related Services (AJPES), which collected the data with a special electronic questionnaire. Changed sampling plan in 2006 (to randomly select only business entities (or their units) and observe all employees in these business entities) was performed also for SES 2010.
Sampling frame As a basis for creating the sampling frame, data from SRDAP and PRS were used to which data from two statistical surveys – Monthly Report on Earnings Paid by Legal Persons and Monthly Report on Earnings Paid by Registered Natural Persons – and statuses from other statistical surveys were added. In this case data from the above mentioned surveys were used only as auxiliary data in determining large units that will be sampled with certainty. In the final sampling frame 74,124 units were included. Size classes were determined on the basis of the data on the number of employees (source: SRDAP) as well as data on labour costs (source: final accounts estimated at the level of local units). Large business entities were those with 250 and more employees or with labour costs exceeding EUR 450,000. Other business entities were divided into three size classes: medium-sized (from 50 to 249 employees), small (from 10 to 49 employees) and micro (with fewer than 10 employees). As the second and third stratification variables activity (by the Standard Classification of Activities 2008 (NACE Rev. 2)) and cohesion regions were used.
Sample The final sample size for the SES 2010 was 3,086 business entities or their units. Reporting units had to report data for all employees in the business entity or unit selected in the sample. In the distribution of sample units by strata, optimum allocation by the number of employees was used, while in those strata where the calculation by optimum allocation yielded fewer than 8 units 8 units were sampled, i.e. if there were fewer than 8 units in the stratum, all units were sampled. Systematic sample selection was applied, sorting the units within each stratum by five-digit Standard Classification of Activities 2008 (NACE Rev. 2) codes and thus ensuring implicit stratification at the lowest level of activity. Because in the case of the selected sampling plan it cannot be controlled for how many employees the unit will report data, it was decided to include control in the software application for reporting. If the business entities reported data for too low number of employees (according to data from SRDAP), the person reporting the data was warned.
Please see also the attached document Number of units and employees in the frame and sample.
Collection of the data was combination of existing sources, mainly from SRDAP, and questionnaire (Annex Questionnaire). The source for each variable is described in the table below.
Annexes: Number of units and employees in the frame and sample Annex Questionnaire |
||||||||||||||||||||||||||||||||||||||||||||||||||||||||||||||||||||||||||||||||||||||||||||||||||||||||||||||||||||||||||||||||||||||||||||||||||||||||||||||||
| 3.2. Frequency of data collection | ||||||||||||||||||||||||||||||||||||||||||||||||||||||||||||||||||||||||||||||||||||||||||||||||||||||||||||||||||||||||||||||||||||||||||||||||||||||||||||||||
[Not requested] |
||||||||||||||||||||||||||||||||||||||||||||||||||||||||||||||||||||||||||||||||||||||||||||||||||||||||||||||||||||||||||||||||||||||||||||||||||||||||||||||||
| 3.3. Data collection | ||||||||||||||||||||||||||||||||||||||||||||||||||||||||||||||||||||||||||||||||||||||||||||||||||||||||||||||||||||||||||||||||||||||||||||||||||||||||||||||||
[Not requested] |
||||||||||||||||||||||||||||||||||||||||||||||||||||||||||||||||||||||||||||||||||||||||||||||||||||||||||||||||||||||||||||||||||||||||||||||||||||||||||||||||
| 3.4. Data validation | ||||||||||||||||||||||||||||||||||||||||||||||||||||||||||||||||||||||||||||||||||||||||||||||||||||||||||||||||||||||||||||||||||||||||||||||||||||||||||||||||
[Not requested] |
||||||||||||||||||||||||||||||||||||||||||||||||||||||||||||||||||||||||||||||||||||||||||||||||||||||||||||||||||||||||||||||||||||||||||||||||||||||||||||||||
| 3.5. Data compilation | ||||||||||||||||||||||||||||||||||||||||||||||||||||||||||||||||||||||||||||||||||||||||||||||||||||||||||||||||||||||||||||||||||||||||||||||||||||||||||||||||
[Not requested] |
||||||||||||||||||||||||||||||||||||||||||||||||||||||||||||||||||||||||||||||||||||||||||||||||||||||||||||||||||||||||||||||||||||||||||||||||||||||||||||||||
| 3.6. Adjustment | ||||||||||||||||||||||||||||||||||||||||||||||||||||||||||||||||||||||||||||||||||||||||||||||||||||||||||||||||||||||||||||||||||||||||||||||||||||||||||||||||
[Not requested] |
||||||||||||||||||||||||||||||||||||||||||||||||||||||||||||||||||||||||||||||||||||||||||||||||||||||||||||||||||||||||||||||||||||||||||||||||||||||||||||||||
|
|||
| 4.1. Quality assurance | |||
Not available. |
|||
| 4.2. Quality management - assessment | |||
[Not requested] |
|||
|
|||
| 5.1. Relevance - User Needs | |||
The main users of Structure of Earnings Survey 2010 (SES 2010) results are the Institute of Macroeconomic Analyses and Development, Office for Equal Opportunities, the Bank of Slovenia, the Ministry of Labour, Family and Social Affairs, the Ministry of Finance, the Chamber of Commerce and Industry, the Employers' Association of Slovenia and trade unions. Important users are also units within the Statistical Office of the Republic of Slovenia (SURS). Other users of survey results are various research institutes, domestic and foreign companies, students and the media. Data published in the First Release are also sent to all users of data collected with the statistical survey Monthly Report on Earnings Paid by Legal Persons1. The most important national users are the Ministry of Labour, Family and Social Affairs (The International Cooperation and European Affairs Service), the Institute of Macroeconomic Analyses and Development and the Employers' Association of Slovenia. Major foreign users of survey data are Eurostat, the European Central Bank, the International Monetary Fund and the International Labour Organisation. SES data also represent basis for many researchers dealing with earnings statistics.
1 Official data on earnings in Slovenia. |
|||
| 5.2. Relevance - User Satisfaction | |||
Structural data on earnings, including most wanted Gender Pay Gap, are one of the top data on earnings which are interesting not just for experts but also for general public. In general users are satisfied with data offered but as in 2006 also in 2010 two main weaknesses were mentioned; information on structure of earnings should be available more often than every four years (problem is solved by annual estimations, especially with annual Gender Pay Gap) and data availability which is almost one and half year after the reference period (for domestic users) or almost two years (for international comparison). |
|||
| 5.3. Completeness | |||
[Not requested] |
|||
| 5.3.1. Data completeness - rate | |||
[Not requested] |
|||
|
||||||||||||||||||||||||||||||||||||||||||||||||||||||||||||||||||||||||||||||||||||||||||||||||||||||||||||||||||||||||||||||||||||||||||||||||||||||||||||||||||||||||||||||||||||||||||||||||||||||||||||||||||||||||||||||||||||||||||||||||||||||||||||||||||||||||||||||||||||||||||||||||||||
- |
||||||||||||||||||||||||||||||||||||||||||||||||||||||||||||||||||||||||||||||||||||||||||||||||||||||||||||||||||||||||||||||||||||||||||||||||||||||||||||||||||||||||||||||||||||||||||||||||||||||||||||||||||||||||||||||||||||||||||||||||||||||||||||||||||||||||||||||||||||||||||||||||||||
| 6.1. Accuracy - overall | ||||||||||||||||||||||||||||||||||||||||||||||||||||||||||||||||||||||||||||||||||||||||||||||||||||||||||||||||||||||||||||||||||||||||||||||||||||||||||||||||||||||||||||||||||||||||||||||||||||||||||||||||||||||||||||||||||||||||||||||||||||||||||||||||||||||||||||||||||||||||||||||||||||
[Not requested] |
||||||||||||||||||||||||||||||||||||||||||||||||||||||||||||||||||||||||||||||||||||||||||||||||||||||||||||||||||||||||||||||||||||||||||||||||||||||||||||||||||||||||||||||||||||||||||||||||||||||||||||||||||||||||||||||||||||||||||||||||||||||||||||||||||||||||||||||||||||||||||||||||||||
| 6.2. Sampling error | ||||||||||||||||||||||||||||||||||||||||||||||||||||||||||||||||||||||||||||||||||||||||||||||||||||||||||||||||||||||||||||||||||||||||||||||||||||||||||||||||||||||||||||||||||||||||||||||||||||||||||||||||||||||||||||||||||||||||||||||||||||||||||||||||||||||||||||||||||||||||||||||||||||
see 6.2.1 |
||||||||||||||||||||||||||||||||||||||||||||||||||||||||||||||||||||||||||||||||||||||||||||||||||||||||||||||||||||||||||||||||||||||||||||||||||||||||||||||||||||||||||||||||||||||||||||||||||||||||||||||||||||||||||||||||||||||||||||||||||||||||||||||||||||||||||||||||||||||||||||||||||||
| 6.2.1. Sampling error - indicators | ||||||||||||||||||||||||||||||||||||||||||||||||||||||||||||||||||||||||||||||||||||||||||||||||||||||||||||||||||||||||||||||||||||||||||||||||||||||||||||||||||||||||||||||||||||||||||||||||||||||||||||||||||||||||||||||||||||||||||||||||||||||||||||||||||||||||||||||||||||||||||||||||||||
In the attached document Coefficients of variations are shown in percentage for variables 4.2 (Gross earnings in the reference month) and 4.3 (Average gross hourly earnings in the reference month) for different individual breakdowns. Annexes: Coefficients of variation |
||||||||||||||||||||||||||||||||||||||||||||||||||||||||||||||||||||||||||||||||||||||||||||||||||||||||||||||||||||||||||||||||||||||||||||||||||||||||||||||||||||||||||||||||||||||||||||||||||||||||||||||||||||||||||||||||||||||||||||||||||||||||||||||||||||||||||||||||||||||||||||||||||||
| 6.3. Non-sampling error | ||||||||||||||||||||||||||||||||||||||||||||||||||||||||||||||||||||||||||||||||||||||||||||||||||||||||||||||||||||||||||||||||||||||||||||||||||||||||||||||||||||||||||||||||||||||||||||||||||||||||||||||||||||||||||||||||||||||||||||||||||||||||||||||||||||||||||||||||||||||||||||||||||||
See 6.3.1. - 6.4. |
||||||||||||||||||||||||||||||||||||||||||||||||||||||||||||||||||||||||||||||||||||||||||||||||||||||||||||||||||||||||||||||||||||||||||||||||||||||||||||||||||||||||||||||||||||||||||||||||||||||||||||||||||||||||||||||||||||||||||||||||||||||||||||||||||||||||||||||||||||||||||||||||||||
| 6.3.1. Coverage error | ||||||||||||||||||||||||||||||||||||||||||||||||||||||||||||||||||||||||||||||||||||||||||||||||||||||||||||||||||||||||||||||||||||||||||||||||||||||||||||||||||||||||||||||||||||||||||||||||||||||||||||||||||||||||||||||||||||||||||||||||||||||||||||||||||||||||||||||||||||||||||||||||||||
See 6.3.1.1. |
||||||||||||||||||||||||||||||||||||||||||||||||||||||||||||||||||||||||||||||||||||||||||||||||||||||||||||||||||||||||||||||||||||||||||||||||||||||||||||||||||||||||||||||||||||||||||||||||||||||||||||||||||||||||||||||||||||||||||||||||||||||||||||||||||||||||||||||||||||||||||||||||||||
| 6.3.1.1. Over-coverage - rate | ||||||||||||||||||||||||||||||||||||||||||||||||||||||||||||||||||||||||||||||||||||||||||||||||||||||||||||||||||||||||||||||||||||||||||||||||||||||||||||||||||||||||||||||||||||||||||||||||||||||||||||||||||||||||||||||||||||||||||||||||||||||||||||||||||||||||||||||||||||||||||||||||||||
There are no difference between the reference and the study population. For national purposes for business entities and employees in activities A and S data were also collected and published. Moreover also data for business entities with less than 10 employees were included. On total there was 5.5% of over-coverage among business entities and 1.9% among employees (see the table below). Higher over-coverage is because of the increased number of business entities without paid wages mainly because of the crises. There were some responses from units which were not in the sample but they were in the frame. Undercoverage was not detected.
Over-coverage rates by sections of activities
Over-coverage rates by size classes
|
||||||||||||||||||||||||||||||||||||||||||||||||||||||||||||||||||||||||||||||||||||||||||||||||||||||||||||||||||||||||||||||||||||||||||||||||||||||||||||||||||||||||||||||||||||||||||||||||||||||||||||||||||||||||||||||||||||||||||||||||||||||||||||||||||||||||||||||||||||||||||||||||||||
| 6.3.1.2. Common units - proportion | ||||||||||||||||||||||||||||||||||||||||||||||||||||||||||||||||||||||||||||||||||||||||||||||||||||||||||||||||||||||||||||||||||||||||||||||||||||||||||||||||||||||||||||||||||||||||||||||||||||||||||||||||||||||||||||||||||||||||||||||||||||||||||||||||||||||||||||||||||||||||||||||||||||
- |
||||||||||||||||||||||||||||||||||||||||||||||||||||||||||||||||||||||||||||||||||||||||||||||||||||||||||||||||||||||||||||||||||||||||||||||||||||||||||||||||||||||||||||||||||||||||||||||||||||||||||||||||||||||||||||||||||||||||||||||||||||||||||||||||||||||||||||||||||||||||||||||||||||
| 6.3.2. Measurement error | ||||||||||||||||||||||||||||||||||||||||||||||||||||||||||||||||||||||||||||||||||||||||||||||||||||||||||||||||||||||||||||||||||||||||||||||||||||||||||||||||||||||||||||||||||||||||||||||||||||||||||||||||||||||||||||||||||||||||||||||||||||||||||||||||||||||||||||||||||||||||||||||||||||
Data were collected electronically by AJPES. Every question in the questionnaire contains the definition of what must be included in and excluded from the data. Methodology and definitions were published in Official Journal as well as on SORS and AJPES internet sites. First logic control was built in application of data collection where mistakes were hard or soft (colored in red or yellow). Data could not be transferred with hard mistakes. Mistakes are described in the following table. In case of unit non-response reporting units were notified to send the data.
Set of logic test for SES 2010 questionnaire and number of mistakes for each variable from the questionnaire
The highest share of mistakes was in N49 (payments for meals) and N50 (payments for travel between home and work) where most of the employees are entitled for these payments but not all while logic controls was set as obligatory for all employees. Therefore both logic controls were set as soft error, where confirmation of correct data from reporting person was necessary. Also high share of mistakes (21.6 %) was in N51 because of holiday bonus where there is limit set by law. For payments below or equal to the limit just income taxes are paid but above the limit also social security contributions must be paid. Logic control was set on the limit set by law but many companies paid above the limit. All hard mistakes detected through the system of logical controls were corrected by the companies themselves. Where a lot of soft mistakes occurred (e.g. N34) companies were contacted and data were double checked. Variables from existing sources were not controlled, they have their own checking. Data from existing sources were put through code list to check possible miscoding.
1 H – hard mistake; S – soft mistake 2 SN – serial number of the question from the questionnaire |
||||||||||||||||||||||||||||||||||||||||||||||||||||||||||||||||||||||||||||||||||||||||||||||||||||||||||||||||||||||||||||||||||||||||||||||||||||||||||||||||||||||||||||||||||||||||||||||||||||||||||||||||||||||||||||||||||||||||||||||||||||||||||||||||||||||||||||||||||||||||||||||||||||
| 6.3.3. Non response error | ||||||||||||||||||||||||||||||||||||||||||||||||||||||||||||||||||||||||||||||||||||||||||||||||||||||||||||||||||||||||||||||||||||||||||||||||||||||||||||||||||||||||||||||||||||||||||||||||||||||||||||||||||||||||||||||||||||||||||||||||||||||||||||||||||||||||||||||||||||||||||||||||||||
Unit response rate The overall unit response rate was 72.6%. Response rate concerning employees was 79.8%. Response rates by activities are in the table below.
Response rates by section of activities
In the sample key-responders were selected which represent units from which respond is necessary to obtain the sample quality. In case of unit non-response re-weighting was used.
Item response rate For most mandatory variables, including ‘Gross earnings in the reference month (4.2), data were expected while filling in the electronic questionnaire. This variable was not included in the logic control as hard mistake, because it is possible for employee not to have been paid in October. Missing data were checked at the business entities and corrected if necessary. No imputation was performed in case of item non-response. |
||||||||||||||||||||||||||||||||||||||||||||||||||||||||||||||||||||||||||||||||||||||||||||||||||||||||||||||||||||||||||||||||||||||||||||||||||||||||||||||||||||||||||||||||||||||||||||||||||||||||||||||||||||||||||||||||||||||||||||||||||||||||||||||||||||||||||||||||||||||||||||||||||||
| 6.3.3.1. Unit non-response - rate | ||||||||||||||||||||||||||||||||||||||||||||||||||||||||||||||||||||||||||||||||||||||||||||||||||||||||||||||||||||||||||||||||||||||||||||||||||||||||||||||||||||||||||||||||||||||||||||||||||||||||||||||||||||||||||||||||||||||||||||||||||||||||||||||||||||||||||||||||||||||||||||||||||||
[Not requested] |
||||||||||||||||||||||||||||||||||||||||||||||||||||||||||||||||||||||||||||||||||||||||||||||||||||||||||||||||||||||||||||||||||||||||||||||||||||||||||||||||||||||||||||||||||||||||||||||||||||||||||||||||||||||||||||||||||||||||||||||||||||||||||||||||||||||||||||||||||||||||||||||||||||
| 6.3.3.2. Item non-response - rate | ||||||||||||||||||||||||||||||||||||||||||||||||||||||||||||||||||||||||||||||||||||||||||||||||||||||||||||||||||||||||||||||||||||||||||||||||||||||||||||||||||||||||||||||||||||||||||||||||||||||||||||||||||||||||||||||||||||||||||||||||||||||||||||||||||||||||||||||||||||||||||||||||||||
[Not requested] |
||||||||||||||||||||||||||||||||||||||||||||||||||||||||||||||||||||||||||||||||||||||||||||||||||||||||||||||||||||||||||||||||||||||||||||||||||||||||||||||||||||||||||||||||||||||||||||||||||||||||||||||||||||||||||||||||||||||||||||||||||||||||||||||||||||||||||||||||||||||||||||||||||||
| 6.3.4. Processing error | ||||||||||||||||||||||||||||||||||||||||||||||||||||||||||||||||||||||||||||||||||||||||||||||||||||||||||||||||||||||||||||||||||||||||||||||||||||||||||||||||||||||||||||||||||||||||||||||||||||||||||||||||||||||||||||||||||||||||||||||||||||||||||||||||||||||||||||||||||||||||||||||||||||
See 6.3.4.1. |
||||||||||||||||||||||||||||||||||||||||||||||||||||||||||||||||||||||||||||||||||||||||||||||||||||||||||||||||||||||||||||||||||||||||||||||||||||||||||||||||||||||||||||||||||||||||||||||||||||||||||||||||||||||||||||||||||||||||||||||||||||||||||||||||||||||||||||||||||||||||||||||||||||
| 6.3.4.1. Imputation - rate | ||||||||||||||||||||||||||||||||||||||||||||||||||||||||||||||||||||||||||||||||||||||||||||||||||||||||||||||||||||||||||||||||||||||||||||||||||||||||||||||||||||||||||||||||||||||||||||||||||||||||||||||||||||||||||||||||||||||||||||||||||||||||||||||||||||||||||||||||||||||||||||||||||||
Overall imputation rate Most of the mandatory variables (those collected with the questionnaire) were included in the logic control and mostly of them were treated as hard mistakes in case of item non-response. Also the questionnaire could not be delivered if these variables were not filled in correctly. For those variables no imputation were performed, just statistical editing. Overall imputation rate was 0.9%, and including editing 4.8%.
Statistical imputation rate including editing for mandatory variables
|
||||||||||||||||||||||||||||||||||||||||||||||||||||||||||||||||||||||||||||||||||||||||||||||||||||||||||||||||||||||||||||||||||||||||||||||||||||||||||||||||||||||||||||||||||||||||||||||||||||||||||||||||||||||||||||||||||||||||||||||||||||||||||||||||||||||||||||||||||||||||||||||||||||
| 6.3.5. Model assumption error | ||||||||||||||||||||||||||||||||||||||||||||||||||||||||||||||||||||||||||||||||||||||||||||||||||||||||||||||||||||||||||||||||||||||||||||||||||||||||||||||||||||||||||||||||||||||||||||||||||||||||||||||||||||||||||||||||||||||||||||||||||||||||||||||||||||||||||||||||||||||||||||||||||||
No models were used. |
||||||||||||||||||||||||||||||||||||||||||||||||||||||||||||||||||||||||||||||||||||||||||||||||||||||||||||||||||||||||||||||||||||||||||||||||||||||||||||||||||||||||||||||||||||||||||||||||||||||||||||||||||||||||||||||||||||||||||||||||||||||||||||||||||||||||||||||||||||||||||||||||||||
| 6.4. Seasonal adjustment | ||||||||||||||||||||||||||||||||||||||||||||||||||||||||||||||||||||||||||||||||||||||||||||||||||||||||||||||||||||||||||||||||||||||||||||||||||||||||||||||||||||||||||||||||||||||||||||||||||||||||||||||||||||||||||||||||||||||||||||||||||||||||||||||||||||||||||||||||||||||||||||||||||||
[Not requested] |
||||||||||||||||||||||||||||||||||||||||||||||||||||||||||||||||||||||||||||||||||||||||||||||||||||||||||||||||||||||||||||||||||||||||||||||||||||||||||||||||||||||||||||||||||||||||||||||||||||||||||||||||||||||||||||||||||||||||||||||||||||||||||||||||||||||||||||||||||||||||||||||||||||
| 6.5. Data revision - policy | ||||||||||||||||||||||||||||||||||||||||||||||||||||||||||||||||||||||||||||||||||||||||||||||||||||||||||||||||||||||||||||||||||||||||||||||||||||||||||||||||||||||||||||||||||||||||||||||||||||||||||||||||||||||||||||||||||||||||||||||||||||||||||||||||||||||||||||||||||||||||||||||||||||
[Not requested] |
||||||||||||||||||||||||||||||||||||||||||||||||||||||||||||||||||||||||||||||||||||||||||||||||||||||||||||||||||||||||||||||||||||||||||||||||||||||||||||||||||||||||||||||||||||||||||||||||||||||||||||||||||||||||||||||||||||||||||||||||||||||||||||||||||||||||||||||||||||||||||||||||||||
| 6.6. Data revision - practice | ||||||||||||||||||||||||||||||||||||||||||||||||||||||||||||||||||||||||||||||||||||||||||||||||||||||||||||||||||||||||||||||||||||||||||||||||||||||||||||||||||||||||||||||||||||||||||||||||||||||||||||||||||||||||||||||||||||||||||||||||||||||||||||||||||||||||||||||||||||||||||||||||||||
[Not requested] |
||||||||||||||||||||||||||||||||||||||||||||||||||||||||||||||||||||||||||||||||||||||||||||||||||||||||||||||||||||||||||||||||||||||||||||||||||||||||||||||||||||||||||||||||||||||||||||||||||||||||||||||||||||||||||||||||||||||||||||||||||||||||||||||||||||||||||||||||||||||||||||||||||||
| 6.6.1. Data revision - average size | ||||||||||||||||||||||||||||||||||||||||||||||||||||||||||||||||||||||||||||||||||||||||||||||||||||||||||||||||||||||||||||||||||||||||||||||||||||||||||||||||||||||||||||||||||||||||||||||||||||||||||||||||||||||||||||||||||||||||||||||||||||||||||||||||||||||||||||||||||||||||||||||||||||
[Not requested] |
||||||||||||||||||||||||||||||||||||||||||||||||||||||||||||||||||||||||||||||||||||||||||||||||||||||||||||||||||||||||||||||||||||||||||||||||||||||||||||||||||||||||||||||||||||||||||||||||||||||||||||||||||||||||||||||||||||||||||||||||||||||||||||||||||||||||||||||||||||||||||||||||||||
|
|||
| 7.1. Timeliness | |||
Data were published on 29 June 2012 which is 18 months after the reference period as it is stated in the EU regulation. Data were published in Slovenia and sent to Eurostat on the same day. |
|||
| 7.1.1. Time lag - first result | |||
[Not requested] |
|||
| 7.1.2. Time lag - final result | |||
[Not requested] |
|||
| 7.2. Punctuality | |||
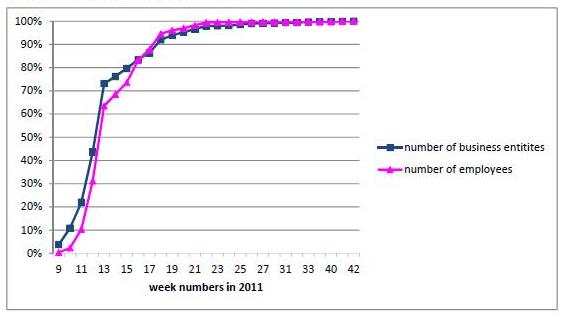
The responding units were notified with a circular letter about being included in the sample, which was sent to them by mail or by post where mail was unknown. The circular letter contained the general information about the survey and obligation by Law of Statistics to fill the questionnaire and for which variables data are already collected from the existing sources. The guidelines and definitions were published on internet sites of SURS and AJPES. The questionnaire was open for filling it in on 1 March 2011. The deadline for filling in the questionnaire was set to 31 march 2011, but the final deadline was then change to 3 May 2011. After the deadline non–responded business entities were notified by mail. In July and August just non-responded key-responders were contacted to send the data. The data collection ended in October 2011. Data delivery is shown in the figure below.
SES 2010 data delivery by weeks (in %)1
From end of October 2011 to February 2012 data were analysed and some double checking with responding units were done. In March 2012 the data were weighted and basic tables were made. Through period from April until June 2012 other tables were produced and checked. First Release was sent out on 29 June 2012 as a provisional data2. First release contained data on hourly, monthly and annual earnings per employee by activities, sex, main occupational and educational groups, age and size classes, including short methodological explanations. On the same day data were put in Eurostat's standard scheme and sent to Eurostat via Edamis.
1 week 9 starts from 28 February 2011 and week 42 ends with 23 October 2011 |
|||
| 7.2.1. Punctuality - delivery and publication | |||
[Not requested] |
|||
|
||||||||||||||||||||||||||||||||||||||||||||||||||||||||||||||||||||||||||||||||||||||||||||||||||||||||||||||||||||||||||||||||||||||||||||||||||||||||||||||||||||||||||||||||||||||||||||||||||||||||||||||||||
| 8.1. Comparability - geographical | ||||||||||||||||||||||||||||||||||||||||||||||||||||||||||||||||||||||||||||||||||||||||||||||||||||||||||||||||||||||||||||||||||||||||||||||||||||||||||||||||||||||||||||||||||||||||||||||||||||||||||||||||||
SES 2010 data were collected in accordance with EU regulations with some exceptions listed below:
|
||||||||||||||||||||||||||||||||||||||||||||||||||||||||||||||||||||||||||||||||||||||||||||||||||||||||||||||||||||||||||||||||||||||||||||||||||||||||||||||||||||||||||||||||||||||||||||||||||||||||||||||||||
| 8.1.1. Asymmetry for mirror flow statistics - coefficient | ||||||||||||||||||||||||||||||||||||||||||||||||||||||||||||||||||||||||||||||||||||||||||||||||||||||||||||||||||||||||||||||||||||||||||||||||||||||||||||||||||||||||||||||||||||||||||||||||||||||||||||||||||
[Not requested] |
||||||||||||||||||||||||||||||||||||||||||||||||||||||||||||||||||||||||||||||||||||||||||||||||||||||||||||||||||||||||||||||||||||||||||||||||||||||||||||||||||||||||||||||||||||||||||||||||||||||||||||||||||
| 8.2. Comparability - over time | ||||||||||||||||||||||||||||||||||||||||||||||||||||||||||||||||||||||||||||||||||||||||||||||||||||||||||||||||||||||||||||||||||||||||||||||||||||||||||||||||||||||||||||||||||||||||||||||||||||||||||||||||||
In comparison with SES 2006, in SES 2010 almost all methods were the same. There were small changes in data collection (wages in kind were added in the questionnaire). |
||||||||||||||||||||||||||||||||||||||||||||||||||||||||||||||||||||||||||||||||||||||||||||||||||||||||||||||||||||||||||||||||||||||||||||||||||||||||||||||||||||||||||||||||||||||||||||||||||||||||||||||||||
| 8.2.1. Length of comparable time series | ||||||||||||||||||||||||||||||||||||||||||||||||||||||||||||||||||||||||||||||||||||||||||||||||||||||||||||||||||||||||||||||||||||||||||||||||||||||||||||||||||||||||||||||||||||||||||||||||||||||||||||||||||
[Not requested] |
||||||||||||||||||||||||||||||||||||||||||||||||||||||||||||||||||||||||||||||||||||||||||||||||||||||||||||||||||||||||||||||||||||||||||||||||||||||||||||||||||||||||||||||||||||||||||||||||||||||||||||||||||
| 8.3. Coherence - cross domain | ||||||||||||||||||||||||||||||||||||||||||||||||||||||||||||||||||||||||||||||||||||||||||||||||||||||||||||||||||||||||||||||||||||||||||||||||||||||||||||||||||||||||||||||||||||||||||||||||||||||||||||||||||
Coherence between gross annual earnings per employee from SES 2010 and wages and salaries per employee from National Accounts
Coherence between number of employees from SES 2010 and from National Accounts
Almost in all activities there are lower average annual wages and salaries per employee in SES compared to NA data because in Slovenia in wages and salaries per employee in NA data also some payments are included which are not parts of wage system (e.g. retirement bonus, jubilee rewards)1. There reasons for the major differences between both surveys in activities are some groups of business entities or employees included in NR but not in SES; unpaid family members in activity A, business entities without employees in activity L and students in activity N8. In other activities with larger difference no special reason were found except in activity S where there was low unit response rate (see 6.3.3 table "Response rates by section of activities").
1 Data on holiday bonus and payments in kind are also not part of wage system in Slovenia but were collected and included in SES 2010 Eurostat tables but excluded for national purposes. In the table above "Coherence between gross annual earnings per employee from SES 2010 and wages and salaries per employee from National Accounts" holiday bonus and payments in kind are included in SES data. 2 See also table above "Coherence between number of employees from SES 2010 and from National Accounts". |
||||||||||||||||||||||||||||||||||||||||||||||||||||||||||||||||||||||||||||||||||||||||||||||||||||||||||||||||||||||||||||||||||||||||||||||||||||||||||||||||||||||||||||||||||||||||||||||||||||||||||||||||||
| 8.4. Coherence - sub annual and annual statistics | ||||||||||||||||||||||||||||||||||||||||||||||||||||||||||||||||||||||||||||||||||||||||||||||||||||||||||||||||||||||||||||||||||||||||||||||||||||||||||||||||||||||||||||||||||||||||||||||||||||||||||||||||||
[Not requested] |
||||||||||||||||||||||||||||||||||||||||||||||||||||||||||||||||||||||||||||||||||||||||||||||||||||||||||||||||||||||||||||||||||||||||||||||||||||||||||||||||||||||||||||||||||||||||||||||||||||||||||||||||||
| 8.5. Coherence - National Accounts | ||||||||||||||||||||||||||||||||||||||||||||||||||||||||||||||||||||||||||||||||||||||||||||||||||||||||||||||||||||||||||||||||||||||||||||||||||||||||||||||||||||||||||||||||||||||||||||||||||||||||||||||||||
[Not requested] |
||||||||||||||||||||||||||||||||||||||||||||||||||||||||||||||||||||||||||||||||||||||||||||||||||||||||||||||||||||||||||||||||||||||||||||||||||||||||||||||||||||||||||||||||||||||||||||||||||||||||||||||||||
| 8.6. Coherence - internal | ||||||||||||||||||||||||||||||||||||||||||||||||||||||||||||||||||||||||||||||||||||||||||||||||||||||||||||||||||||||||||||||||||||||||||||||||||||||||||||||||||||||||||||||||||||||||||||||||||||||||||||||||||
[Not requested] |
||||||||||||||||||||||||||||||||||||||||||||||||||||||||||||||||||||||||||||||||||||||||||||||||||||||||||||||||||||||||||||||||||||||||||||||||||||||||||||||||||||||||||||||||||||||||||||||||||||||||||||||||||
|
|||
| 9.1. Dissemination format - News release | |||
According to the SURS publishing policy, data were first published in First Release (in June 2012) as provisional data, including explanations and short methodology. |
|||
| 9.2. Dissemination format - Publications | |||
More detailed results are planned to be published in 2013 in Rapid Reports (in electronic version) with tables, graphs, methodological explanations and definitions. First release (and later Rapid Reports) is sending to all our users of ZAP/M statistical survey. |
|||
| 9.3. Dissemination format - online database | |||
See URL. Annexes: SI-STAT Data Portal |
|||
| 9.3.1. Data tables - consultations | |||
[Not requested] |
|||
| 9.4. Dissemination format - microdata access | |||
Individual data are also available in the safe room at SURS. |
|||
| 9.5. Dissemination format - other | |||
To the reporting units no results will be sent, only on their explicit request. |
|||
| 9.6. Documentation on methodology | |||
Subscribed users on ZAP/M statistical survey received an e-mail notification of First release of provisional SES data. Publication with final data will be also sent to all ZAP/M statistical survey. Only electronic version will be available on SURS internet sites, free of charge. After the publication of final data in first quarter 2013, it is planned to publish detailed methodological explanations. |
|||
| 9.7. Quality management - documentation | |||
[Not requested] |
|||
| 9.7.1. Metadata completeness - rate | |||
[Not requested] |
|||
| 9.7.2. Metadata - consultations | |||
[Not requested] |
|||
|
|||
[Not requested] |
|||
|
|||
| 11.1. Confidentiality - policy | |||
[Not requested] |
|||
| 11.2. Confidentiality - data treatment | |||
[Not requested] |
|||
|
|||
- |
|||
|
|||
|
|||