|
 |
|
| For any question on data and metadata, please contact: Eurostat user support |
|
|||
| 1.1. Contact organisation | Ministry for Economy and Employment |
||
| 1.2. Contact organisation unit | Office for Strategy and Studies |
||
| 1.5. Contact mail address | Rua da Prata, nº 8 1149-057 LISBOA |
||
|
|||
| 2.1. Data description | |||
Brief description of the Structure of Earnings Statistics 2010 a) Entity responsible for the SES statistics The public body responsible for the SES statistics was the Office for Strategy and Planning of the Ministry of Solidarity and Social Security. The Office was a delegate body of the National Institute of Statistics for labour market statistics, vocational training and other. According to the Decree Law Nº 126-C/2011, of December the 29th, organic law of the Ministry for Economy and Employment, the competences to collect statistical information on the labour market, employment and vocational training reside now with the Office for Strategy and Studies of the Ministry. The transition process is now being completed. The entity to contact regarding these statistics is: Office for Strategy and Studies of the Ministry for Economy and Employment Rua da Prata, nº 8 1149-057 LISBOA Tel: (+351) 217921372 Web site: www.gee.min-economia.pt
b) Regional coverage Portugal
c) Activity coverage NACE Rev 2 Sections B to S
d) Size classes covered Local Units of enterprises and other entities with 10 or more employees.
e) Sources of the data The Structure of Earnings Statistics 2010 in Portugal were obtained by combining three sources: (a) an administrative source which provide micro data on enterprises, local units and employees, covering all the European required information on monthly earnings and hours paid, as well as the demographic information characterizing the employee, in existence since 1981; (b) a specific survey to collect the missing information, regarding the variables on an annual basis and also Social Security and Income taxes; (c) a specific survey for public bodies of Sections P, Q, R and S of NACE Rev. 2, to collect all required information, monthly and annual, on employees and wages. |
|||
| 2.2. Classification system | |||
Not available. |
|||
| 2.3. Coverage - sector | |||
Not available. |
|||
| 2.4. Statistical concepts and definitions | |||
Not available. |
|||
| 2.5. Statistical unit | |||
Not available. |
|||
| 2.6. Statistical population | |||
Not available. |
|||
| 2.7. Reference area | |||
Not available. |
|||
| 2.8. Coverage - Time | |||
Not available. |
|||
| 2.9. Base period | |||
Not available. |
|||
|
||||||||||||||||
| 3.1. Source data | ||||||||||||||||
Sources of the data The Structure of Earnings Statistics 2010 in Portugal were obtained by combining three sources: (a) an administrative source which provide micro data on enterprises, local units and employees, covering all the European required information on monthly earnings and hours paid, as well as the demographic information characterizing the employee, in existence since 1981; (b) a specific survey to collect the missing information, regarding the variables on an annual basis and also Social Security and Income taxes; (c) a specific survey for public bodies of Sections P, Q, R and S of NACE Rev. 2, to collect all required information, monthly and annual, on employees and wages.
1. Quadros de Pessoal (Lists of Personnel) – Annex A of the Unified Report As most of the information requested for Statistics on the Structure and Distribution of Earnings was available in Portugal as the result of an administrative source designated as “Quadros de Pessoal”, the option was to obtain data on the structure of earnings through “Quadros de Pessoal” and to complete the information required by means of a specific sample survey. Since 2009, the Quadros de Pessoal is one of the annexes of the Unified Report, an administrative source integrating information on enterprises, local units, employment, vocational training, health and security at work, strikes, etc. This administrative source was created for purposes of inspection the accomplishment of labour legislation and has been statistically treated since 1981, although it had previous legal existence. The statistical use was established by Decree nº 380/80, from September the 17th. The legislation presently in force is the Law nº 7/2009, of February the 12th, the Labour Code, and the regulation of the report, the “Portaria” nº 55/2010, of January the 21st. As regulated, the enterprises have to provide all the information by electronic data transfer.
The variables collected related to the enterprise or the local unit in the scope of SES are as follows:
The variables related to each of the persons occupied in the reference month are the following:
2. Structure of Earnings Survey 2010 As some of the variables requested at European level where not available through “Quadros de Pessoal”, it was decided to carry out a specific sample survey in order to collect the missing information. That information consisted mostly of annual data on earnings, annual days of holidays, other paid absences and social security payments and income tax payments. The scope of the survey covers industries comprised in Sections B to S, excluding O, of NACE Rev. 2 and employees in enterprises with 10 or more persons occupied. For the public part of NACE Rev. 2 Sections P, Q, R and S, there was no administrative information on employees available with the required breakdowns. The sample was obtained from the registers of the Directorate General for Administration and Public Employment and the questionnaire collected all the variables specified in the implementation arrangements, either monthly or annual. The data collection was performed via 2 web questionnaires, one for “private” entities and other for public bodies.
Sampling plan Sampling design
Population At the 1st stage, the population for this survey is the local units of the national territory, belonging to private sector enterprises with at least 10 employees, referring to economic activities defined in sections B to S of NACE Rev. 2, with the exception of class 94.91 (activities of religious organisations) and class 94.92 (activities of political organisations) and section O ( Public administration and defense; compulsory social security). Education (section P) and Human health and social work (section Q) activities include both private enterprises and public enterprises with 10 or more employees. At the 2nd stage, the population consists of all employees in the local units.
Framework The framework for this survey was built from the Business Register of Enterprises and Local Units of GEP / MSSS, taking into account the conditions required for the universe of reference. The Business Register is based on the administrative source "Quadros de Pessoal," which reference period is the month of October of each year. The file of public enterprises with Education and Human health and social work activities from the Directorate General for Administration and Public Employment was used to complement the business register.
Drawing the Sample
Methodology for design and selection of the sample Primary Units The sample design considered in this survey involve a simple two-stage cluster sampling. At the first sampling stage, the clusters are the local units which are selected by stratified random sampling; employees are selected at the second stage by simple random sampling within each local unit selected at the first stage. In the first stage, the primary units are defined by local units of enterprises with 10 or more employees of sections B to S, except O, of NACE Rev. 2. In the second stage, the secondary unit concerns the employees who belong to the local unit.
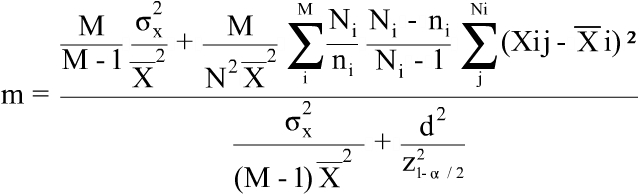
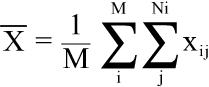
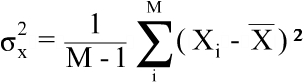
Overall size of the sample and breakdown by strata The number of primary units to be selected for the private sector was determined for each of the regions defined by NUTS I (Continente, Região Autónoma da Madeira and Região Autónoma dos Açores). The size of these samples based on a study that considered as a variable of interest the "monthly gain" of full time employees and with full pay. To ensure a relative error not exceeding 'd', between the estimate and the real value of the variable of interest mentioned, and assuming a sample rate on the second stage, it was determined the number of primary units (m) according to the following expression:
Note that,
where, M – number of local units in the population N – number of employees in the population i - index of local unit Ni - number of employees in the local unit i ni - number of employees selected in the local unit i j - index of employee Xij - monthly gross earnings of employee j of the local unit i d - relative error z(1-α/2)=1.96 quantile of order (1-α/2), a=0.05 of Z~N(0,1)
It was considered a confidence level of 95% and a relative error of 2.3% for Continente and 5% for the Autonomous Regions. The sampling rate in the second stage was established according to the dimension of the local unit and the previous SES survey. The sample size was multiplied by a correction factor for non response. The sample size of the primary units according to NUTS I, was 10637 for Continente,1211 for Região Autónoma dos Açores and 1277 for Região Autónoma da Madeira. The allocation of sample of primary units to the strata is developed from the decomposition of the universe of reference, through the intersection of variables: NUTS 2 (North, Central, Lisbon, Alentejo and Algarve), the economic activity of the primary unit down to the level of division of NACE Rev. 2 and class size of the enterprise. The class size of the local unit is defined based on variable “number of employees" (10-19, 20-49, 50-99,100-249, 250-499, 500-999 and 1000 or +).
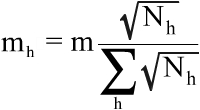
The allocation of the sample by the strata is done proportionally to the square root of the variable total number of employees (power allocation r=1/2). The number of primary units in the NUTS 2 i, economic activity j, class size of the enterprise k, the stratum h = (i, j, k), is given by:
where, Nh is the total number of employees in local units of stratum h; m is the sample size.
It was established that the minimum number of local units sampled in each stratum is four units in Mainland and ten units in Autonomous Regions.
Sample Selection The sample selection of the local units within strata is made using systematic sample with random start. In the second stage, the secondary units were selected by the respondent's primary unit according to the class size of the respective unit and month of birth of employees, as presented in the table below.
This criterion for selection took into account the uniform distribution of the months of birth of the employees in the primary units. It was increased the number of months in the smaller units in order to ensure a more reasonable response rate. The sample size was about 133.600 employees for Continente, 9.300 for Região Autónoma da Madeira and 8.600 for Região Autónoma dos Açores. The Table in Annex 1 Population and Sample presents the number of enterprises and the number of employees in the sampling frame, the sample size and the net sample size.
Software IBM SPSS version 20.0 - Complex Samples module was used to select the sample, in the estimation and to calculate the variance of the estimates.
Linkage of the two sources The web application allowed the enterprises to select the employees sample or to opt for the sample selected by the Office. The information on the local unit surveyed was presented on the screen and also the identification numbers of the selected employees. The enterprises filled in the required information. If the respondent performed the selection (on the basis of the birth months, as specified on the explanatory notes), also the identification code was filled-in, to allow the linkage with the administrative source data. In linking the information, the coherence of certain variables deriving from the two sources was checked (monthly and annual earnings, for example). Final results were obtained after estimating procedures applied to data collected for the local units and employees in the sample. Variables such as economic activity, size class and region were re-weighted based on the comprehensible information resulting from 2010 “Quadros de Pessoal”.
Variables which had to be converted into Eurostat’s classifications Collective agreement on pay covering the employees of the reporting unit - The type of collective labour regulations existing in Portugal and that can be identified through “Quadros de Pessoal” do not fit in exactly with the four categories specified at Community level, although they were integrated in those categories after a specific analysis of the scope of all collective agreements. The types of agreements that can be isolated within the administrative source are briefly described as follows:
Total number of persons employed in the reporting unit during the reference month - The total number of persons employed in the local unit, at national level, do not include trainees without an employment contract and voluntary workers. Only employees, active proprietors, family workers and co-operative active members are considered, but only employees were surveyed. Highest completed level of education and training - this information, referring to formal education and collected in “Quadros de Pessoal” with greater desegregation for third level qualifications. Type of employment contract - for this variable only three hypotheses were considered: indefinite duration contract, contract with a fixed term (fixed duration or completion of a certain task, return of an employee) and other contracts (active co-operative members, not specified situations). Apprenticeship contracts, corresponding to training contracts usually assuming a dual apprenticeship system, in the school and in the enterprise, are not covered by “Quadros de Pessoal” as the persons involved in this system are not considered employees, are not paid by the enterprise and for Social Security purposes also do not count as employees. Reflection of absences on monthly earnings - three situations, concerning monthly earnings and hours paid for, can be isolated in “Quadros de Pessoal”, by analysing the individual information on normal weekly hours of work, monthly hours paid for excluding overtime and monthly basic wage pay. (a) The first situation corresponds to employees being paid the complete basic wage in the reference month (a deduction of three days pay is allowed) and consequently having filled in complete hours paid for; (b) then there can be employees who did not receive complete monthly basic wage and consequently have reduced hours paid for; (c) employees who have a contract with the enterprise in the reference month but who have not received any pay and have no hours paid for. For employees who did not receive complete pay during the reference month, the earnings were imputed using the hourly rate payment they had for the period they had worked and received payment, on the basis of the working time in the local unit. Employees who did not receive pay during the reference month were excluded from the survey. Annexes: Annex 1 Population and Sample |
||||||||||||||||
| 3.2. Frequency of data collection | ||||||||||||||||
[Not requested] |
||||||||||||||||
| 3.3. Data collection | ||||||||||||||||
Variables surveyed
For the “private sector” survey, the variables included were the following:
Relating to the local unit:
Relating to the employee:
For the public sector, all the variables were surveyed. |
||||||||||||||||
| 3.4. Data validation | ||||||||||||||||
[Not requested] |
||||||||||||||||
| 3.5. Data compilation | ||||||||||||||||
For further information on Estimators please see the attached document. Annexes: Estimators |
||||||||||||||||
| 3.6. Adjustment | ||||||||||||||||
[Not requested] |
||||||||||||||||
|
|||
| 4.1. Quality assurance | |||
Not available. |
|||
| 4.2. Quality management - assessment | |||
[Not requested] |
|||
|
|||
| 5.1. Relevance - User Needs | |||
The main users of this kind of data are: The Ministry for Economy and Employment, for the analysis of wage formation, minimum wage regulation, labour regulation analysis and labour market analysis. The information required regards tabular data and micro data. The National Institute of Statistics, for National Accounts, among other projects. Research bodies of Universities, for specific studies and modelling. The Bank of Portugal uses the micro data for research projects. Employers’ associations and Unions, with relevance for data for labour negotiations. The information is provided on requirement, on tabular form. |
|||
| 5.2. Relevance - User Satisfaction | |||
There is no survey on the satisfaction of users regarding SES. Here are presented the main users of equivalent SES data in the administrative source. Being the only source that provides micro data on the composition of earnings and employee’ variables, besides employer’s characteristics, (with annual periodicity), this information is regarded by users as of the most utility. |
|||
| 5.3. Completeness | |||
[Not requested] |
|||
| 5.3.1. Data completeness - rate | |||
[Not requested] |
|||
|
|||
| 6.1. Accuracy - overall | |||
[Not requested] |
|||
| 6.2. Sampling error | |||
See the coefficents of variation |
|||
| 6.2.1. Sampling error - indicators | |||
Coefficient of variation For further information on the calculation please see the attached document Coefficients of variation - calculation.
Please see also the attached document Coefficients of variation. Please take note that the coefficients of variation are not expressed in percentage. Annexes: Coefficients of variation Coefficients of variation - calculation |
|||
| 6.3. Non-sampling error | |||
Point treated in the sub-items! |
|||
| 6.3.1. Coverage error | |||
The information on activity, region and number of employees in the sampling frame is comprehensibly updated annually, with reference to the month of October of each year. The 2010 sample was selected using the 2010, as data for the administrative source is electronically transmitted. Due to the timely updating of the sampling frame, coverage errors for the private sector have no meaning. The units for public sector do not have considerable changes in the short run. |
|||
| 6.3.1.1. Over-coverage - rate | |||
The over coverage errors are due to non-active local units , local unit with less than 10 employees or misclassification regarding the nace group and size of the enterprise.They were assumed to be negligible since the sampling frame was constructed at the end of the reference period and all sources were used in order to specify the sampling frame. The over-coverage rate is about one percent. |
|||
| 6.3.1.2. Common units - proportion | |||
[Not requested] |
|||
| 6.3.2. Measurement error | |||
The questionnaire used for the administrative source is in place for 26 years, with some minor changes during this period. Enterprises are used to it and, with the comprehensible use of electronic data transmission, they have a better knowledge of the classifications involved. As the electronic data transmission does not allow for non-response for the variables needed for SES, and also the survey did not allow for non-response, the imputation rate for demographic variables and wages was 0. |
|||
| 6.3.3. Non response error | |||
Unit response rate for the survey – 84.1 % unit response rate, corresponding to 79.7 % of the expected employees in the sample. The responses (local units and employees) were re-weighted on the basis of the final results of the administrative source (comprehensibly treated) of local units in the survey scope and of the actual number of employees in the surveyed unit. The response rates for the variables monthly earnings and monthly hours paid, deriving from the administrative source, was 100%, as those are considered mandatory variables in that source. Also for annual earnings, obtained through the sample survey, the variable was mandatory and non-responses were not allowed. As the electronic data transmission does not allow for non-response for the variables needed for SES, and also the survey did not allow for non-response, the imputation rate for demographic variables and wages was 0. Social security taxes non-responses (obtained by the survey) were imputed on the basis of the standard social security tax supported by the employee (11 % of earnings for private sector and 11,5% for the civil servants entering the public service prior to 2007). Income taxes were imputed on the basis of an average family situation tax for the corresponding monthly earnings. |
|||
| 6.3.3.1. Unit non-response - rate | |||
[Not requested] |
|||
| 6.3.3.2. Item non-response - rate | |||
[Not requested] |
|||
| 6.3.4. Processing error | |||
The questionnaire used for the administrative source is in place for 26 years, with some minor changes during this period. Enterprises are used to it and, with the comprehensible use of electronic data transmission, they have a better knowledge of the classifications involved. As the electronic data transmission does not allow for non-response for the variables needed for SES, and also the survey did not allow for non-response, the imputation rate for demographic variables and wages was 0. Regarding the monthly earnings, the rate of imputation (for employees that were not at work for part of the reference month and consequently did not receive complete earnings for that month) was 10 %. The imputation was made on the basis of the contractual hours per month and the earnings hourly rate for the period they had worked and had been paid during the reference month. |
|||
| 6.3.4.1. Imputation - rate | |||
Regarding the monthly earnings, the rate of imputation (for employees that were not at work for part of the reference month and consequently did not receive complete earnings for that month) was 10 %. The imputation was made on the basis of the contractual hours per month and the earnings hourly rate for the period they had worked and had been paid during the reference month. |
|||
| 6.3.5. Model assumption error | |||
Not Applicable |
|||
| 6.4. Seasonal adjustment | |||
[Not requested] |
|||
| 6.5. Data revision - policy | |||
[Not requested] |
|||
| 6.6. Data revision - practice | |||
[Not requested] |
|||
| 6.6.1. Data revision - average size | |||
[Not requested] |
|||
|
||||||||||||||||||||||
| 7.1. Timeliness | ||||||||||||||||||||||
Delivery of data to Eurostat – 19 months after the end of the reference period. |
||||||||||||||||||||||
| 7.1.1. Time lag - first result | ||||||||||||||||||||||
[Not requested] |
||||||||||||||||||||||
| 7.1.2. Time lag - final result | ||||||||||||||||||||||
[Not requested] |
||||||||||||||||||||||
| 7.2. Punctuality | ||||||||||||||||||||||
The date for launching the survey was exceptionally late due to the fact that the transmission period for the administrative source was delayed, on request from accountants and service providers, and ended in June 2011. Also there were delays with the contract regarding the IT application to collect the survey data, due to the difficulties the country experiences. |
||||||||||||||||||||||
| 7.2.1. Punctuality - delivery and publication | ||||||||||||||||||||||
[Not requested] |
||||||||||||||||||||||
|
||||||||||||||||||||||||||||||||||||||||||||||||||||||||||||||||||||||||||||
| 8.1. Comparability - geographical | ||||||||||||||||||||||||||||||||||||||||||||||||||||||||||||||||||||||||||||
The classifications used and the definitions of the variables are in accordance with the European requirements. All mandatory variables were obtained. The variable “other annual days of paid absence”, an optional variable, for the employees in public bodies can present values over the Eurostat validation check. All annual days of sick leave for civil servants before 2007, the most important component, are paid by the public bodies, with the exception of 1 sixth of the wages of the first month of absence due to sickness. |
||||||||||||||||||||||||||||||||||||||||||||||||||||||||||||||||||||||||||||
| 8.1.1. Asymmetry for mirror flow statistics - coefficient | ||||||||||||||||||||||||||||||||||||||||||||||||||||||||||||||||||||||||||||
[Not requested] |
||||||||||||||||||||||||||||||||||||||||||||||||||||||||||||||||||||||||||||
| 8.2. Comparability - over time | ||||||||||||||||||||||||||||||||||||||||||||||||||||||||||||||||||||||||||||
The coverage, statistical units and definition of the common variables are identical to those used for the previous 1995, 2002 and 2006 SES. The variable “payments for shift work” was introduced in the administrative source from the year 2009 onwards but was not available before. The variable “payments in kind” was transmitted to Eurostat for the year 2010 (and not in 2006), although there are very few responses available. Expenses such as “company cars” when they exist, are not considered to be of personal use to the employee but as used in the service of the company. The data collection methodologies and procedures (administrative source combined with a specific survey to collect annual variables and information on income taxes and social security taxes, for the private sector) was also maintained. Public institutions data was directly collected from the institutions for the year 2010, contrary to the year 2006, when they were estimated on the basis of an administrative instrument carried out for 2005. |
||||||||||||||||||||||||||||||||||||||||||||||||||||||||||||||||||||||||||||
| 8.2.1. Length of comparable time series | ||||||||||||||||||||||||||||||||||||||||||||||||||||||||||||||||||||||||||||
[Not requested] |
||||||||||||||||||||||||||||||||||||||||||||||||||||||||||||||||||||||||||||
| 8.3. Coherence - cross domain | ||||||||||||||||||||||||||||||||||||||||||||||||||||||||||||||||||||||||||||
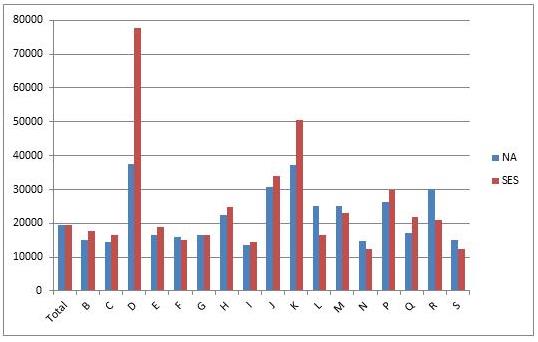
Coherence with the National Accounts The comparison of data was done using SES 2010 variable 4.1 (per employee) variable “wages and salaries” (per employee). The results can be seen on the following table:
Coherence SES 2010 – National Accounts 2010
The comparison is illustrated by the graph below.
Some of the reasons that can explain the differences by NACE, although the total is quite the same, may lay on the differences in the definitions of the variables and also on the scope of the two sources: SES 2010 covers local units of enterprises with 10 or more employees and National accounts refers to the total sizes. |
||||||||||||||||||||||||||||||||||||||||||||||||||||||||||||||||||||||||||||
| 8.4. Coherence - sub annual and annual statistics | ||||||||||||||||||||||||||||||||||||||||||||||||||||||||||||||||||||||||||||
[Not requested] |
||||||||||||||||||||||||||||||||||||||||||||||||||||||||||||||||||||||||||||
| 8.5. Coherence - National Accounts | ||||||||||||||||||||||||||||||||||||||||||||||||||||||||||||||||||||||||||||
[Not requested] |
||||||||||||||||||||||||||||||||||||||||||||||||||||||||||||||||||||||||||||
| 8.6. Coherence - internal | ||||||||||||||||||||||||||||||||||||||||||||||||||||||||||||||||||||||||||||
[Not requested] |
||||||||||||||||||||||||||||||||||||||||||||||||||||||||||||||||||||||||||||
|
|||
| 9.1. Dissemination format - News release | |||
[Not requested] |
|||
| 9.2. Dissemination format - Publications | |||
The results of SES 2010 are disseminated by means of a Synthetic Report (on the Internet Web site) and a Publication (on the Internet Web site). For the Internet dissemination, an alert is sent to the registered users of GEP statistical information. Additional information can be provided on request to the users, in table format. |
|||
| 9.3. Dissemination format - online database | |||
There is no online database for the results of the SES 2010. |
|||
| 9.3.1. Data tables - consultations | |||
[Not requested] |
|||
| 9.4. Dissemination format - microdata access | |||
Microdata can also be delivered on request, for research projects, after anonymization. |
|||
| 9.5. Dissemination format - other | |||
Respondents are not provided with results of the survey, only on request. |
|||
| 9.6. Documentation on methodology | |||
The publication contains a chapter on the concepts and methodologies used, together with illustrative texts and graphs. |
|||
| 9.7. Quality management - documentation | |||
[Not requested] |
|||
| 9.7.1. Metadata completeness - rate | |||
[Not requested] |
|||
| 9.7.2. Metadata - consultations | |||
[Not requested] |
|||
|
|||
No information |
|||
|
|||
| 11.1. Confidentiality - policy | |||
[Not requested] |
|||
| 11.2. Confidentiality - data treatment | |||
[Not requested] |
|||
|
|||
Nothing to comment |
|||
|
|||
|
|||