|
 |
|
| For any question on data and metadata, please contact: Eurostat user support |
|
|||
| 1.1. Contact organisation | Statistics Lithuania |
||
| 1.2. Contact organisation unit | Labour Statistics Division |
||
| 1.5. Contact mail address | 29 Gedimino Ave. LT–01500 Vilnius, Lithuania |
||
|
|||
| 2.1. Data description | |||
The aim of the Report on the quality of the Structure of Earnings Survey is to evaluate the quality of the data from the Structure of Earnings Survey 2010 (SES 2010), focusing on the main areas of interest: relevance, accuracy, punctuality and timeliness, accessibility and clarity, comparability, coherence, trade-offs between output quality components, assessment of user needs and perceptions, costs, performance and respondent burden, confidentiality, transparency and security, and conclusions. The SES has been carried out since 2002 every four years at the individual level (by employees) and is based on the relevant regulating legal acts of the European Union. The data were collected from local units as well as from enterprises, institutions and organizations if they do not have local units (hereinafter referred to as “local units / enterprises”) with one and more employees using the questionnaire DUS-01. Administrative data, namely data on “the number of employees in the enterprise” were used from the State Social Insurance Fund Board (SODRA). The survey period is the year 2010, October was chosen as a representative month of the reference year. The SES covers all economic activities defined in NACE Rev. 2 sections B to S. NACE Section O (Public administration and defence; compulsory social security) is optional; however, it is also covered. The “occupation” is coded according to the Lithuanian Classification of Occupations (LCO), which is based on the International Standard Classification of Occupations (ISCO-08). Due to economic difficulties, the sample size in 2010 was significantly reduced compared to SES 2006. Smaller sample size reduced the accuracy of the results in more detailed breakdown of earnings. Lithuania has no regions; therefore the SES data are provided only at the NUTS 1 level. The results of the SES provide comparable information on the level of earnings and the individual characteristics of employees and their employer. Average earnings (monthly and hourly), average number of employees in full-time units, number of hours paid, annual days of absence, and other indicators are calculated and presented by major occupational group, education, age and sex of the employees, length of service in the enterprise, economic activity, county, size of the enterprise. The gender pay gap which is based on the SES results is calculated as well. Additional information about a sample design, calculation of statistical estimates, as well as an English version of the questionnaire of the SES 2010 is included as well. |
|||
| 2.2. Classification system | |||
Not available. |
|||
| 2.3. Coverage - sector | |||
Not available. |
|||
| 2.4. Statistical concepts and definitions | |||
Not available. |
|||
| 2.5. Statistical unit | |||
Not available. |
|||
| 2.6. Statistical population | |||
Not available. |
|||
| 2.7. Reference area | |||
Not available. |
|||
| 2.8. Coverage - Time | |||
Not available. |
|||
| 2.9. Base period | |||
Not available. |
|||
|
|||
| 3.1. Source data | |||
The survey is conducted applying a sampling method. The list of local units / enterprises from which a sample is selected is based on the list of economic entities in operation from the Statistical Register of Economic Entities. The overall sample fraction of local units / enterprises in the observed activities (sections B–S) was 5.9 per cent (4 328 of the total 73 688 in the population). Sampled local units / enterprises covered 3.4 per cent (40 023 employees of the total 1 164 429 in the population) of the total number of employees.
Sample design A two-stage cluster sample is used. The first stage sampling units are local units / enterprises. The surveyed population of local units / enterprises was stratified by economic activity (B–S NACE Rev. 2,) at a 2-digit level and by the number of employees. The enterprise size bands were grouped as follows: 1–9, 10–49, 50–99, 100–249, 250–499, 500–999 and 1000 and more employees. The second stage sampling units are employees of the selected local units / enterprises. A simple random sample of employees is selected by the local units / enterprises. See also the attached document Sample design, including the number of employees to be selected depended on the size band of the local unit and the sample size of local units / enterprises and employees. Annexes: Sample design |
|||
| 3.2. Frequency of data collection | |||
[Not requested] |
|||
| 3.3. Data collection | |||
[Not requested] |
|||
| 3.4. Data validation | |||
[Not requested] |
|||
| 3.5. Data compilation | |||
[Not requested] |
|||
| 3.6. Adjustment | |||
[Not requested] |
|||
|
|||
| 4.1. Quality assurance | |||
Not available. |
|||
| 4.2. Quality management - assessment | |||
[Not requested] |
|||
|
|||
| 5.1. Relevance - User Needs | |||
Indicators of the structure of earnings are relevant for the assessment of the level of economic development of the country, preparation of the forecasts for the economic growth, evaluation of the State and Government authorities (the Ministry of Social Security and Labour, equal possibilities for men and women). Indicators by occupational group and level of education are used to make decisions related to the labour market as well as social security. The main users are: State and Government authorities – the Ministry of Economy, other ministries, the Presidency, the Seimas (Parliament), the Bank of Lithuania, etc.; in addition to Eurostat (the main user of SES data), other users include the media, representatives of business and science, students, European institutions such as the ILO, etc. The users are mainly interested in breakdowns of earnings by several variables. The most popular variables are occupation, educational level, economic activity and county. |
|||
| 5.2. Relevance - User Satisfaction | |||
As it has been mentioned above, the main users are State and Government authorities, the media, representatives of business and science, students. It could be mentioned that users who have received information on request asked for a more detailed breakdown of earnings (in particular by counties, occupation at a detailed level). Most users, however, seek for information in the database and it is not clear whether SES data meet the demands of users. It is generally perceived that the statistics meet most user needs. |
|||
| 5.3. Completeness | |||
[Not requested] |
|||
| 5.3.1. Data completeness - rate | |||
[Not requested] |
|||
|
|||||||||||||||||||||||||||||||||||||||||||||||||||||||||||||||||||||||||||||||||||||||||||||||||||||||||||||||||||||||||||||||||||||||||||||||||||||||||||||||||||||||
- |
|||||||||||||||||||||||||||||||||||||||||||||||||||||||||||||||||||||||||||||||||||||||||||||||||||||||||||||||||||||||||||||||||||||||||||||||||||||||||||||||||||||||
| 6.1. Accuracy - overall | |||||||||||||||||||||||||||||||||||||||||||||||||||||||||||||||||||||||||||||||||||||||||||||||||||||||||||||||||||||||||||||||||||||||||||||||||||||||||||||||||||||||
Trade-offs between Output Quality Components No important trade-offs had been made. It could be mentioned that, due to the tight budget, the sample size had been reduced and this affected the accuracy at more detailed breakdowns. For example, the most popular indicator – earnings – could not be presented by occupations at a more detailed level and by economic activities and counties. |
|||||||||||||||||||||||||||||||||||||||||||||||||||||||||||||||||||||||||||||||||||||||||||||||||||||||||||||||||||||||||||||||||||||||||||||||||||||||||||||||||||||||
| 6.2. Sampling error | |||||||||||||||||||||||||||||||||||||||||||||||||||||||||||||||||||||||||||||||||||||||||||||||||||||||||||||||||||||||||||||||||||||||||||||||||||||||||||||||||||||||
- |
|||||||||||||||||||||||||||||||||||||||||||||||||||||||||||||||||||||||||||||||||||||||||||||||||||||||||||||||||||||||||||||||||||||||||||||||||||||||||||||||||||||||
| 6.2.1. Sampling error - indicators | |||||||||||||||||||||||||||||||||||||||||||||||||||||||||||||||||||||||||||||||||||||||||||||||||||||||||||||||||||||||||||||||||||||||||||||||||||||||||||||||||||||||
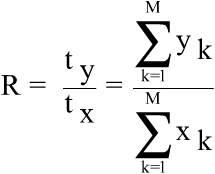
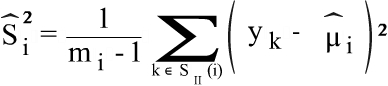
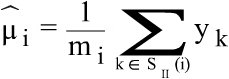
The indicators which are defined as totals of the survey variables are estimated using the Horvitz and Thompson estimator of the finite population total. The indicators defined as a ratio of two finite population totals (e.g. average earnings) are estimated by the ratio of two Horvitz and Thompson estimators. The formulas below are presented for one separate stratum.
The estimate
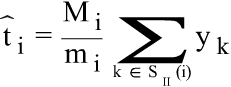
where: L – population size of the first stage sampling units (number of local units / enterprises); Mi – population size of the second stage sampling units in the i-th first stage sampling unit (number of employees in the i-th local unit / enterprise); M – population size of the second stage sampling units (number of employees); M = M1 + M2 + ...+ ML; nI – sample size of the first stage units; mi – sample size of the second stage in the i-th local unit / enterprise; yk – value of the variable y for the k-th sampling unit; k =1,...,M; SI – sample set of the first stage sampling units; SII (i) – sample set of the second stage sampling units in the i-th first stage sampling unit; i =1,...,L.
The ratio
Here
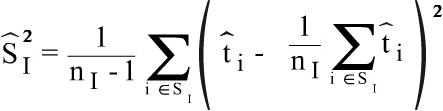
Estimation of variance The estimator of the variance for the estimator of total tˆ for one stratum is calculated by the formula:
where:
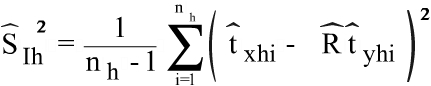
When estimating the variance of the estimate of the total of the survey variable in the group of strata, the estimates of the variance in the corresponding strata are summed up. The estimator of the variance of ratio
where: nh – sample size in the stratum h; Nh – population size in the stratum h (number of local units / enterprises);
Sampling errors The coefficient of variation is calculated for every estimate as an indication of accuracy. Coefficients of variation (CV) concerning gross earnings in the reference month are broken down by:
The coefficients of variation of the estimate of average hourly gross earnings in October 2010 made up 1 per cent. In some domains coefficient of variation for the total gross earnings in October 2010 were quite high due to a small domain and sample size. For employees under 20 years the coefficient of variation for the total gross earnings in October 2010 constituted 12.5 per cent, for ISCED levels 0 and 1 – it constituted 18.7 per cent, for occupation group “skilled agricultural, forestry and fishery workers“ – it constituted 21.3.
See also the attached document Coefficients of variation with detailed tables for the above mentioned breakdowns.
Statistics Lithuania publishes estimates with a coefficient of variation up to 30. The estimates with the coefficient of variation between 10 and 30 per cent are published in brackets, whereas those over 30 per cent are not presented. Annexes: Coefficients of variation |
|||||||||||||||||||||||||||||||||||||||||||||||||||||||||||||||||||||||||||||||||||||||||||||||||||||||||||||||||||||||||||||||||||||||||||||||||||||||||||||||||||||||
| 6.3. Non-sampling error | |||||||||||||||||||||||||||||||||||||||||||||||||||||||||||||||||||||||||||||||||||||||||||||||||||||||||||||||||||||||||||||||||||||||||||||||||||||||||||||||||||||||
- |
|||||||||||||||||||||||||||||||||||||||||||||||||||||||||||||||||||||||||||||||||||||||||||||||||||||||||||||||||||||||||||||||||||||||||||||||||||||||||||||||||||||||
| 6.3.1. Coverage error | |||||||||||||||||||||||||||||||||||||||||||||||||||||||||||||||||||||||||||||||||||||||||||||||||||||||||||||||||||||||||||||||||||||||||||||||||||||||||||||||||||||||
Under / over coverage errors (due to newly-born or non-active enterprises) were assumed to be negligible since the sampling frame was constructed at the end of the reference period and all possible administrative sources were used in order to specify the sampling frame. Some misclassification regarding the NACE group and size of an enterprise were identified and corrected. |
|||||||||||||||||||||||||||||||||||||||||||||||||||||||||||||||||||||||||||||||||||||||||||||||||||||||||||||||||||||||||||||||||||||||||||||||||||||||||||||||||||||||
| 6.3.1.1. Over-coverage - rate | |||||||||||||||||||||||||||||||||||||||||||||||||||||||||||||||||||||||||||||||||||||||||||||||||||||||||||||||||||||||||||||||||||||||||||||||||||||||||||||||||||||||
- |
|||||||||||||||||||||||||||||||||||||||||||||||||||||||||||||||||||||||||||||||||||||||||||||||||||||||||||||||||||||||||||||||||||||||||||||||||||||||||||||||||||||||
| 6.3.1.2. Common units - proportion | |||||||||||||||||||||||||||||||||||||||||||||||||||||||||||||||||||||||||||||||||||||||||||||||||||||||||||||||||||||||||||||||||||||||||||||||||||||||||||||||||||||||
[Not requested] |
|||||||||||||||||||||||||||||||||||||||||||||||||||||||||||||||||||||||||||||||||||||||||||||||||||||||||||||||||||||||||||||||||||||||||||||||||||||||||||||||||||||||
| 6.3.2. Measurement error | |||||||||||||||||||||||||||||||||||||||||||||||||||||||||||||||||||||||||||||||||||||||||||||||||||||||||||||||||||||||||||||||||||||||||||||||||||||||||||||||||||||||
The SES questionnaires were collected from respondents using electronic questionnaires (off-line, .ffdata format). 74.5 per cent of all respondents filled out electronic templates of questionnaires. Other respondents sent data on paper questionnaires. The first verification of data was made in the regional statistical offices. Every statistician has a definite number of enterprises from which the questionnaires have to be collected. Then the collected data were entered, checked and corrected. Each questionnaire was validated according to the validation program. The validation program consists of the arithmetical and logical controls.
The respondents were contacted via phone or e-mail. The second control of the data was accomplished at the Labour Statistics Division in Statistics Lithuania. Enterprises were re-contacted and the required corrections were made in the primary database in cases when errors had been found. Due to the heavy reporting burden respondents made many errors, although detailed explanatory notes were attached to the SES questionnaire with the aim of minimising errors. The total number of transmitted questionnaires made up 42 563 (4 168 with data on the local unit and 38 395 with data on the employee). The total number of errors made up 60 247. On average, 1.41 errors fell per one statistical questionnaire. The variables that have been corrected most often are the following:
|
|||||||||||||||||||||||||||||||||||||||||||||||||||||||||||||||||||||||||||||||||||||||||||||||||||||||||||||||||||||||||||||||||||||||||||||||||||||||||||||||||||||||
| 6.3.3. Non response error | |||||||||||||||||||||||||||||||||||||||||||||||||||||||||||||||||||||||||||||||||||||||||||||||||||||||||||||||||||||||||||||||||||||||||||||||||||||||||||||||||||||||
Response rates of enterprises are provided in the table below:
Response rates of local units / enterprises by economic activity and size band
The total response rate of local units / enterprises is 96.3 per cent. The weights were adjusted according to the non-response rate in each stratum. Statistics Lithuania uses national classification of non-response reasons. The results of the survey showed that 3.7 per cent of sampled local units / enterprises did not respond to the questionnaire, of which 2.4 per cent – due to legal reasons and 1.3 cent – due to illegal ones. Legal reasons are as follows: the bankruptcy of the enterprise, its liquidation and suspension of economic activity. The non-response to the questionnaire committed by an operating or not found enterprise or local unit is treated as an illegal reason. |
|||||||||||||||||||||||||||||||||||||||||||||||||||||||||||||||||||||||||||||||||||||||||||||||||||||||||||||||||||||||||||||||||||||||||||||||||||||||||||||||||||||||
| 6.3.3.1. Unit non-response - rate | |||||||||||||||||||||||||||||||||||||||||||||||||||||||||||||||||||||||||||||||||||||||||||||||||||||||||||||||||||||||||||||||||||||||||||||||||||||||||||||||||||||||
[Not requested] |
|||||||||||||||||||||||||||||||||||||||||||||||||||||||||||||||||||||||||||||||||||||||||||||||||||||||||||||||||||||||||||||||||||||||||||||||||||||||||||||||||||||||
| 6.3.3.2. Item non-response - rate | |||||||||||||||||||||||||||||||||||||||||||||||||||||||||||||||||||||||||||||||||||||||||||||||||||||||||||||||||||||||||||||||||||||||||||||||||||||||||||||||||||||||
[Not requested] |
|||||||||||||||||||||||||||||||||||||||||||||||||||||||||||||||||||||||||||||||||||||||||||||||||||||||||||||||||||||||||||||||||||||||||||||||||||||||||||||||||||||||
| 6.3.4. Processing error | |||||||||||||||||||||||||||||||||||||||||||||||||||||||||||||||||||||||||||||||||||||||||||||||||||||||||||||||||||||||||||||||||||||||||||||||||||||||||||||||||||||||
- |
|||||||||||||||||||||||||||||||||||||||||||||||||||||||||||||||||||||||||||||||||||||||||||||||||||||||||||||||||||||||||||||||||||||||||||||||||||||||||||||||||||||||
| 6.3.4.1. Imputation - rate | |||||||||||||||||||||||||||||||||||||||||||||||||||||||||||||||||||||||||||||||||||||||||||||||||||||||||||||||||||||||||||||||||||||||||||||||||||||||||||||||||||||||
- |
|||||||||||||||||||||||||||||||||||||||||||||||||||||||||||||||||||||||||||||||||||||||||||||||||||||||||||||||||||||||||||||||||||||||||||||||||||||||||||||||||||||||
| 6.3.5. Model assumption error | |||||||||||||||||||||||||||||||||||||||||||||||||||||||||||||||||||||||||||||||||||||||||||||||||||||||||||||||||||||||||||||||||||||||||||||||||||||||||||||||||||||||
No models of assumption errors were used in the SES 2010. |
|||||||||||||||||||||||||||||||||||||||||||||||||||||||||||||||||||||||||||||||||||||||||||||||||||||||||||||||||||||||||||||||||||||||||||||||||||||||||||||||||||||||
| 6.4. Seasonal adjustment | |||||||||||||||||||||||||||||||||||||||||||||||||||||||||||||||||||||||||||||||||||||||||||||||||||||||||||||||||||||||||||||||||||||||||||||||||||||||||||||||||||||||
[Not requested] |
|||||||||||||||||||||||||||||||||||||||||||||||||||||||||||||||||||||||||||||||||||||||||||||||||||||||||||||||||||||||||||||||||||||||||||||||||||||||||||||||||||||||
| 6.5. Data revision - policy | |||||||||||||||||||||||||||||||||||||||||||||||||||||||||||||||||||||||||||||||||||||||||||||||||||||||||||||||||||||||||||||||||||||||||||||||||||||||||||||||||||||||
[Not requested] |
|||||||||||||||||||||||||||||||||||||||||||||||||||||||||||||||||||||||||||||||||||||||||||||||||||||||||||||||||||||||||||||||||||||||||||||||||||||||||||||||||||||||
| 6.6. Data revision - practice | |||||||||||||||||||||||||||||||||||||||||||||||||||||||||||||||||||||||||||||||||||||||||||||||||||||||||||||||||||||||||||||||||||||||||||||||||||||||||||||||||||||||
Transparency No mistakes were found in the SES 2010 after the information was published. |
|||||||||||||||||||||||||||||||||||||||||||||||||||||||||||||||||||||||||||||||||||||||||||||||||||||||||||||||||||||||||||||||||||||||||||||||||||||||||||||||||||||||
| 6.6.1. Data revision - average size | |||||||||||||||||||||||||||||||||||||||||||||||||||||||||||||||||||||||||||||||||||||||||||||||||||||||||||||||||||||||||||||||||||||||||||||||||||||||||||||||||||||||
[Not requested] |
|||||||||||||||||||||||||||||||||||||||||||||||||||||||||||||||||||||||||||||||||||||||||||||||||||||||||||||||||||||||||||||||||||||||||||||||||||||||||||||||||||||||
 of two totals ty and tx is estimated by
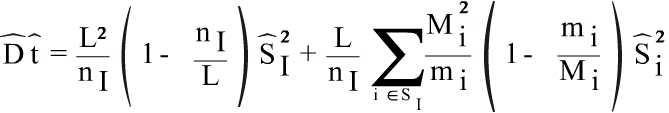
 is calculated using only the variance of the first stage.
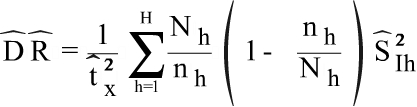
|
|||
| 7.1. Timeliness | |||
The time interval between the release of the publication and the end of the reference period was 21 months. |
|||
| 7.1.1. Time lag - first result | |||
[Not requested] |
|||
| 7.1.2. Time lag - final result | |||
[Not requested] |
|||
| 7.2. Punctuality | |||
On the 11th of November 2010, all the points to be accomplished regarding the SES 2010 were scheduled in “The Plan of Activities for SES 2010”. On the 27th of December, the statistical questionnaire DUS-01 and the methodical explanations for filling in the questionnaire of the Structure of Earnings Survey were approved by the Order No. DĮ- 269 of the Director General of Statistics Lithuania. The questionnaire DUS-01 is presented in Annex Questionnaire. A sample for the SES 2010 was drawn in November 2010. Letters for the sampled enterprises with no local units / enterprises were sent on 30 December 2010, for the enterprises that had local units / enterprises – on 10 January 2011. The letters informed concrete statistical units about the participation in the SES 2010 and invited them to submit the questionnaire until 15 March 2011. Part of respondents asked for more time and it was allowed to deliver the questionnaires later. The rest of enterprises received reminders. Part of data were collected electronically. Data received from electronic questionnaires were transferred to the main database. The number of completed electronic questionnaires received accounted for 74.5 per cent of all filled in questionnaires. Regional statistical offices collected, checked, corrected, coded data according to an approved schedule. The data processing period in regional statistical offices stopped on the 31st of October 2011. The second control of data was accomplished by the Labour Statistics Division of Statistics Lithuania till the end of December 2011. The preparation of software for the calculation of estimates and standard errors continued until March 2012. The calculation of estimates, as well as verification of data at the aggregated level and their analysis, the coherence with data from other sources continued until June 2012. Data of the SES 2010 were transmitted to Eurostat on 28 June 2012. The press release and publication were prepared according to the Advance Release Calendar – on 3 July and 18 October 2012. Annexes: Annex Questionnaire |
|||
| 7.2.1. Punctuality - delivery and publication | |||
[Not requested] |
|||
|
|||
| 8.1. Comparability - geographical | |||
The indicators were collected according to the Commission Regulation (EC) No. 1916/2000 implementing Council Regulation (EC) 530/1999 concerning structural statistics on earnings and on labour costs. All mandatory indicators were collected. Some optional indicators were collected as well. They were as follows:
Some additional indicators for the calculation of aggregated indicators according to the EC Regulations were collected:
|
|||
| 8.1.1. Asymmetry for mirror flow statistics - coefficient | |||
[Not requested] |
|||
| 8.2. Comparability - over time | |||
The time series of the indicator is not fully comparable. Data of the SES 2006 and 2002 are not directly comparable because the SES in 2002 did not cover individual enterprises. Data, excluding individual enterprises, are totally comparable. Surveys in 2002 and 2006 covered economic activities defined in sections from C to O of EVRK Rev. 1.1. The occupations of employees were classified according to the Lithuanian Classification of Occupations (LCO 2000 and LCO 2005), which is based on the International Standard Classification of Occupations (ISCO-88 and ISCO-88 (COM)). In the 2010 survey, statistical data were collected from economic activities from B to S according NACE Rev. 2. Occupations of employees are classified according to the Lithuanian Classification of Occupations LCO 2008, which is based on the International Standard Classification of Occupations (ISCO-08). No specific changes in definitions, coverage and methods occurred in 2010 compared to previous surveys. |
|||
| 8.2.1. Length of comparable time series | |||
[Not requested] |
|||
| 8.3. Coherence - cross domain | |||
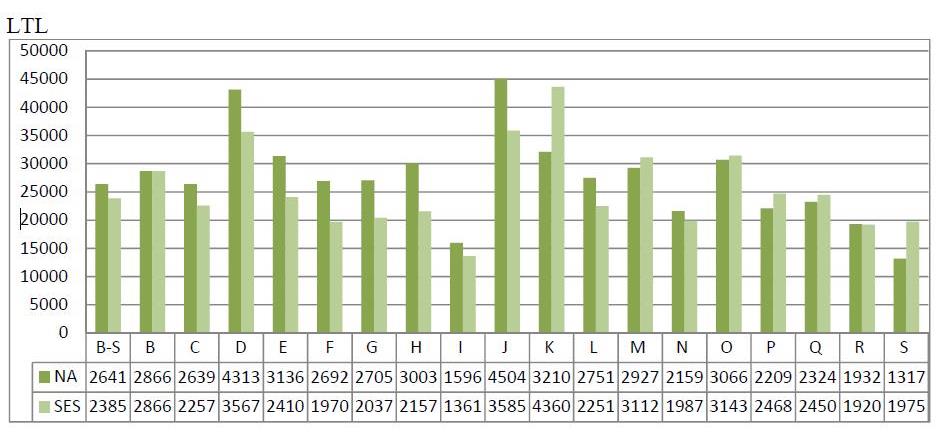
Comparison was made between the variable “gross annual earnings in the reference year” expressed per employee and the variable “wages and salaries” per employee of NA. The results are showed in figure below.
Gross annual earnings (SES) and annual wages and salaries (NA) per employee in 2010
In some NACE sections, “wages and salaries” figures from NA are higher than the SES average. These differences can be due to different methodologies used, different data sources, rate of black economy in NA, gratuities and daily allowances which are included in NA but not taken into account in SES. |
|||
| 8.4. Coherence - sub annual and annual statistics | |||
[Not requested] |
|||
| 8.5. Coherence - National Accounts | |||
[Not requested] |
|||
| 8.6. Coherence - internal | |||
[Not requested] |
|||
|
|||
| 9.1. Dissemination format - News release | |||
[Not requested] |
|||
| 9.2. Dissemination format - Publications | |||
The publication “Structure of Earnings 2010” is accessible for everybody free of charge for reading and downloading. The publication presents information on the number of employees, earnings, working time, etc. by employees’ occupation, level of education, age, length of service in the enterprise, sex, economic activity, etc. Statistical information is presented at the national and county levels. The main results of the survey were also published in the Statistical Yearbook of Lithuania 2012 available free of charge on the website of Statistics Lithuania. |
|||
| 9.3. Dissemination format - online database | |||
The information on the SES results, i.e. the number of employees, gross earnings by various breakdowns is accessible for everybody free of charge in the Database of Indicators on the Official Statistics Portal Lithuania at http://osp.stat.gov.lt/en/rodikliai2 |
|||
| 9.3.1. Data tables - consultations | |||
[Not requested] |
|||
| 9.4. Dissemination format - microdata access | |||
[Not requested] |
|||
| 9.5. Dissemination format - other | |||
On the basis of the SES data the structural indicator Gender Pay Gap has been calculated. The SES data were used for the ILO Yearbook of Labour Statistics Questionnaire. |
|||
| 9.6. Documentation on methodology | |||
The SES metadata is available on the Official Statistics Portal Lithuania http://osp.stat.gov.lt/en/metainformacija9 The SES methodology (in Lithuanian) is also available on the Official Statistics Portal Lithuania at http://osp.stat.gov.lt/en/metodai19 |
|||
| 9.7. Quality management - documentation | |||
[Not requested] |
|||
| 9.7.1. Metadata completeness - rate | |||
[Not requested] |
|||
| 9.7.2. Metadata - consultations | |||
[Not requested] |
|||
|
|||
Statistics Lithuania is constantly putting efforts to facilitate the process of filling in statistical reports as much as possible. In 2010, a local unit spent, on average, 4 hours and 30 minutes for preparation of statistical data and filling in the questionnaire. It is obvious that a large local unit with a big number of employees spent more time: those having up to 10 employees spent one hour and 47 minutes, while those with 10 and more employees – on average 6 hours. The sample rotation is performed in order to reduce the burden for small enterprises, i.e. part of the enterprises (about 25 per cent) is randomly dropped from the sample, and new enterprises are randomly sampled to replace them. |
|||
|
|||
| 11.1. Confidentiality - policy | |||
Confidentiality SES data provided by Statistics Lithuania satisfy the requirements of data confidentiality, which are determined by national legislation: the Law on Statistics and the Law on Legal Protection of Personal Data of the Republic of Lithuania. Confidential statistical data are provided to scientific institutions only for scientific purposes; prior to the provision of such data, an agreement on statistical data provision for scientific purposes must be signed with Statistics Lithuania. A Description of the Provision of Confidential Statistical Data for Scientific Purposes, approved on 18 April 2008 by Order No 106 of the Director General of Statistics Lithuania, regulates the confidentiality of statistical data for scientific purposes. According to this Description, confidential statistical data can be provided for the use for scientific purposes only in such a way that respondents could not be directly identified from the data. The data used for the production of statistics are considered confidential when they allow statistical units to be identified, either directly or indirectly. Rules for the secure management of electronic information in the statistical information system, approved on 12 March 2008 by Order No 76 of the Director General of Statistics Lithuania, regulate the confidentiality of statistical data and statistical information. The description of Statistical disclosure control methods approved on 27 May 2008 by Order No 124 of the Director General of Statistics Lithuania describes the basic principles and guidelines of statistical disclosure control ensuring such processing of statistical information that allows to publish it without disclosing confidential information. Statistical data and information can be released if they meet the following requirements:
The data that do not meet the requirements listed above can be released or provided only with a written permission of a statistical unit (respondent).
Security The majority of statistical reports were filled out electronically, which enables faster and safer submission of statistical data. A paper questionnaire DUS-01 of the SES (containing primary data) is archived and kept for 3 years. Micro data of the SES are stored in the Oracle database. Macro data are archived and stored on a local disk data |
|||
| 11.2. Confidentiality - data treatment | |||
[Not requested] |
|||
|
|||
Conclusion The requirements of EC regulations have been fully met and SES 2010 micro data were transmitted to Eurostat on schedule. |
|||
|
|||
|
|||